OFS Note | Mining
January 30, 2015
Coal India Ltd.
SUBSCRIBE
Issue Open: January 30, 2015
Attractively Priced
Issue Close: January 30, 2015
Incorporated in 1973, Coal India Ltd (CIL) is the largest coal producer in the
Issue Details
world with reserves of
65bn tonnes. The company produced
462MT and
dispatched 472MT of raw coal in FY2014. CIL accounts for 81.1% of India's
Face Value: `10
overall coal production and commands ~74% of the Indian coal market. The
Present Eq. Paid-up Capital: `6,316cr
company has 429 mines of which 237 are underground, 166 opencast and 26
Offer Size: 63.16cr Shares
are mixed mines.
Post Eq. Paid-up Capital: `6,316cr
Volume growth to drive revenues: The coal ministry is making all efforts to
resolve issues related to various mining projects. For the first time, the government
Issue size (amount): `22,386cr
will be drawing mine-wise plans to help CIL achieve production targets. The
OFS Floor Price: `358
government is also showing strong signs of acting swiftly on important reforms,
Retail Discount: 5%
such as land acquisition. Although, we do not expect CIL to achieve its production
OFS Floor Price (Retail): `340
growth target of 12.2% (CAGR) over FY2014-20, with such support from the
government, we expect production to grow at a CAGR of ~8% over FY2014-20,
Post-issue implied market cap: `238,948cr
much higher than its historical CAGR of just 2.8% over FY2009-14.
Promoters holding Pre-Issue: 89.7%
Operating efficiencies and low realisations to help improve margins:
Promoters holding Post-Issue: 79.7%
CIL’s net realisation is significantly lower than the landed price of imported coal,
providing enough cushion against any decline in international coal prices. The
Post Issue Shareholding Pattern
gap also provides ample scope for CIL to pass on any cost escalations. The
increasing share of washed coal will also help improve realisations. Further,
Promoters Group
79.7
technological and infrastructural enhancements, coupled with operating
MF/Banks/Indian
FIs/FIIs/Public &
efficiencies from rising production will help to keep production costs low.
Others
20.3
Outlook and valuation: At the offer-for-sale (OFS) price of `358, the stock is
available at ~11.4x the consensus FY2017E EPS of `31.4. Retail shareholders will
get an additional discount of 5%, implying an OFS price of `340. At the OFS
price for retail bidders, the stock is available at a P/E ratio of 10.8x consensus
FY2017E EPS, which is attractive. We also believe, post issue, the overhang of the
share sale on the price will be gone. Hence, we recommend investors to apply for
CIL shares in the OFS.
Key financials (Consolidated)
Y/E March (` cr)
FY11
FY12
FY13
FY14
Net sales
50,229
62,415
68,303
68,810
% chg
12.6
24.3
9.4
0.7
Net profit
10,867
14,788
17,356
15,112
% chg
12.9
36.1
17.4
(12.9)
FDEPS (`)
17.2
23.5
27.6
23.9
OPM (%)
26.8
25.1
26.5
23.2
P/E (x)
22.0
16.1
13.7
15.8
P/BV (x)
7.2
5.9
4.9
5.6
RoE (%)
36.8
40.1
39.0
33.3
RoCE (%)
37.5
35.8
35.6
30.3
Rahul Dholam
EV/Sales (x)
4.0
3.1
2.7
2.6
Tel: 022- 39357600 Ext: 6847
EV/EBITDA (x)
15.0
12.4
10.1
11.1
Source: Company, Angel Research
Please refer to important disclosures at the end of this report
1
Coal India | OFS Note
Company Background
Incorporated in 1973, Coal India Ltd is the largest coal producer in the world with
reserves of 65bn tonnes. The company produced 462MT and dispatched 472MT
of raw coal in FY2014. CIL accounts for 81.1% of India's overall coal production
and commands nearly 74% of the Indian coal market. Coal operations are
primarily carried out across 82 mining areas through its seven wholly owned
subsidiaries, spread across 8 provincial states of India. The company has 429
mines of which 237 are underground, 166 opencast and 26 are mixed mines. CIL
also operates 17 coal washeries (13 coking coal and 4 non-coking coal) with a
total capacity of 39.4MTY.
With more than 60% of the country’s installed power capacity being coal based,
the power sector accounts for ~75% of the coal off take. CIL accounts for ~76% of
total thermal power generating capacity of the Utility sector.
The company was granted the 'Maharatna' status on 11 April, 2011 by the
Government of India making it the 5th PSU in the country, of a total of 215 public
sector companies, to have been conferred with this status.
Issue Details
The Promoter (Government of India), proposes to sell 31,58,18,220 equity shares
of face value of `10 each representing 5% of the total paid up equity share capital
of the company, with an option to sell an additional 5% stake. CIL has fixed the
OFS floor price at `358 per share (at a 5.4% discount to its closing price as on
January 29, 2015). Retail shareholders will get an additional discount of 5%,
implying a floor price of `340. For the first time, 20% of the issue is reserved for
retail investors, as against the minimum requirement of 10%.
Exhibit 1: Shareholding Pattern
Pre-Issue
Post-Issue
Particulars
No. of shares
(%)
No. of shares*
(%)
Promoter and promoter group
5,66,26,90,126
89.7
5,03,10,53,686
79.7
Total public holding
65,36,74,274
10.3
1,28,53,10,714
20.3
Total
6,31,63,64,400
100
4,13,05,25,289
100
*Assuming issue of the optional shares
Source: Company, Angel Research
January 30, 2015
2
Coal India | OFS Note
Investment rationale
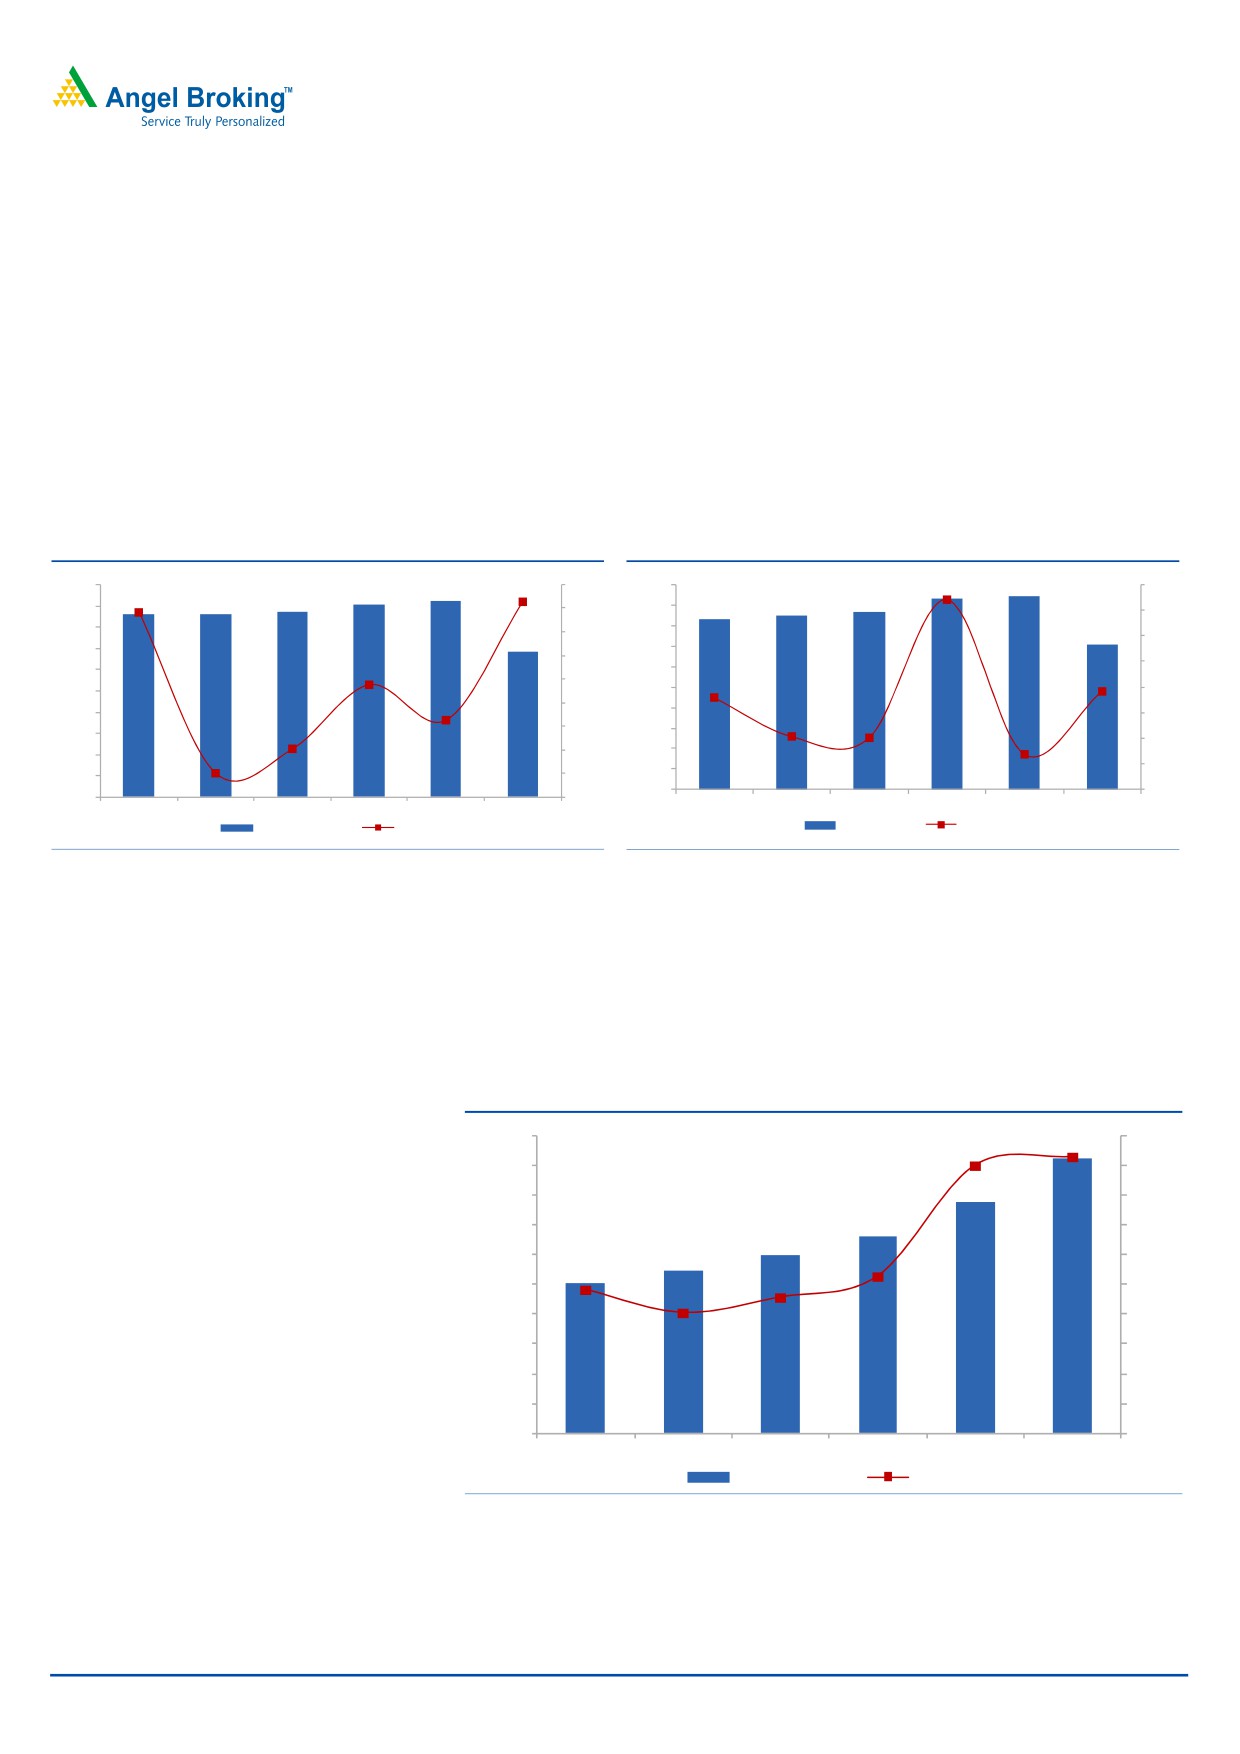
Strong production growth to drive revenues
Coal India’s production increased 7.3% yoy in 9MFY2015 to 355MT, as against a
muted growth of 2.3% in FY2014. Two of its subsidiaries, Mahanadi Coalfields
and Western Coalfields, which account for 1/3rd of its production, expect double
digit growth in output this fiscal, as they use more sophisticated machinery and
expand mines. Off take growth also picked up to 3.8% yoy in 9MFY2015 as
against 1.4% in FY2014. Production and offtake growth jumped significantly in
3Q2015 at 10.7% and 6.3% yoy, respectively after a muted 1H2015.
Exhibit 2: Production (MT)
Exhibit 3: Offtake (MT)
500
462
8.0
500
465
472
8.0
452
431
431
436
433
450
7.3
450
416
425
7.4
6.8
7.0
7.0
400
400
355
342
6.0
6.0
350
350
5.0
5.0
300
300
3.8
4.0
250
4.0
250
3.6
3.8
3.0
200
200
3.0
2.3
2.0
150
150
2.1
2.0
2.0
1.0
1.0
100
100
0.0
1.4
1.0
50
0.0
50
0
0.0
0
-1.0
FY10
FY11
FY12
FY13
FY14
9M15
FY10
FY11
FY12
FY13
FY14
9M15
Production (MT)
Growth (%)
Offtake (MT)
Growth (%)
Source: Company
Source: Company
According to the coal ministry, with rising demand for power, demand for coal is
estimated to increase to 1.6 billion tonnes by the year FY2020. CIL has already
finalised plans to achieve targeted production of 925MT by FY2020 and is
planning to increase production to 1bn tonne. The target production implies a
12.2% CAGR growth in production over FY2014-20.
Exhibit 4: Coal India Production Target
1000
18.0
925
20.0
900
18.0
18.6
780
800
16.0
661
700
14.0
598
600
548
12.0
507
10.5
500
10.0
400
9.6
9.1
8.0
8.1
300
6.0
200
4.0
100
2.0
0
0.0
FY15E
FY16E
FY17E
FY18E
FY19E
FY20E
Production (MT)
Growth (%)
Source: Company
We believe the production growth target is a bit too optimistic. However, we
believe production growth will definitely inch up going forward, as compared to
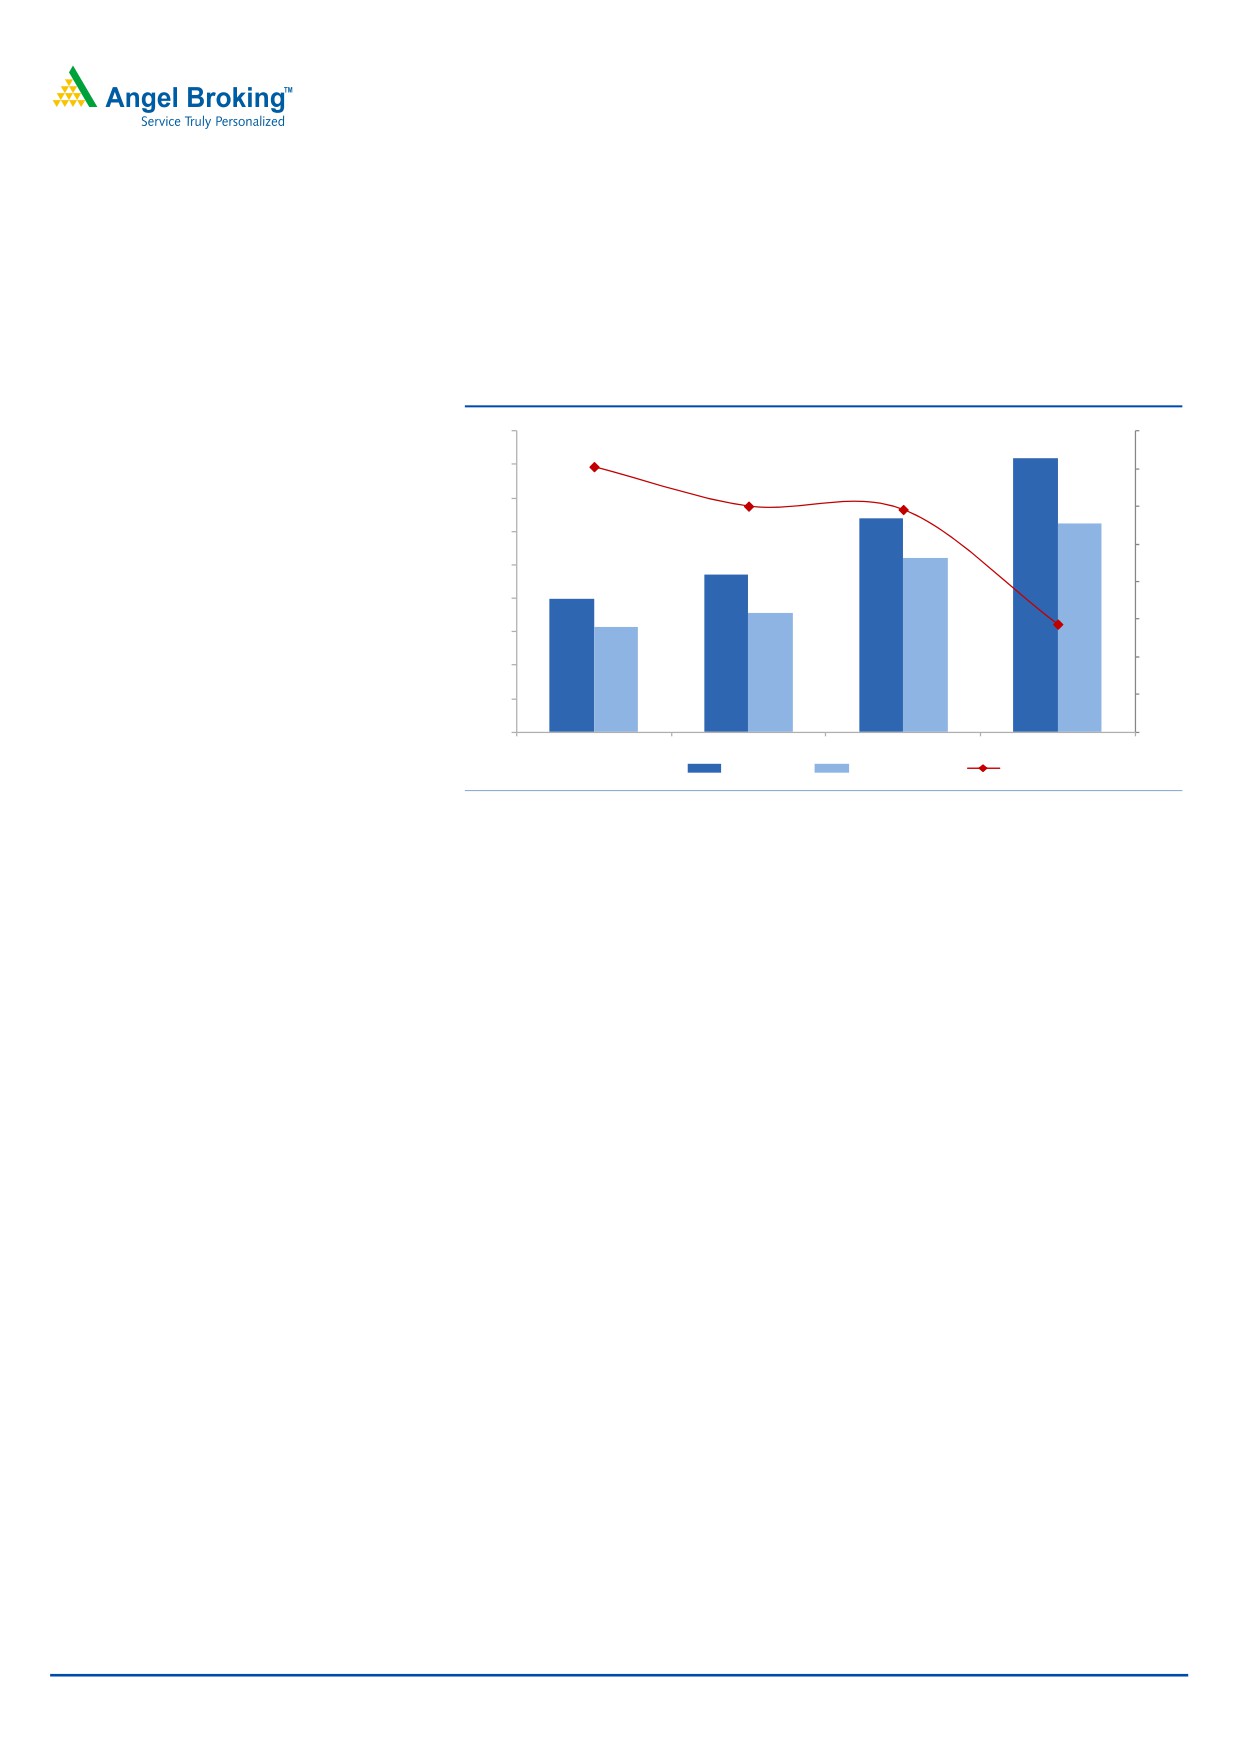
the muted growth over recent years. The company has consistently missed its
January 30, 2015
3
Coal India | OFS Note
production targets with a CAGR of just 2.8% over the FY2009-14 period, largely
due to its inability to start new projects or increase capacity at existing mines on
account of land acquisition issues. CIL’s new blocks, which are expected to
contribute ~115MT of the additional production, are stuck in land acquisition
hurdles with delays ranging from 2-7 years.
Exhibit 5: Production Vs Target
490
99%
482
480
98%
98%
98%
470
97%
98%
464
462
460
452
97%
447
450
440
97%
440
436
431
96%
96%
430
96%
420
410
95%
400
95%
FY11
FY12
FY13
FY14
Target (MT)
Production (MT)
Achieved (%)
Source: Company
The government is showing strong signs of acting swiftly on important reforms,
such as land acquisition. The coal ministry is also making all efforts to resolve
issues related to various mining projects. For the first time, the government will be
drawing mine-wise plans, to help CIL achieve its production targets. With such
strong support from the government, we expect CIL’s production to grow at a
CAGR of ~8% during FY2014-20 as against the target of 12.2%.
Operating efficiencies and low realisations to help improve margins
CIL’s net realisation was $24 per tonne in FY2014, significantly lower than the
landed price of imported coal. This gap provides enough cushion against any
decline in international coal prices. The gap also provides ample scope for CIL to
pass on any cost escalations and maintain margins.
The company also plans to add 16 coal washeries, which will increase its coal
washing capacity from 39.4MTY to 140MTY. Construction job of three washeries
are in progress and two washeries have been awarded. The increasing share of
washed coal will help drive realisations for the company.
CIL is one of the lowest cost producers of coal (~$19 per tonne), with 90% of
production through open cast mining. The company plans to improve productivity
in its mines through upgradation of technology, with installation of high capacity
equipments. In addition, the company plans to install continuous miner technology
on a large scale, long-wall technology at selected mines, man riding system in
major mines and tele-monitoring techniques in their underground mines. The
company also plans to pursue implementation of e-procurement to secure
equipment and spare part supplies; as well as use of e-tender systems to manage
works, services and other operations.
January 30, 2015
4
Coal India | OFS Note
The coal ministry is pushing to ensure timely completion of the three railways lines
(Jharkhand, Odisha & Chattisgarh), which have a potential to add another 200-
300MT of traffic capacity. CIL has already provided `300cr to Railways for these
projects, which have a total outlay of `7,500cr. These projects, aimed at increasing
the output from CIL mines in these states, are getting delayed mainly on account of
forest clearance and land acquisition issues.
The technological and infrastructural improvements, coupled with operating
efficiencies from rising production will help to keep production costs low.
Outlook and valuation
We expect CIL earnings to grow at a fast clip led by 1) Strong domestic demand
from power, steel and cement 2) Aggressive targets to drive production growth
with support from the new Government 3) Huge pricing gap between realisations
and landed cost of imported coal
4) Infrastructure and technological
enhancements, increase in coal washing capacities helping improve margins.
At the OFS price of `358, the stock is available at ~11.4x the consensus FY2017E
EPS of `31.4, which is attractive. Retail shareholders will get an additional discount
of 5%, implying an OFS price of `340. At the OFS price for retail bidders, the stock
is available at a P/E ratio of 10.8x consensus FY2017E EPS. We also believe, post
issue, the overhang of the share sale on the price will be gone. Hence, we
recommend investors to apply for CIL shares in the OFS.
January 30, 2015
5
Coal India | OFS Note
Profit & loss statement (Consolidated)
Y/E March (` cr)
FY11
FY12
FY13
FY14
Gross sales
60,241
78,410
88,281
89,375
Less: excise duty
10,012
15,995
19,979
20,564
Net sales
50,229
62,415
68,303
68,810
Other operating income
-
-
-
-
Total operating income
50,229
62,415
68,303
68,810
% chg
12.6
24.3
9.4
0.7
Total expenditure
36,752
46,748
50,219
52,847
Net raw materials
5,273
5,504
6,062
7,022
Power & Fuel
1,749
2,013
2,333
2,282
Personnel
18,932
26,387
27,321
27,769
Other
10,798
12,844
14,503
15,773
EBITDA
13,478
15,668
18,084
15,963
% chg
27.9
16.3
15.4
(11.7)
(% of net sales)
26.8
25.1
26.5
23.2
Depreciation
1,765
1,969
1,813
1,996
EBIT
11,712
13,699
16,271
13,967
% chg
27.2
17.0
18.8
(14.2)
(% of net sales)
23.3
21.9
23.8
20.3
Interest expenses
74
54
45
58
Other income
4,872
7,537
8,747
8,969
(% of PBT)
41.9
55.2
53.9
64.5
Recurring PBT
16,511
21,182
24,972
22,878
% chg
17.8
28.3
17.9
(8.4)
Extraordinary inc/(expense)
(47)
91
7
1
PBT (reported)
16,463
21,273
24,979
22,880
Tax
5,596
6,484
7,623
7,768
(% of PBT)
34.0
30.5
30.5
34.0
PAT (reported)
10,867
14,788
17,356
15,112
Add: Share of earnings of asso.
-
-
-
-
Less: Minority interest
-
-
-
0.04
Discontinued operations
(0.01)
(0.01)
(0.01)
(0.01)
PAT after MI (reported)
10,867
14,788
17,356
15,112
Adj. PAT after MI
10,915
14,697
17,350
15,110
% chg
12.8
34.7
18.0
(12.9)
(% of net sales)
19.3
17.5
21.5
25.2
Basic EPS (`)
17.19
23.47
27.63
23.92
FDEPS (`)
17.19
23.47
27.63
23.92
% chg
12.9
36.5
17.7
(13.4)
January 30, 2015
6
Coal India | OFS Note
Balance sheet (Consolidated)
Y/E March (` cr)
FY11
FY12
FY13
FY14
SOURCES OF FUNDS
Equity Share Capital
6,316
6,316
6,316
6,316
Reserves & Surplus
26,998
34,137
42,156
36,088
Shareholders Funds
33,314
40,453
48,472
42,404
Minority Interest
33
54
64
64
Total Loans
1,334
1,305
1,078
171
Other Long term liabilities
2,057
2,647
3,137
3,529
Long Term Provisions
22,461
28,271
31,144
33,639
Total Liabilities
59,199
72,730
83,895
79,807
APPLICATION OF FUNDS
Gross Block
36,714
38,096
39,011
40,897
Less: Acc. Depreciation
23,871
24,656
25,545
26,302
Net Block
12,843
13,440
13,466
14,595
Capital Work-in-Progress
2,057
2,903
3,496
4,505
Goodwill
-
-
-
-
Investments
851
947
1400
1188
Deferred Tax Assets
873
1194
2255
1972
Long Term loans and adv.
845
1,017
1,181
1,164
Other non- current assets
76
69
74
593
Current Assets
68,318
87,415
88,423
80,227
Cash
45,806
58,203
62,236
52,390
Loans & Advances
11,180
13,478
4,920
6,596
Other
11,332
15,734
21,267
21,241
Current liabilities
26,666
34,256
26,401
24,435
Net Current Assets
41,652
53,159
62,022
55,792
Mis. Exp. not written off
-
-
-
-
Total Assets
59,199
72,730
83,895
79,807
January 30, 2015
7
Coal India | OFS Note
Cash flow statement (Consolidated)
Y/E March (` cr)
FY11
FY12
FY13
FY14
Profit before tax
16,463
21,273
24,979
22,880
Depreciation
1,765
1,969
1,839
1,996
Change in Working Capital
(4,328)
3,565
(6,839)
244
Less: Other income
427
(214)
(2,218)
(1,769)
Direct taxes paid
(5,623)
(6,704)
(8,652)
(8,826)
Cash Flow from Operations
8,704
19,888
9,109
14,525
(Inc.)/ Dec. in Fixed Assets
(2,568)
(3,409)
(2,454)
(4,116)
(Inc.)/ Dec. in Investments
218
(11,219)
(5,022)
6,221
(Inc.)/ Dec. in loans and adv.
0
0
0
0
Other income
3,390
4,218
5,643
6,475
Cash Flow from Investing
1,040
(10,410)
(1,833)
8,580
Issue of Equity
0
0
0
0
Inc./(Dec.) in loans
(577)
(301)
(274)
(1,321)
Dividend Paid (Incl. Tax)
(2,583)
(7,429)
(7,907)
(24,243)
Others
144
348
329
214
Cash Flow from Financing
(3,017)
(7,382)
(7,852)
(25,350)
Inc./(Dec.) in Cash
6,728
2,095
(575)
(2,246)
Opening Cash balances
39,078
10,165
12,260
11,685
Closing Cash balances
45,806
12,260
11,685
9,439
January 30, 2015
8
Coal India | OFS Note
Key Ratios (Consolidated)
Y/E March
FY11
FY12
FY13
FY14
Valuation Ratio (x)
P/E (on FDEPS)
22.0
16.1
13.7
15.8
P/CEPS
18.8
14.3
12.5
14.0
P/BV
7.2
5.9
4.9
5.6
Dividend yield (%)
1.0
2.6
3.7
7.7
EV/Sales
4.0
3.1
2.7
2.6
EV/EBITDA
15.0
12.4
10.1
11.1
EV / Total Assets
3.4
2.7
2.2
2.2
Per Share Data (`)
EPS (Basic)
17.2
23.5
27.6
23.9
EPS (fully diluted)
17.2
23.5
27.6
23.9
Cash EPS
20.1
26.4
30.3
27.1
DPS
3.9
10
14
29
Book Value
52.7
64.0
76.7
67.1
Dupont Analysis
EBIT margin
23.3
21.9
23.8
20.3
Tax retention ratio (%)
66.0
69.5
69.5
66.0
Asset turnover (x)
0.8
0.9
0.8
0.9
ROIC (Post-tax)
13.1
13.1
13.5
11.6
Cost of Debt (Post Tax)
2.9
2.8
2.6
6.1
Leverage (x)
1.8
1.8
1.7
1.9
Operating RoE
31.1
31.6
32.2
21.8
Returns (%)
RoCE (Pre-tax)
37.5
35.8
35.6
30.3
RoE
36.8
40.1
39.0
33.3
Turnover ratios (x)
Asset Turnover (Gross Block)
1.4
1.7
1.8
1.7
Inventory / Sales (days)
49.6
45.5
42.5
38.6
Receivables (days)
20.3
26.6
43.1
49.7
Payables (days)
6.4
5.8
6.1
5.7
Solvency ratios (x)
Net debt to equity
(1.4)
(1.3)
(1.4)
(1.3)
Net debt to EBITDA
(2.8)
(2.8)
(3.1)
(3.8)
January 30, 2015
9
Coal India | OFS Note
Research Team Tel: 022 - 39357800
DISCLAIMER
This document is solely for the personal information of the recipient, and must not be singularly used as the basis of any investment
decision. Nothing in this document should be construed as investment or financial advice. Each recipient of this document should
make such investigations as they deem necessary to arrive at an independent evaluation of an investment in the securities of the
companies referred to in this document (including the merits and risks involved), and should consult their own advisors to determine
the merits and risks of such an investment.
Angel Broking Pvt. Limited, its affiliates, directors, its proprietary trading and investment businesses may, from time to time, make
investment decisions that are inconsistent with or contradictory to the recommendations expressed herein. The views contained in this
document are those of the analyst, and the company may or may not subscribe to all the views expressed within.
Reports based on technical and derivative analysis center on studying charts of a stock's price movement, outstanding positions and
trading volume, as opposed to focusing on a company's fundamentals and, as such, may not match with a report on a company's
fundamentals.
The information in this document has been printed on the basis of publicly available information, internal data and other reliable
sources believed to be true, but we do not represent that it is accurate or complete and it should not be relied on as such, as this
document is for general guidance only. Angel Broking Pvt. Limited or any of its affiliates/ group companies shall not be in any way
responsible for any loss or damage that may arise to any person from any inadvertent error in the information contained in this report.
Angel Broking Pvt. Limited has not independently verified all the information contained within this document. Accordingly, we cannot
testify, nor make any representation or warranty, express or implied, to the accuracy, contents or data contained within this document.
While Angel Broking Pvt. Limited endeavours to update on a reasonable basis the information discussed in this material, there may be
regulatory, compliance, or other reasons that prevent us from doing so.
This document is being supplied to you solely for your information, and its contents, information or data may not be reproduced,
redistributed or passed on, directly or indirectly.
Angel Broking Pvt. Limited and its affiliates may seek to provide or have engaged in providing corporate finance, investment banking
or other advisory services in a merger or specific transaction to the companies referred to in this report, as on the date of this report or
in the past.
Neither Angel Broking Pvt. Limited, nor its directors, employees or affiliates shall be liable for any loss or damage that may arise from
or in connection with the use of this information.
Note: Please refer to the important `Stock Holding Disclosure' report on the Angel website (Research Section). Also, please refer to the
latest update on respective stocks for the disclosure status in respect of those stocks. Angel Broking Pvt. Limited and its affiliates may
have investment positions in the stocks recommended in this report.
Disclosure of Interest Statement
Coal India
1. Analyst ownership of the stock
No
2. Angel and its Group companies ownership of the stock
No
3. Angel and its Group companies' Directors ownership of the stock
No
4. Broking relationship with company covered
No
Note: We have not considered any Exposure below ` 1 lakh for Angel, its Group companies and Directors
Ratings (Returns):
Buy (> 15%)
Accumulate (5% to 15%)
Neutral (-5 to 5%)
Reduce (-5% to -15%)
Sell (< -15%)
January 30, 2015
10
Coal India | OFS Note
6th Floor, Ackruti Star, Central Road, MIDC, Andheri (E), Mumbai- 400 093. Tel: (022) 39357800
Research Team
Fundamental:
Sarabjit Kour Nangra
VP-Research, Pharmaceutical
Vaibhav Agrawal
VP-Research (Banking)
Amarjeet Maurya
Analyst (FMCG, Media, Mid-Cap)
Bharat Gianani
Analyst (Automobile)
Rahul Dholam
Analyst (Metal, Oil & Gas)
Santosh Yellapu
Analyst (Infrastructure)
Shrenik Gujrathi
Analyst (Cap Goods, Cement)
Umesh Matkar
Analyst (Banking)
Twinkle Gosar
Analyst (Mid-Cap)
Tejas Vahalia
Research Editor
Technicals and Derivatives:
Siddarth Bhamre
Head - Technical & Derivatives
Sameet Chavan
Technical Analyst
Sneha Seth
Associate (Derivatives)
Institutional Sales Team:
Mayuresh Joshi
VP - Institutional Sales
Meenakshi Chavan
Dealer
Gaurang Tisani
Assistant Manager
Production Team:
Dilip Patel
Production Incharge
CSO & Registered Office: G-1, Ackruti Trade Centre, Road No. 7, MIDC, Andheri (E), Mumbai - 93. Tel: (022) 3083 7700. Angel Broking Pvt. Ltd: BSE Cash: INB010996539 / BSE F&O: INF010996539, CDSL Regn. No.: IN - DP - CDSL - 234 - 2004, PMS Regn. Code: PM/INP000001546, NSE Cash: INB231279838 /
NSE F&O: INF231279838 / NSE Currency: INE231279838, MCX Stock Exchange Ltd: INE261279838 / Member ID: 10500. Angel Commodities Broking (P) Ltd.: MCX Member ID: 12685 / FMC Regn. No.: MCX / TCM / CORP / 0037 NCDEX: Member ID 00220 / FMC Regn. No.: NCDEX / TCM / CORP / 0302.
January 30, 2015
11