
Please refer to important disclosures at the end of this report
1
Institutionally managed Real Estate Vehicle
The Brookfield REIT is India’s only institutionally managed public
commercial real estate vehicle. Sponsored by an affiliate of Brookfield Asset
Management (“BAM”), one of the world’s largest alternative asset managers
with approximately US$575 billion in assets under management, as of
September 30, 2020, their goal is to be the leading owner of high quality
income producing commercial real estate assets in key gateway Indian
markets, which have significant barriers to entry.
Positives: (1) 75% of Gross Contracted Rentals contracted with multi-national
corporations such as Accenture, Barclays, RBS, TCS and Cognizant. (2) REIT
has mark-to-market headroom of 36% to achieve further organic growth through
contractual lease escalations. (3) Exposure only to commercial office space which
is the least impacted segment in real estate due to Covid-19 outbreak.
Investment concerns: (1) Increase in Work from home (WFH) can lead to higher
vacancy in key market geographies and can create slowdown in demand for
commercial space in near term. (2) Highly concentrated on Gurugram market,
42% of overall rent comes from Candor Techspace G2, Gurugram. (3) REIT will
take long time to increase it revenue as REIT has under development property of
0.1 msf only along with this 92% of committed property has already been leased
out.
Outlook & Valuation: Though the REIT has incurred losses in FY20 and has not
paid out any dividends, they expect to pay a yield of 7.5% in FY23 which we
believe is aggressive and may be difficult to acheive. Post the IPO there will also
be a debt reduction of ~ ₹3,575 crore for the company which will bring down the
overall debt. However due to the current uncertainties around Covid-19 and
proliferation of work from home we expect that demand for commercial real estate
to be muted. Given the uncertainties, weak financials and high debt on book we
would recommend a “Neutral” rating on the issue.
Key Financials
Y/E March (` cr)
FY18
FY19
FY20
H1FY21
Total Revenue from Operation
866.2
929.8
981.3
467.4
% chg
7.3
5.5
EBIDTA
259.6
150.0
-95.7
-13.1
EBITDA (%)
30%
16%
-10%
-3%
Profit before tax
173.6
54.3
41.6
-73.7
PBT (%)
20%
6%
4%
-16%
Net Profit
161.1
-15.5
15.3
-73.9
Source: Company, Angel Research.
Note: Valuation ratios at upper price band.
Neutral
Issue Open: February 03, 2021
Issue Close: February 05, 2021
Institutional 75% of issue
Others 25% of issue
Promoters 54.4%
Others
45.6%
Fresh issue: Rs 3800 cr
Issue Details
Present units in Cr: 16.46
Offer for Sale: Not there
Post Issue Shareholding Pattern
Post units in Cr: 30.28
Issue size (amount): Rs 3800 cr
Price Band: Rs 274-275
Lot Size: 200 shares and in multiple
Post-issue implied mkt. cap: Rs 8,327cr
Promoters holding Pre-Issue: 100%
Promoters holding Post-Issue: 54.4%
*Calculated on lower price band
** Calculated on upper price band
Book Building
Brookfield India Real Estate Trust
f
REIT Note | Real Estate
February 02, 2021
Brookfield India Real Estate Trust | REIT Note
February 02, 2021
2
About REITs
Real Estate Investment Trusts (REITs) are companies that own or finance
income-producing real estate in a range of property sectors. REITs provide all
investors the chance to own valuable real estate, present the opportunity to
access dividend-based income (Rental) and total returns (Capital Appreciation).
The stockholders of a REIT earn a share of the income produced through real
estate investment – without actually having to go out and buy, manage or finance
property. REITs must pay out at least 90% of their net distributable cash flows.
REITs must own more than 80% of the value of its assets in completed and rent
generating properties.
Business Overview
Over the last two decades, India has emerged as a leading hub for technology
and corporate services due to a highly skilled and young workforce and a distinct
competitive cost advantage. With approximately 90 million people expected to be
added to the workforce by 2030, this structural driver will further increase office
absorption, creating compelling opportunities across the commercial real estate
market in India. The COVID-19 pandemic has accelerated the structural shift that
was already underway prior to the crisis in relation to the usage and deployment

Brookfield India Real Estate Trust | REIT Note
February 02, 2021
3
of technology especially cloud, data analytics, e-commerce and digital
transformation.
The global spending on software and IT services is expected to grow at a robust
rate between FY 2020 and FY 2025 and the technology industry in India is
expected to grow at a CAGR of 13% to US$350 billion by FY 2025 from an
estimated US$191 billion in FY 2020 due to the large STEM talent pool,
competitive cost advantage and favorable demographics in the country. (Source:
Industry Report). Company’s strategy is to address this demand by owning and
operating large “fully-integrated”, “campus-format” office parks in established
locations, and providing a complete ecosystem to their tenants and their
employees.
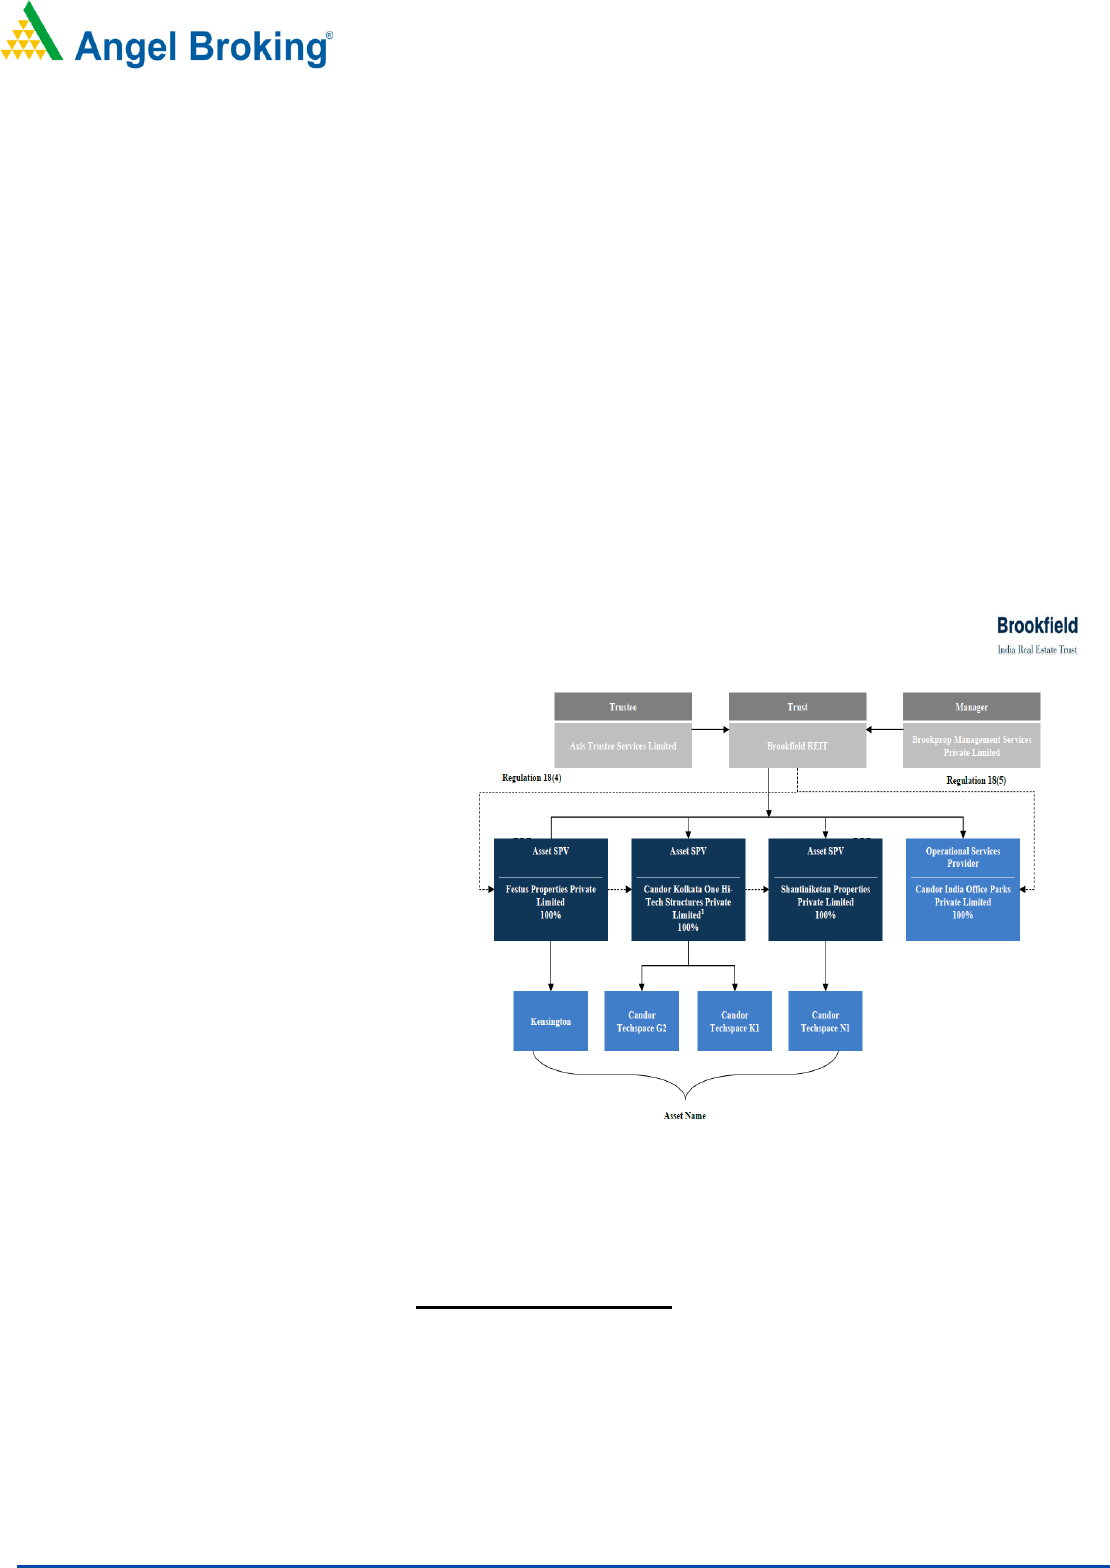
REIT owns an Initial Portfolio of 4 large campus-format office parks, which are
business parks located in Mumbai, Gurugram, Noida and Kolkata. Their Initial
Portfolio totals 14.0 msf, comprising 10.3 msf of Completed Area, 0.1 msf of
Under Construction Area and 3.7 msf of Future Development Potential.

Brookfield India Real Estate Trust | REIT Note
February 02, 2021
4
Issue details
Company issues comprises `3800 cr through fresh issue in the price band of
`274-275.
Objectives of the Offer
Repayment/prepayment of the borrowings of the Asset SPVs
General Corporate Purposes
Pre and post IPO shareholding pattern
No of shares
(Pre-issue)
%
(Post-issue)
%
Promoter
164,618,200
100
164,618,200
54.4
Other
0
0%
138,181,818
45.6
Total
164,618,200
100
302,800,018
100
Source: Company, Angel Research & RHP.
Note: Calculated at upper price band.
Key Management Personnel
Akila Krishnakumar is an independent director of Manager. She holds a
master’s degree in management studies from the Birla Institute of Technology &
Science at Pilani, Rajasthan. She was previously the president - global
technology and country head – India for SunGard Solutions (India) Private
Limited. She is an experienced professional with a long industry standing,
including over 18 years of experience in the field of technology.
Shailesh Vishnubhai Haribhakti is an independent director of Manager. He is a
fellow of the Institute of Chartered Accountants of India, a certified internal auditor
with the Institute of Internal Auditors Inc., an associate of the Institute of Cost and
Work Accountants of India. He is an experienced professional in the field of
finance and accounting.

Brookfield India Real Estate Trust | REIT Note
February 02, 2021
5
Consolidated Profit & Loss Statement
Y/E March (` cr)
FY18
FY19
FY20
H1FY21
Total Revenue from Operation
866.2
929.8
981.3
467.4
% chg
7.3
5.5
Total Expenditure
606.6
779.8
1,077.0
480.5
Cost of material consumed
5.2
4.9
5.2
0.5
Finance costs
328.7
440.3
714.1
348.4
Other Expenses
245.2
320.5
332.7
116.4
Employee Benefit Expense
27.5
14.1
25.0
15.2
EBITDA
259.6
150.0
(95.7)
(13.1)
(% of Total Revenue)
30.0
16.1
(9.8)
(2.8)
Depreciation& Amortisation
90.3
95.7
112.2
60.6
EBIT
169.3
54.3
(207.9)
(73.7)
(% of Total Revenue)
19.5
5.8
(21.2)
(15.8)
Profit/(Loss) before exceptional items and tax
169.3
54.3
(207.9)
(73.7)
Exceptional Items
4.3
0
249.5
0.00
Profit before tax
173.58
54.26
41.58
(74)
Tax
12.5
69.8
26.3
1.2
PAT (reported)
161.1
(15.5)
15.3
(73.9)
(% of Total Revenue)
18.6
(1.7)
1.6
(15.8)
Source: Company, Angel Research
Consolidated Balance Sheet
Y/E March (` cr)
FY18
FY19
FY20
H1FY21
SOURCES OF FUNDS
Capital
15
55
65
65
Other equity
(2,634)
(2552)
(2,285)
(2,544)
Total Equity
(2,619)
(2497)
(2,220)
(2,479)
Total Loans
3,439
6306
6,810
7,000
Total Non Current Liabilities
58
103
86
91
Total Liabilities
878
3912
4,676
4,612
APPLICATION OF FUNDS
Net Block
9
9
11
12
Investment property
3,682
4203
4,455
4,433
Investment property under construction
436
194
52
60
Capital Work-in-Progress
98
251
254
222
Current Assets
538
234
427
215
Inventories
-
0
-
-
Investments
306
0
-
-
Sundry Debtors
32
56
45
29
Cash &Bank Balance
125
136
327
104
Other Assets
76
41
56
82
Current liabilities
4,015
1131
701
524
Net Current Assets
(3,477)
(898)
(274)
(309 )
Other Non Current Asset
130
152
180
194
Total Assets
878
3912
4,676
4,612
Source: Company, Angel Research

Brookfield India Real Estate Trust | REIT Note
February 02, 2021
6
Consolidated Cash Flow Statement
Y/E March (` cr)
FY18
FY19
FY20
H1FY21
Profit before tax
173.5
54.1
41.4
(73.8)
Depreciation
90.3
95.7
112.2
60.6
Change in Working Capital
(52.1)
(4.2)
19.9
18.3
Interest Expense
328.7
440.3
714.1
348.4
Direct Tax Paid
(67.9)
(62.2)
(75.7)
(15.8)
Others
(60.7)
(18.5)
(281.8)
(19.0)
Cash Flow from Operations
414.9
507.6
532.3
316.9
(Inc.)/ Dec. in Fixed Assets
(106.6)
(320.4)
(170.7)
(43.2)
Investment in equity instruments
-
(2,040.0)
-
-
Others
44.4
306.8
268.7
24.6
Cash Flow from Investing
(62.2)
(2,053.6)
98.0
(18.6)
Interest paid
(349.0)
(437.6)
(622.3)
(398.2)
Borrowings
(269.1)
216.6
(660.0)
(2,234.7)
Proceeds / (Repayment) Long Term
480.4
1,791.6
462.2
2,308.0
Dividend paid on equity shares
(310.1)
-
-
(185.1)
Issue of Equity shares & Debentures
-
-
385.0
-
Other
(1.4)
(1.1)
(1.1)
-
Cash Flow from Financing
(449.2)
1,569.5
(436.2)
(510.0)
Inc./(Dec.) in Cash
(96.6)
23.5
194.1
(211.7)
Opening Cash balances
205.8
109.0
132.5
326.4
Closing Cash balances
109.0
132.5
326.4
101.0
Source: Company, Angel Research
Key Ratios
Y/E March
FY18
FY19
FY20
Valuation Ratio (x)
P/E
28.1
-
296.2
P/CEPS
21.6
43.5
37.1
P/BV
-
-
-
EV/Sales
9.1
11.5
11.2
EV/EBITDA
30.2
71.3
-
Per Share Data (Rs)
EPS
9.8
(0.9)
0.9
Cash EPS
12.7
6.3
7.4
Book Value
(159.1)
(151.7)
(134.9)
DPS
18.84
-
-
Returns (%)
Angel ROIC (Pre tax)
-
1.6%
-5.6%
ROE
-
0.6%
-0.7%
ROCE
20.6%
1.4%
-4.5%
Source: Company, Angel Research (Valuation at the upper price band)

Brookfield India Real Estate Trust | REIT Note
February 02, 2021
7
Research Team Tel: 022 - 39357800 E-mail: [email protected] Website: www.angelbroking.com
DISCLAIMER
Angel Broking Limited (hereinafter referred to as “Angel”) is a registered Member of National Stock Exchange of India Limited,
Bombay Stock Exchange Limited and Metropolitan Stock Exchange Limited. It is also registered as a Depository Participant with
CDSL and Portfolio Manager and investment advisor with SEBI. It also has registration with AMFI as a Mutual Fund Distributor.
Angel Broking Limited is a registered entity with SEBI for Research Analyst in terms of SEBI (Research Analyst) Regulations, 2014
vide registration number INH000000164. Angel or its associates has not been debarred/ suspended by SEBI or any other regulatory
authority for accessing /dealing in securities Market. Angel or its associates/analyst has not received any compensation / managed
or co-managed public offering of securities of the company covered by Analyst during the past twelve months.
This document is solely for the personal information of the recipient, and must not be singularly used as the basis of any investment
decision. Nothing in this document should be construed as investment or financial advice. Each recipient of this document should
make such investigations as they deem necessary to arrive at an independent evaluation of an investment in the securities of the
companies referred to in this document (including the merits and risks involved), and should consult their own advisors to determine
the merits and risks of such an investment.
Reports based on technical and derivative analysis center on studying charts of a stock's price movement, outstanding positions and
trading volume, as opposed to focusing on a company's fundamentals and, as such, may not match with a report on a company's
fundamentals. Investors are advised to refer the Fundamental and Technical Research Reports available on our website to evaluate
the contrary view, if any.
The information in this document has been printed on the basis of publicly available information, internal data and other reliable
sources believed to be true, but we do not represent that it is accurate or complete and it should not be relied on as such, as this
document is for general guidance only. Angel Broking Limited or any of its affiliates/ group companies shall not be in any way
responsible for any loss or damage that may arise to any person from any inadvertent error in the information contained in this
report. Angel Broking Limited has not independently verified all the information contained within this document. Accordingly, we
cannot testify, nor make any representation or warranty, express or implied, to the accuracy, contents or data contained within this
document. While Angel Broking Limited endeavors to update on a reasonable basis the information discussed in this material, there
may be regulatory, compliance, or other reasons that prevent us from doing so.
This document is being supplied to you solely for your information, and its contents, information or data may not be reproduced,
redistributed or passed on, directly or indirectly.
Neither Angel Broking Limited, nor its directors, employees or affiliates shall be liable for any loss or damage that may arise from or
in connection with the use of this information.
