IPO Note | Other Telecom Services
June 13, 2017
Tejas Networks Limited
SUBSCRIBE
sue Open: June 14, 2017
Is
Issue Close: June 16, 2017
Tejas Networks Ltd (TNL) is an optical and data networking products company. It
designs, develops and sells products to telecommunications & internet service
providers, utility companies, defense companies and government entities in India and
Issue Details
over 60 countries. TNL derives 63% of its revenues from domestic markets, while rest
comes from international markets. As of May 15, 2017, the company had 313
Face Value: `10
employees in its R&D team and had filled 333 patents applications across the globe,
out of which 56 patents have been granted.
Present Eq. Paid up Capital: `74cr
Rise in optical network capex expected: Less than 20% of cell towers in India are
Offer for Sale: **1.27cr Shares
connected with fibre, as compared to 70-80% in developed countries. In our view, the
optical network capex in India is likely to grow at 14% CAGR over FY2014-20.
Fresh issue: `450 cr
Further, evaluation of high speed internet technologies would require existing telcos to
upgrade network capacities for higher data traffic domestically as well as globally.
Post Eq. Paid up Capital: `91.52cr
Government’s push for ‘Digital India’ to further strengthen business: We believe that
government’s push for ‘Digital India’ through projects such as the National Optical
Fibre Network (BharatNet, where 250,000 gram panchayats would be connected
Issue size (amount): *`755cr -**776 cr
through optical fibres), and Smart Cities will provide better growth opportunities for
business. In addition, policies such as ‘Make in India’ and ‘Preferential Market Access
Price Band: `250-257
Policy’ would further benefit TNL’s business prospects.
Favorably placed to capture the industry growth: We believe that TNL would benefit
Lot Size: 55 shares and in multiple
from the industry growth owing to - (1) Leadership position in the fast growing Indian
thereafter
optical equipment market (2nd, 15% market share); (2) Strong professional team with
Post-issue implied mkt. cap: *`2239cr -
significant industry experience; (3) High product reliability, as it delivered <15 min
**`2301cr
down time a year since 2008; (4) Expanding exports into markets with similar
economic pattern as India i.e. South East Asia, Latin America, Africa, etc. (5) Less
Instituional Investor Pre-Issue: 100%
competition owing to high entry barriers related to huge initial investment in R&D; and
(6) An end-to-end portfolio of optical networking products for access, metro and long-
haul networks.
*Calculated on lower price band
Strong operating leverage with asset light business: Going forward, we expect TNL to
benefit from operating leverage, as the company has achieved necessary scale
** Calculated on upper price band
required in R&D. Further, company is adopting an asset light strategy by outsourcing
most of its manufacturing to reputed electronics manufacturing services companies.
Book Building
Therefore, Its ROE has improved from 8% in FY2016 to 12.9% for FY2017, and we
believe it will strengthen going ahead.
QIBs
75% of issue
Outlook and Valuation: TNL has reported strong revenue CAGR of 24.2% CAGR over
Non-Institutional
15% of issue
FY2013-17 and PAT of `64cr in FY2017 (loss of `79cr in FY2013). The RoE improved
from 8% in FY2016 to 12.9% in FY2017, primarily owing to ongoing capex on Optical
Retail
10% of issue
Network by Telcos, strong operating leverage with asset light business and strong
professional team with significant industry experience. At the upper end of the price
band, the pre-issue P/E works out to be 29.3x its 2017 earnings, 3.7x of FY2017 Book
Value. Moreover, the company’s debt free balance sheet post IPO coupled with the
Post Issue Shareholding Patter
government’s push for digital India would support the growth momentum. Thus, we
Instituitional Investor
66%
recommend a SUBSCRIBE on the issue.
Others
34%
Key Financials
Y/E March (` cr)
FY2014
FY2015
FY2016
FY2017
Net Sales
423
387
627
878
% chg
14.6
(8.6)
62.2
40.0
Net Profit
3
(18)
29
64
% chg
-
-
-
122.4
EBITDA (%)
22.4
17.7
18.0
19.8
EPS (Rs)
0.4
(2.5)
4.0
8.8
P/E (x)
667
(104)
64
29
P/BV (x)
5.7
5.6
5.1
3.7
RoE (%)
0.9
(5.4)
8.0
12.9
Jaikishan J Parmar
RoCE (%)
6.7
3.6
12.2
16.2
+022 39357600, Extn: 6810
EV/Sales (x)
4.9
5.2
3.2
2.3
EV/EBITDA (x)
22.0
29.5
18.0
11.5
Source: Company, Angel Research; Valuation ratios based on pre-issue outstanding shares and at upper end of the price band
Please refer to important disclosures at the end of this report
1
Tejas Networks Ltd| IPO Note
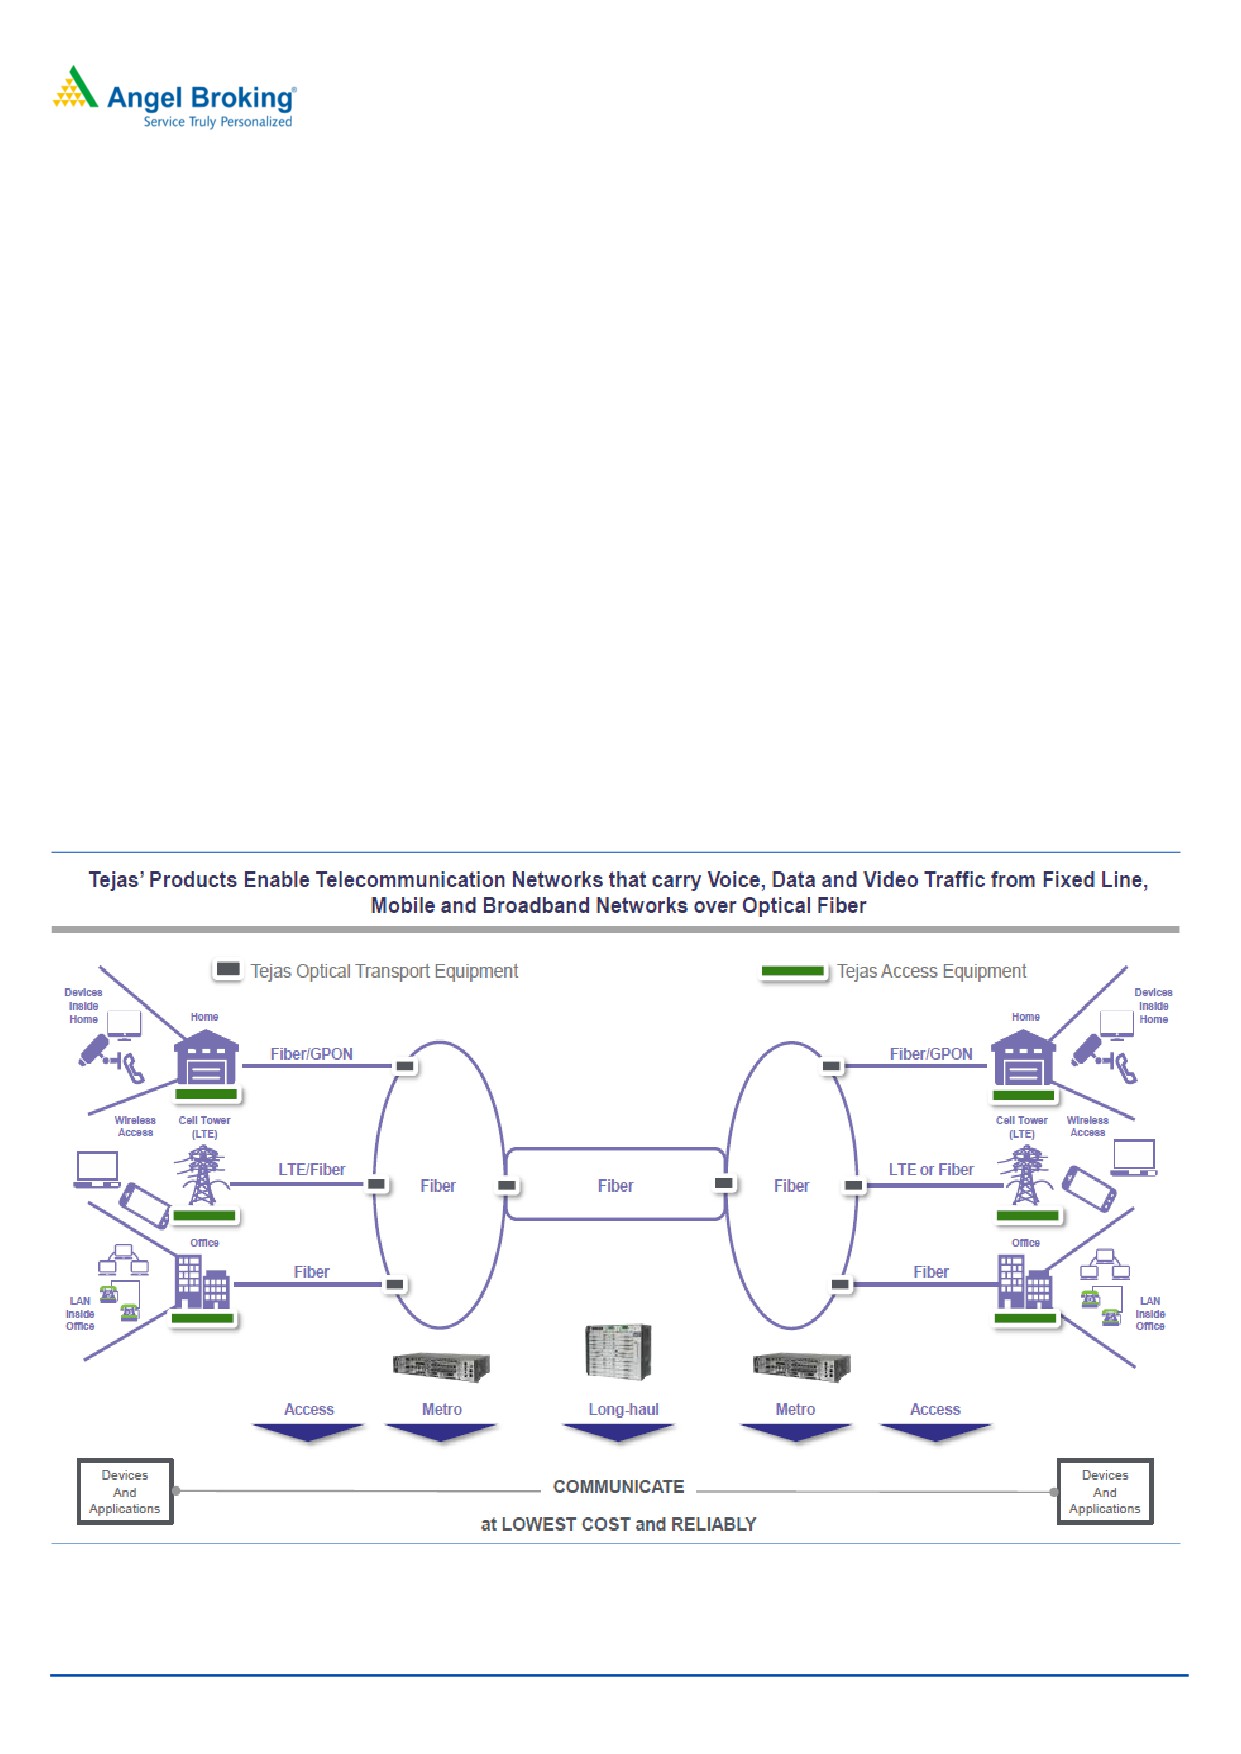
Company background
Tejas Network Ltd is an India based optical and data networking products
company with customers in over 60 countries. TNL designs, develops and sells
high performance and cost competitive products to telecommunication service
providers, internet service providers, utility companies, defence companies and
government entities (collectively, “Communication Service Providers”). The products
are used to build high-speed communication networks that carry voice, data and
video traffic from fixed line, mobile and broadband networks over optical fibre.
The products use programmable software-defined hardware architecture with a
common software code-base that delivers an app-like ease of development and
upgradation of new features and technology standards. Currently, India is the
largest geographic segment (in terms of revenue) and we believe TNL is well
positioned to take advantage of the growth opportunities arising out of ‘Digital
India’ and ‘Make-in-India’ programs of the Indian Government.
For the year ended March 31, 2016, TNL was the second largest optical
networking products company in terms of market share in India, with a market
share of 15% in the overall optical networking market. (Source: Ovum Market
Share Spreadsheet: 1Q16 ON Subregional EMEA and AP, published in June
2016).
Exhibit 1: Tejas Network products get used at
Source: Company, Angel Research,RHP
June 13, 2017
2
Tejas Networks Ltd| IPO Note
The current product portfolio targets access networks (i.e. the outer perimeter of a
telecommunications network, which connects to the end consumers), metro
networks (i.e. networks that aggregate and distribute traffic collected from access
networks within a large city or region) and long-haul networks (i.e. networks that
interconnect metro networks using high bandwidth transmission).
As of April 30, 2017, TNL had filed 333 patent applications, with 203 filings in
India, 89 filings in the United States and 6 filings in Europe, out of which 56
patents have been granted and the company has also filed 35 patent applications
under the Patent Co-operation Treaty.
Exhibit 2: Geographical Segmentation of revenue (%)
Exhibit 3: Customer Segment of revenue (%) FY17
23
37
44
14
63
19
India
America Other
India - PSU
India - PVT
International
Source: Company, Angel Research
Source: Company, Angel Research
June 13, 2017
3
Tejas Networks Ltd| IPO Note
Issue details
The company is raising `450cr through a fresh issue of equity shares in the price
band of `250-257. The fresh issue will constitute ~19.55% of the post-issue paid-
up equity share capital of the company, assuming the issue is subscribed at the
upper end of the price band. The company is offering 1.27cr shares that are being
sold by certain exiting investors and management.
Investors selling shares in the IPO include Cascade Capital Management
Mauritius, India Industrial Growth Fund (Frontline Strategy), Intel Capital and
Sandstone Capital.
Exhibit 4: Pre and Post-IPO shareholding pattern
No. of shares (Pre-issue)
(%)No. of shares (Post-issue)
(%)
Institutional Investors
7,20,38,130
100%
5,93,26,525 66.2%
Public/DII/FII
0
0%
3,02,21,333 33.8%
7,20,38,130
100%
8,95,47,858
100%
Source: RHP, Angel Research; Note: Calculated on upper price band
Objects of the offer
More than 65% of the proceeds will go towards working capital (`303cr), a part of
it will be spent on capital expenditure and towards payment of salaries and wages
of Research & Development team (`45cr). The remaining will be set aside for
general purposes (`102cr).
Key Management Personnel
Sanjay Nayak: Managing Director and Chief Executive Officer - Mr. Nayak has
been with TNL since the company’s inception. He has spent his career in the area
of Information Communication Technology and Electronics Manufacturing. He is
the co-chairman of the Telecom Equipment and Services Export Promotion
Council. Prior to joining TNL, he was the managing director of Synopsys (India)
Private Limited.
Balakrishnan V.: He is the Non-Executive, Independent Director and Chairman of
the Company. He has been a Director of TNL since November 9, 2009. Mr.
Balakrishna has served as the group’s Chief Financial Officer and member of the
board of directors of Infosys Limited.
Kumar N. Sivarajan: Chief Technology officer - Mr. Sivarajan has been associated
with TNL since year 2000. He holds a PHD from California Institute of Technology.
June 13, 2017
4
Tejas Networks Ltd| IPO Note
Investment Rationale
Rise in Optical Network capex expected
The Indian network operators have under invested in optical fiber transmission as
compared to their peers in China and the United States. This under investment is
due to the initial focus on voice offering services and challenges in getting laying
optical fiber in the crowded cities. Less than 20% of cell towers in India are
connected with fibre as compared to 70-80% in developed countries (according to
Delloite). In our view, Indian optical capex is likely to grow at 14% CAGR over
FY201420. Further, considering factors such as evaluation of high speed internet
technologies, proliferation of powerful networking devices & Smartphone’s, growth
in enterprise cloud services & data, and games & HD videos would require existing
telcos to upgrade network capacities for higher data traffic domestically as well as
globally.
Exhibit 5: Proportion of network sites around the world in 2015
70-80%
50-60%
45-55%
<20%
India
South Africa
SEA Benchmark
Developed Country
Source: Company, Angel Research, Delloite
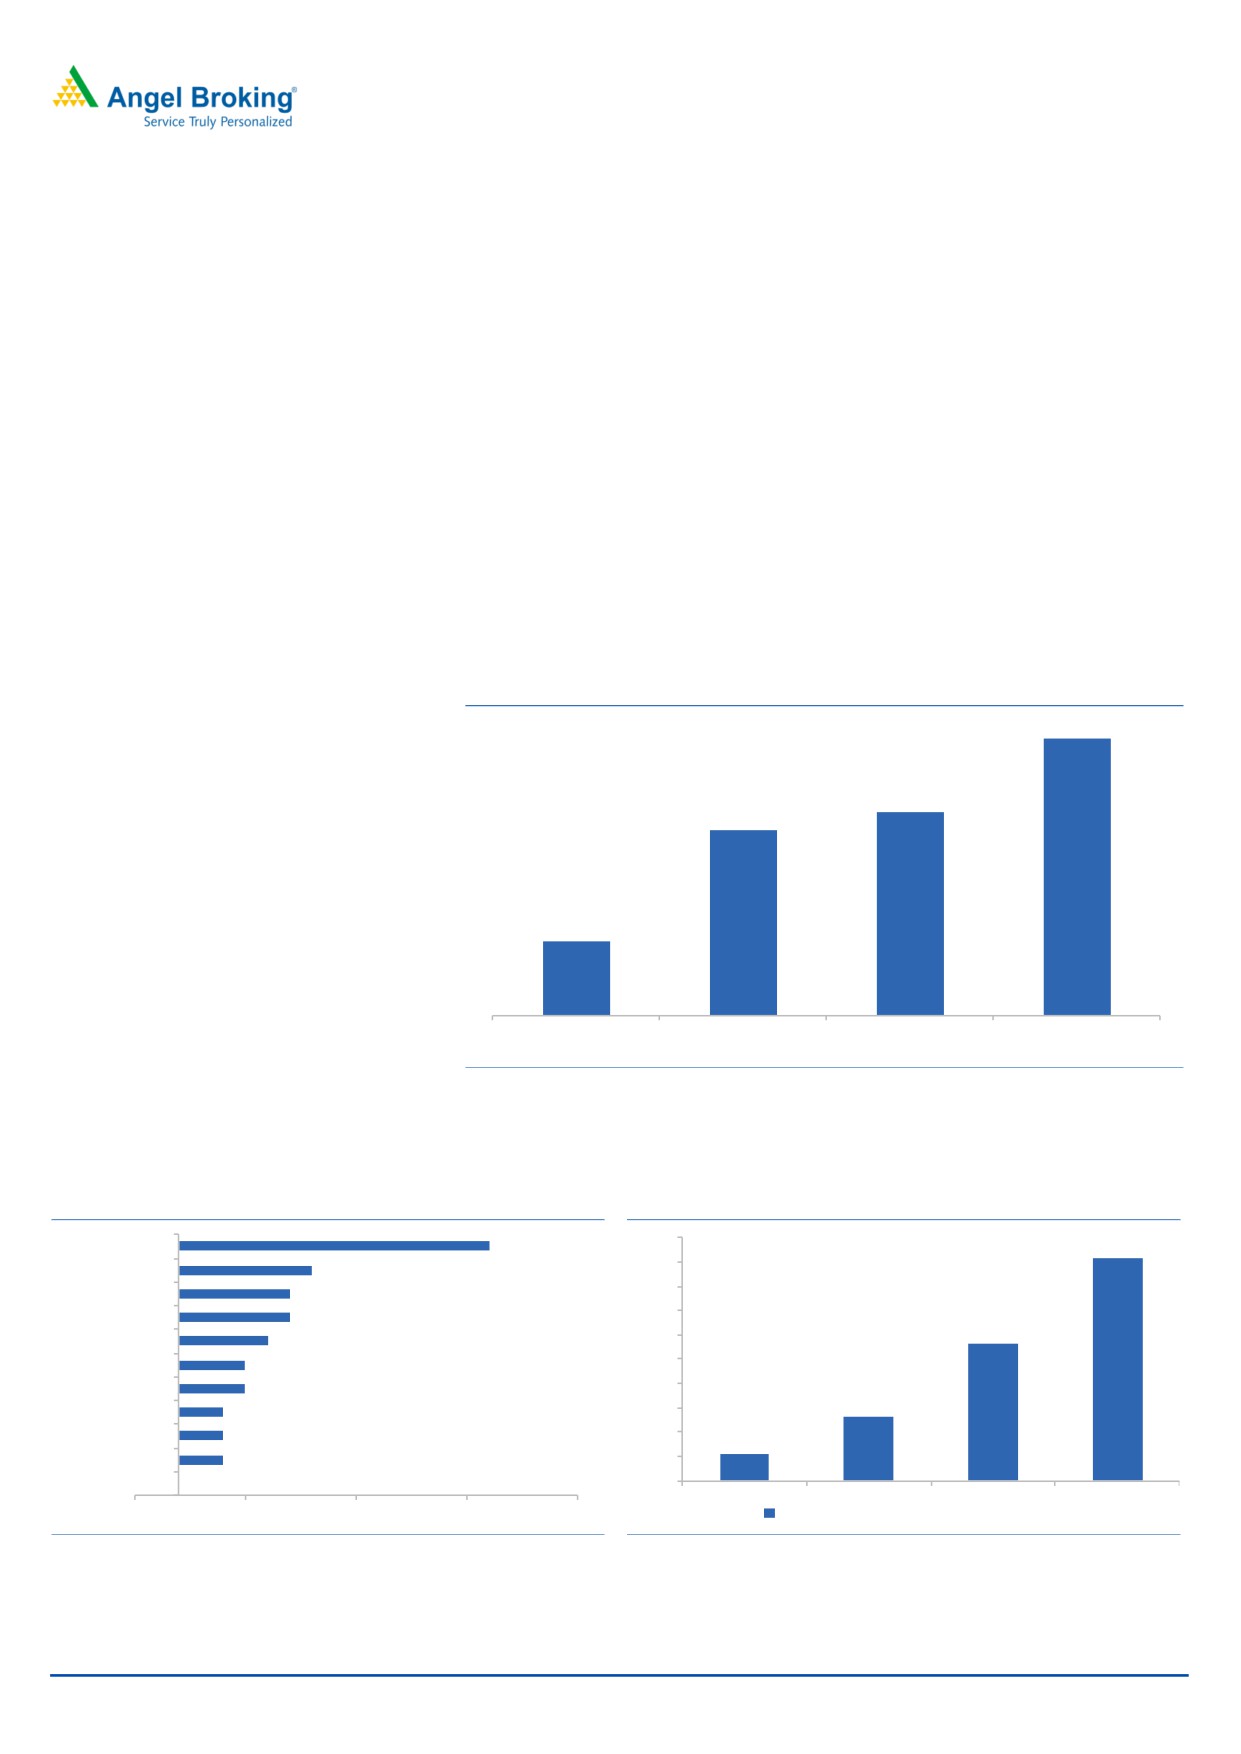
Exhibit 6: Growth in optical capex from FY2014-20
Exhibit 7: Increased use of Smartphones drives data
1000
918
India
14%
900
China
6%
800
LATM& Caribben
5%
700
Asia-Oceania
5%
566
600
Global
4%
500
North america
3%
400
MEA
3%
261
EMEA
2%
300
Big 5 EU
2%
200
107
RoAo
2%
100
Japan
0%
0
2014
2016
2018
2020
-2%
3%
8%
13%
18%
Mobile broadband subscription in india (mn Users)
Source: Company, Angel Research
Source: Company, Angel Research,Ovum
June 13, 2017
5
Tejas Networks Ltd| IPO Note
Government’s push for ‘Digital India’ to further strengthen business
We believe that government’s push for ‘Digital India’ through projects such as the
National Optical Fibre Network (BharatNet, where 250,000 gram panchayats
would be connected through optical fibres), and Smart Cities will provide better
growth opportunities for business. In addition, policies such as ‘Make in India’ and
‘Preferential Market Access Policy’ would further benefit TNL’s business prospects.
Exhibit 8: Government schemes supporting ‘Make in India’ & ‘Digital
India’
Make In India
Preferential Market Access (PMA): In government procurement for domestic products
Fiscal Incentives : Supports domestic manufacturing in the form of Capital Subsidy,
Tejas is approved under M-SIPS(2)
Anti-Dumping Duties: On imports of SDH transmission equipment from China & Israel
Merchandise exports from India scheme: For enhancing India’s export competitiveness
Karnataka (State) ESDM Policy: Providing research and development grant
Digital India
National Optical Fiber Network (BharatNet): Connecting 250,000 gram panchayats (villages)
using GPON (FTTX) technology
Smart Cities: Robust IT connectivity and digitalization for 100
Right-of-Way: New rules to ease right of way for faster optical fibre and mobile tower
infrastructure rollouts
Source: Company, Angel Research
Favorably placed to capture the industry growth: We believe that TNL would
benefit from the industry growth owing to - (1) Leadership position in the fast
growing Indian optical equipment market (2nd, 15% market share); (2) Strong
professional team with significant industry experience; (3) High product reliability,
as it delivered <15 min down time a year since 2008; (4) Expanding exports into
markets with similar economic pattern as India i.e. South East Asia, Latin America,
Africa, etc. (5) Less competition owing to high entry barriers related to huge initial
investment in R&D; and (6) An end-to-end portfolio of optical networking products
for access, metro and long-haul networks.
June 13, 2017
6
Tejas Networks Ltd| IPO Note
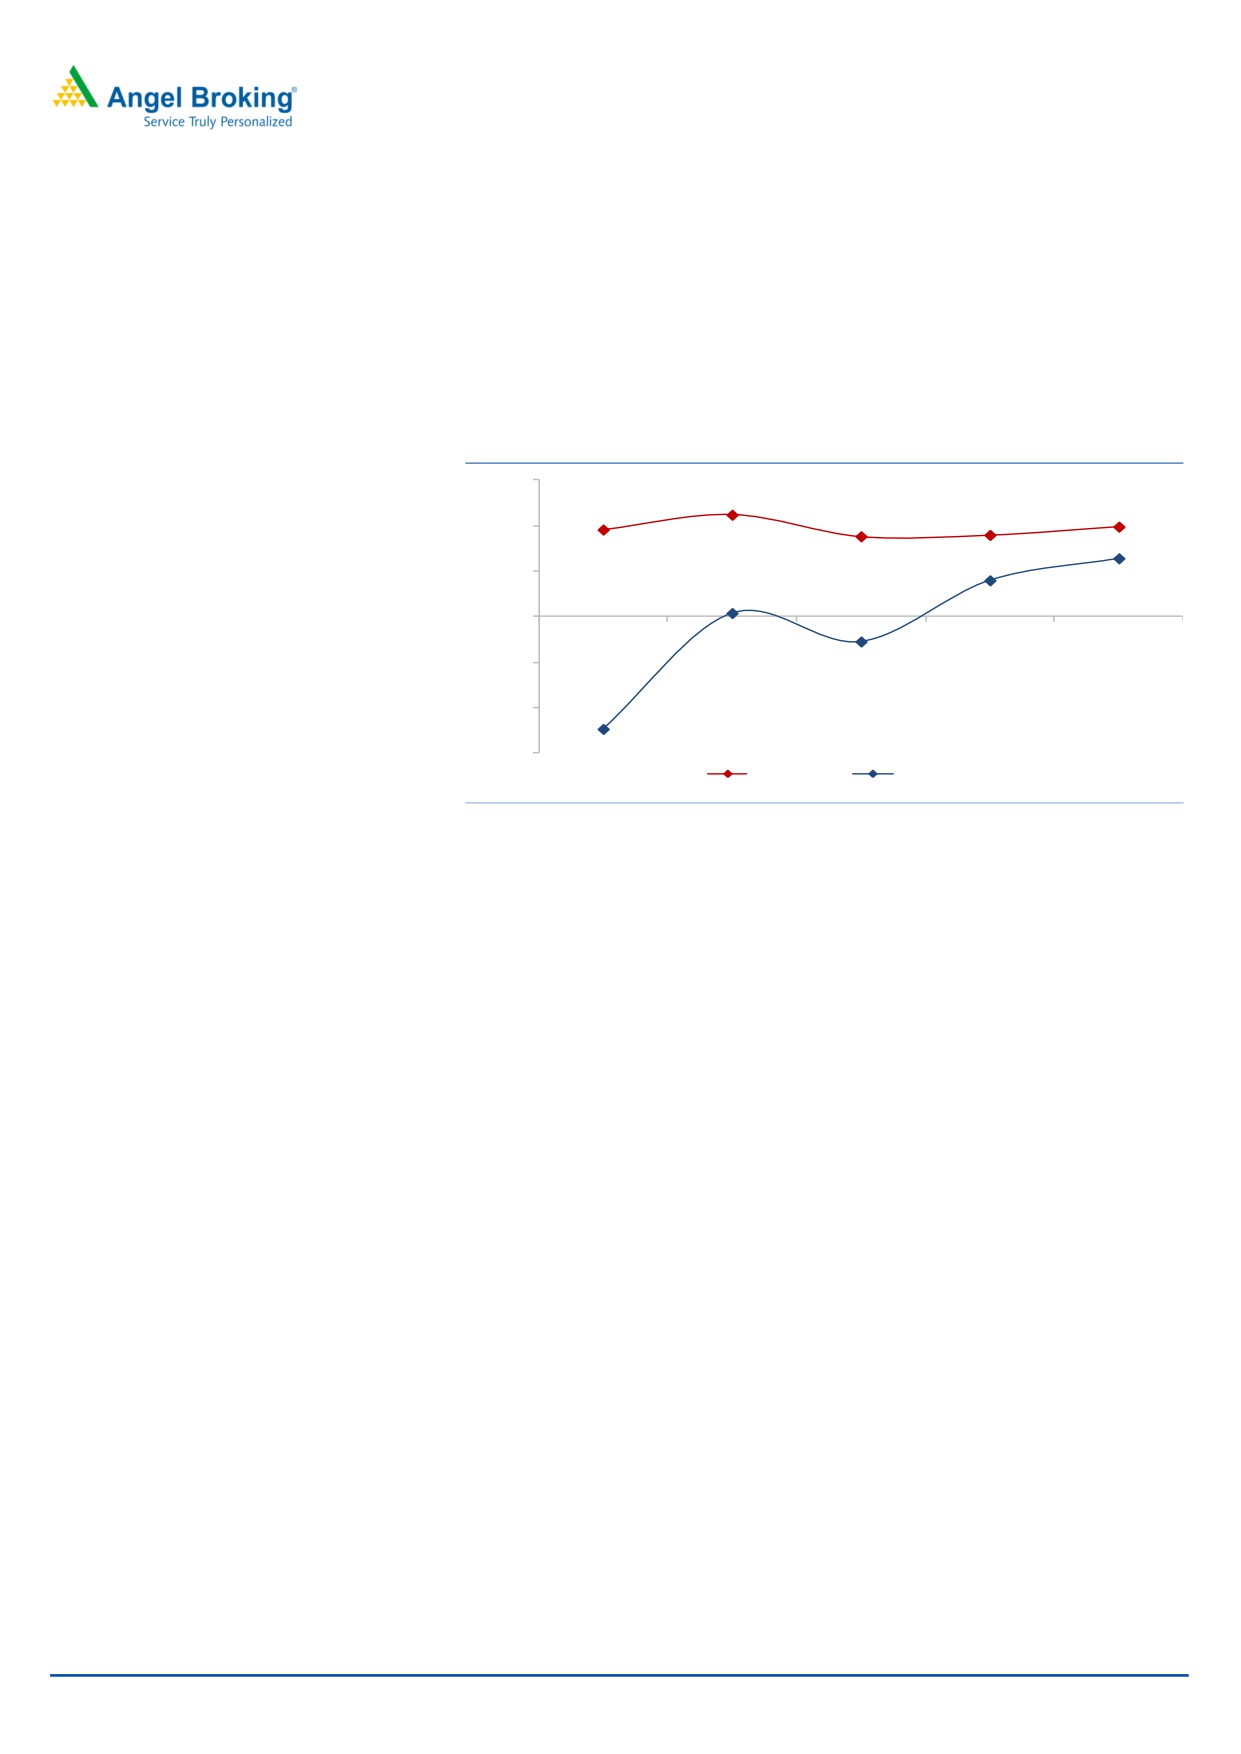
Strong operating leverage with asset light business: Going forward, we expect TNL
to benefit from operating leverage, as the company has achieved necessary scale
required in R&D. Further, company is adopting an asset light strategy by
outsourcing most of its manufacturing to reputed electronics manufacturing
services companies. Therefore, Its ROE has improved from 8% in FY2016 to 12.9%
for FY2017, and we believe it will strengthen going ahead.
Exhibit 9: Improving EBITDA margin & ROE
30.0
22.4
17.7
20.0
18.0
19.8
19.2
10.0
12.9
0.9
8.0
-
FY13
FY14
FY15
FY16
FY17
-10.0
-5.4
-20.0
-24.6
-30.0
EBITDA (%)
ROE (%)
Source: Company, Angel Research
Financial performance track record
TNL is consistently reporting improved numbers on the fronts of revenue, EBITDA
and return ratios. The revenues have grown from `369cr in FY2013 to `878cr in
FY2016, showing a 4 year CAGR of 24.2%. For FY2017, the company reported
PAT of `63cr (after considering onetime expenses of `30cr) from loss of `79cr in
FY2013.
EBITDA margins have improved from 12% in FY2013 to 19.8% in FY2017, largely
owing to better operating leverage. The company has made basic investments in
R&D and professional man power in order to achieve the necessary scale. Hence,
except cost of material, which is linked to revenue, majority of the operating costs
are almost fixed. Therefore, we believe that the company would continue to report
higher EBITDA margins and return ratios going ahead. From a loss making
company in FY2013 it has been able to report RoE of 12.9% in FY2017, which is
commendable.
June 13, 2017
7
Tejas Networks Ltd| IPO Note
Exhibit 10: Historical revenue Trend
Exhibit 11: Historical EBITDA trend
1000
878
200
25.0%
900
180
19.8%
800
160
22.4%
20.0%
18.0%
700
627
140
17.7%
600
120
15.0%
12.0%
500
100
423
369
387
80
10.0%
400
60
300
40
5.0%
200
20
44
95
69
113
174
100
-
0.0%
0
FY13
FY14
FY15
FY16
FY17
FY13
FY14
FY15
FY16
FY17
EBITDA
EBITDA Margin
Source: Company, Angel Research
Source: Company, Angel Research
Outlook and Valuation: TNL has reported strong revenue CAGR of 24.2% CAGR
over FY2013-17 and PAT of 64cr in FY2017 (loss of `79cr in FY2013). The RoE
improved from 8% in FY2016 to 12.9% in FY2017, primarily owing to ongoing
capex on Optical Network by Telcos, strong operating leverage with asset light
business and strong professional team with significant industry experience. At the
upper end of the price band, the pre-issue P/E works out to be 29.3x its 2017
earnings, 3.7x of FY2017 Book Value. Moreover, the company’s debt free balance
sheet post IPO coupled with the government’s push for digital India would support
the growth momentum. Thus, we recommend a SUBSCRIBE on the issue.
Key risks
Client concentration
In FY2017, the company has generated 58% of the revenue from 5 customers
however, any customer back out could severely impact revenue growth.
Outstanding legal & Tax proceedings
Total number of Tax proceedings against TNL is 40 and the amount involved is
`159cr. The amount involved in civil cases is `19cr. Unfavorable verdict could
disturb the financial condition of the company.
Fluctuations in currency exchange rates
As of Fiscal Years 2015, 2016 and 2017, US Dollar-denominated revenues
represented 57.66%, 30.23% and 33.65% of total revenues respectively. Hence,
any adverse or volatile movement in Currency could impact the financials of the
company.
June 13, 2017
8
Tejas Networks Ltd| IPO Note
Consolidated Income Statement
Y/E March (` cr)
FY2013
FY2014
FY2015
FY2016
FY2017
Total operating income
369
423
387
627
878
% chg
-
14.6
(8.6)
62.2
40.0
Total Expenditure
325
328
318
514
704
License fees
226
209
198
351
514
Personnel
45
45
50
67
76
Others Expenses
54
75
71
97
114
EBITDA
44
95
69
113
174
% chg
(145.9)
115.0
(27.8)
65.0
54.1
(% of Net Sales)
12.0
22.4
17.7
18.0
19.8
Depreciation& Amortisation
48
56
49
38
56
EBIT
(4)
39
20
74.8
118
% chg
-
-
(49.0)
274.8
57.5
(% of Net Sales)
(1.0)
9.2
5.2
11.9
13.4
Interest & other Charges
36
46
47
49
32
Other Income
9
10
9
4
9
(% of PBT)
(31.7)
347.1
(51.1)
12.1
13.5
Extraordinary Items
49
-
-
-
30
Share in profit of Associates
Recurring PBT
(30)
3
(18)
29
64
% chg
-
-
-
122.4
Tax
0
-
-
-
1.3
PAT (reported)
(30)
3
(18)
29
64
% chg
-
-
-
(% of Net Sales)
(8.2)
0.7
(4.6)
4.6
7.3
Basic & Fully Diluted EPS (Rs)
(11.0)
0.4
(2.5)
4.0
8.8
% chg
-
-
-
118.0
June 13, 2017
9
Tejas Networks Ltd| IPO Note
Consolidated Balance Sheet
Y/E March (` cr)
FY2013
FY2014
FY2015
FY2016
FY2017
SOURCES OF FUNDS
Equity Share Capital
101
101
126
67
74
Reserves& Surplus
220
223
206
294
427
Shareholders Funds
321
324
331
361
501
Total Loans
220
262
220
253
228
Total Liabilities
541
586
551
614
729
APPLICATION OF FUNDS
Net Block
77
65
51
94
92
Capital Work-in-Progress
71
84
88
52
19
Investments
-
-
0
0
0
Current Assets
459
509
532
605
659
Inventories
214
209
221
232
182
Sundry Debtors
138
223
208
254
358
Cash
58
23
50
69
71
Loans & Advances
43
38
32
34
42
Other Assets
5
16
22
15
7
Current liabilities
115
159
177
225
188
Net Current Assets
344
350
355
380
472
Other Non Current Asset
50
88
58
88
146
Total Assets
541
586
551
614
729
Note - Net block includes Intangible Asset
June 13, 2017
10
Tejas Networks Ltd| IPO Note
Consolidated Cash Flow Statement
Y/E March (` cr)
FY2013
FY2014
FY2015
FY2016
FY2017
Profit before tax
(79)
3
(18)
29
64
Depreciation
48
56
49
38
56
Change in Working Capital
2
(84)
(14)
1
(95)
Interest / Dividend (Net)
(4)
11
18
2
56
Direct taxes paid
0.2
(3)
(2)
(2)
(6)
Others
58
44
43
59
7
Cash Flow from Operations
25
27
76
127
83
(Inc.)/ Dec. in Fixed Assets
(23)
(56)
(39)
(46)
(51)
(Inc.)/ Dec. in Investments
23
(18)
10
(5)
(90)
Cash Flow from Investing
(0)
(74)
(29)
(50)
(141)
Issue of Equity
39
0
0
0
0
Inc./(Dec.) in loans
5
61
(16)
9
(5)
Others
(36)
(46)
(23)
(49)
46
Cash Flow from Financing
8
15
(40)
(41)
40
Inc./(Dec.) in Cash
34
(32)
8
36
(18)
Opening Cash balances
3
37
5
13
49
Closing Cash balances
37
5
13
13
31
Key Ratios
Y/E March
FY2013
FY2014
FY2015
FY2016
FY2017
Valuation Ratio (x)
P/E (on FDEPS)
(23.4)
666.7
(103.6)
63.8
29.3
P/CEPS
(74.2)
39.3
75.0
34.2
19.2
P/BV
5.8
5.7
5.6
5.1
3.7
EV/Sales
5.5
4.9
5.2
3.2
2.3
EV/EBITDA
45.6
22.0
29.5
18.0
11.5
EV / Total Assets
3.7
3.6
3.7
3.3
2.8
Per Share Data (Rs)
EPS (Basic)
(11.0)
0.4
(2.5)
4.0
8.8
(11.0)
0.4
(2.5)
4.0
8.8
EPS (fully diluted)
Cash EPS
(3.5)
6.5
3.4
7.5
13.4
Book Value
44.6
45.0
46.0
50.0
69.5
Returns (%)
ROCE
(0.7)
6.7
3.6
12.2
16.2
(0.8)
6.9
4.0
13.7
17.9
Angel ROIC (Pre-tax)
ROE
(24.6)
0.9
(5.4)
8.0
12.9
Turnover ratios (x)
Inventory / Sales (days)
212
180
208
135
76
Receivables (days)
136
193
196
148
149
102
118
130
116
58
Payables (days)
** Working capital cycle
246
254
274
167
166
Source: Note: Valuation ratios based on pre-issue outstanding shares and at upper end of the price
band **(ex-cash) (days)
June 13, 2017
11
Tejas Networks Ltd| IPO Note
Research Team Tel: 022 - 39357800
DISCLAIMER
Angel Broking Private Limited (hereinafter referred to as “Angel”) is a registered Member of National Stock Exchange of India Limited,
Bombay Stock Exchange Limited and Metropolitan Stock Exchange Limited. It is also registered as a Depository Participant with CDSL
and Portfolio Manager with SEBI. It also has registration with AMFI as a Mutual Fund Distributor. Angel Broking Private Limited is a
registered entity with SEBI for Research Analyst in terms of SEBI (Research Analyst) Regulations, 2014 vide registration number
INH000000164. Angel or its associates has not been debarred/ suspended by SEBI or any other regulatory authority for accessing
/dealing in securities Market. Angel or its associates/analyst has not received any compensation / managed or co-managed public
offering of securities of the company covered by Analyst during the past twelve months.
This document is solely for the personal information of the recipient, and must not be singularly used as the basis of any investment
decision. Nothing in this document should be construed as investment or financial advice. Each recipient of this document should
make such investigations as they deem necessary to arrive at an independent evaluation of an investment in the securities of the
companies referred to in this document (including the merits and risks involved), and should consult their own advisors to determine
the merits and risks of such an investment.
Reports based on technical and derivative analysis center on studying charts of a stock's price movement, outstanding positions and
trading volume, as opposed to focusing on a company's fundamentals and, as such, may not match with a report on a company's
fundamentals. Investors are advised to refer the Fundamental and Technical Research Reports available on our website to evaluate the
contrary view, if any.
The information in this document has been printed on the basis of publicly available information, internal data and other reliable
sources believed to be true, but we do not represent that it is accurate or complete and it should not be relied on as such, as this
document is for general guidance only. Angel Broking Pvt. Limited or any of its affiliates/ group companies shall not be in any way
responsible for any loss or damage that may arise to any person from any inadvertent error in the information contained in this report.
Angel Broking Pvt. Limited has not independently verified all the information contained within this document. Accordingly, we cannot
testify, nor make any representation or warranty, express or implied, to the accuracy, contents or data contained within this document.
While Angel Broking Pvt. Limited endeavors to update on a reasonable basis the information discussed in this material, there may be
regulatory, compliance, or other reasons that prevent us from doing so.
This document is being supplied to you solely for your information, and its contents, information or data may not be reproduced,
redistributed or passed on, directly or indirectly.
Neither Angel Broking Pvt. Limited, nor its directors, employees or affiliates shall be liable for any loss or damage that may arise from
or in connection with the use of this information.
Disclosure of Interest Statement
Company Name
1. Financial interest of research analyst or Angel or his Associate or his relative
No
2. Ownership of 1% or more of the stock by research analyst or Angel or associates or relatives
No
3. Served as an officer, director or employee of the company covered under Research
No
4. Broking relationship with company covered under Research
No
Ratings (Based on expected returns
Buy (> 15%)
Accumulate (5% to 15%)
Neutral (-5 to 5%)
over 12 months investment period):
Reduce (-5% to -15%)
Sell (< -15)
June 13, 2017
12