IPO Note | FMCG
October 3, 2017
Godrej Agrovet Limited
SUBSCRIBE
sue Open: October 04, 2017
Is
IPO Note
Issue Close: October 06, 2017
Godrej Agrovet Limited (GAVL) is a leading Agri-business company operating
across five different business verticals i.e. Animal Feed, Crop Protection, Oil Palm,
Issue Details
Dairy and Poultry & Processed Foods. GAVL is the largest crude palm producer in
India. Company is the 4th largest animal feed producer in Bangladesh through its
Face Value: `10
50:50 JV ACI Godrej.
Present Eq. Paid up Capital: `185.3cr
Diversified business with multiple growth drivers: GAVL is a diversified, R&D
focused agri-business Company. It used to derive 80% of its revenue from animal
Offer for Sale: *1.9cr shares (`853.5cr)-
**1.9cr shares (`865.8cr)
feed business; however the same has come down to 53% in FY17 due to
successful diversification of its business. Currently, palm oil business contributes
Fresh issue: `291.5cr ( *64.8 lakh -**63.4
10% while crop protection (16%) and dairy (21%) have also sizable presence. All
lakh shares)
Post Eq. Paid up Capital:*`192.2cr
-
of its businesses have multiple growth drivers such as high growth potential,
**`192.1cr
increasing organized segment, new product launches, etc. GAVL is likely to
Issue size (amount): *`1,145cr -**1,157 cr
continue the growth momentum which will further diversify its revenue streams.
Price Band: `450-460
Track record of consistent profitability: GAVL clocked revenue/PAT CAGR of
15.5% and 27% respectively over last 5 years as favorable revenue mix led to
Lot Size: 32 shares and in multiple thereafter
improvement in EBITDA margins from 7% in FY13 to 8.9% in FY17. This is also
Post-issue implied mkt. cap:
*`8,649cr
-
helped by the acquisition of Astec LifeScience (Animal protection business) which
**`8,835cr
has superior margin profile. We believe that with the rising contribution of crop
Promoters holding Pre-Issue: 74.8%
protection (FY17: 22% EBIT margins) and palm oil business (FY17: 20% EBIT
Employee reservation: Up to `20cr
(*4.44
margins), overall margins and profitability is likely to improve further.
lakh -**4.35lakh)
Promoters holding Post-Issue:
*68.6%-
Strong return profile: GAVL consistently reported >30% ROE between FY14-FY16.
**68.8%
In FY17, company reported 27% ROE and with the favorable revenue mix, we
*Calculated on lower price band
believe that GAVL is expected to remain a high ROE company going ahead.
** Calculated on upper price band
Valuations and outlook: At the upper end of the price band (`450-`460),
Book Building
company is asking for a market cap of `8,835cr, at the PE multiple of 33.5x of its
FY17 adj. PAT. While there is no exact peer to compare with GAVL’s diversified
QIBs
50% of issue
business, we note that businesses which are present in at least one of the
Non-Institutional
15% of issue
segments of GAVL, trade in a PE multiple range of 22x-57x and ROE profile
range of 15%-30%. At 33.5x, GAVL does not appear expensive as PE multiple is
Retail
35% of issue
in the mid of this range and ROE is at the higher end of the range. We assign a
subscribe rating to this IPO considering its diversified business profile, decent
margins, strong return ratios, healthy balance sheet and strong history of its
parent.
**Post Issue Shareholding Pattern
Promoters Group
68.8
Key Financials
Y/E March (` cr)
FY2014
FY2015
FY2016
FY2017
DIIs/FIIs/Public & Others
31.2
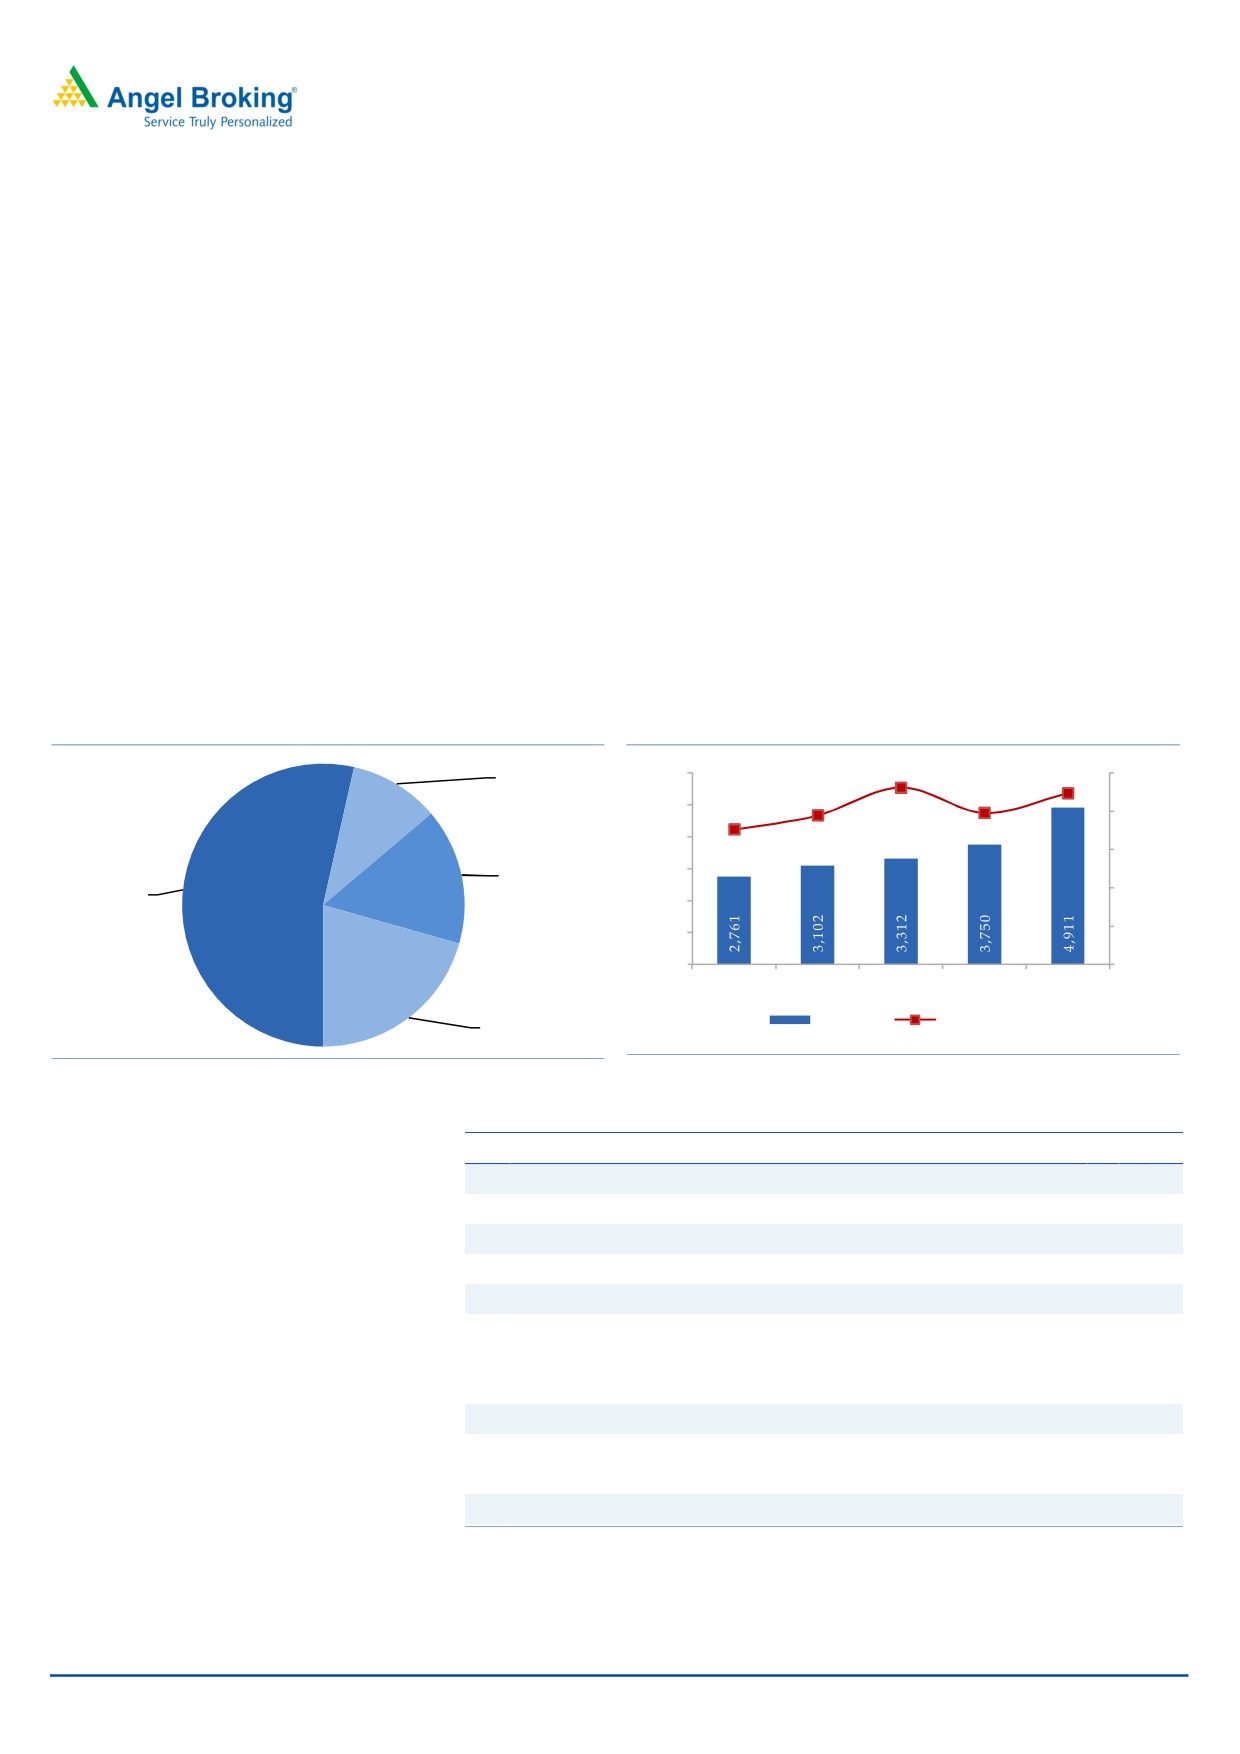
Net Sales
3,102
3,312
3,750
4,911
% chg
12.4
6.7
13.2
31.0
Net Profit
157
210
261
274
% chg
61.8
34.2
24.3
5.1
OPM (%)
7.8
9.2
7.9
8.9
EPS (Rs)
8.4
9.4
9.0
13.7
P/E (x)
54.5
49.1
51.2
33.5
P/BV (x)
16.4
13.3
10.9
8.4
Shrikant Akolkar
RoE (%)
30.2
32.8
33.3
27.2
RoCE (%)
18.8
20.3
11.8
21.8
+91 22 39357800 Ext: 6846
EV/Sales (x)
3.0
2.9
2.7
1.9
EV/EBITDA (x)
38.7
31.1
34.0
21.5
Source: Company, Angel Research
Please refer to important disclosures at the end of this report
1
Godrej Agrovet| IPO Note
Company background
Godrej Agrovet was incorporated in 1991 with a focus on agricultural business
and has become a diversified business along the way. Company operates 5
separate businesses i.e. animal feeds, crop protection, oil palm, dairy, and poultry
and processed foods. Animal feed is its largest business which contributes more
than half of its total revenue.
In 1994, company entered the poultry business while in 2004, company entered in
the animal feed business in Bangladesh by forming a JV (ACI Godrej) with
Advanced Chemical Industries Limited. In 2008, company entered into a JV with
Tyson India Holding Limited to grow its poultry and processed foods business.
In 2005, GAVL acquired a 26% stake in Creamline Dairy Products Ltd and raised
this stake to 51.9% in 2015. Creamline dairy is involved in the business of milk
and milk-based products under the Jersey brand. GAVL also acquired a majority
stake in Astec LifeSciences to boost its manufacturing capabilities in agro-
chemicals and to backward integrate its crop protection business.
Exhibit 1: Business mix (FY17)
Exhibit 2: Revenue growth and margin profile
9.2%
Vegetable oil,
6,000
8.9%
10.0%
10%
7.8%
7.9%
5,000
7.0%
8.0%
4,000
Crop
6.0%
protection,
3,000
Animal feed,
16%
4.0%
2,000
53%
2.0%
1,000
0
0.0%
FY13
FY14
FY15
FY16
FY17
Dairy, 21%
Net sales
EBITDA marigns
Source: Company, Angel Research, #JVs are not consolidated
Source: Company, Angel Research, #includes Astec LifeScinece revenues
Exhibit 3: Evolution of GAVL’s business
Year
Milestone
1991
Incorporation of GAVL
1992
Acquisition of the agrovet division from Godrej Soaps Limited
1997
Acquisition of the oil palm business from Godrej Soaps Limited
1999
Acquisition of the poultry business from IPF Breeders Private Limited
2004
JV in Bangladesh (ACI Godrej)
Acquisition of 26% stake in Polchem Hygiene Laboratories
2005
Acquisition of 26% stake in Creamline Dairy
Acquisition of shrimp feed business from Higashimaru Feeds (India) Limited
2012
V-Sciences buys 19.99% equity stake in GAVL
Acquisition of majority stake in Astec Lifescience
2015
Increases its stake from 26% to 52% in Creamline Dairy
2016
Sold its stake in Polchem Hygiene Laboratories
Source: Company, Angel Research
October 3, 2017
2
Godrej Agrovet| IPO Note
Business segments
Animal feed business: GAVL produces cattle feed, poultry feed (broiler and layer),
aqua feed (fish and shrimp) and specialty feed at its 35 facilities with production
capacity of 2.36 million MT/ annum. It has a pan-India distribution network of
~4,000 distributors. GAVL also has a 50:50 joint venture in Bangladesh named
ACI Godrej which produces cattle, poultry and fish feed in Bangladesh and has 2
manufacturing facilities with production capacity of 0.57 million MT/annum.
Crop protection business: GAVL manufactures a wide range of products such as
plant growth regulators, organic manures, generic agrochemicals and specialized
herbicides and sells it to retail customers. In October 2015, GAVL acquired
56.82% stake in Astec LifeSciences which is in the manufacturing of agrochemical
active ingredients (technical), bulk and formulations and intermediates. Astec sells
products in India as well as exports them to 24 countries. GAVL has distribution
network of ~6,000 distributors in India.
Palm oil business: GAVL produces crude palm oil, crude palm kernel oil and palm
kernel cake. Company purchases fresh fruit bunches (FFB) from palm oil farmers.
GAVL has access to ~61,700 hectares land under oil palm plantation and has set
up 5 palm oil mills in India with an aggregate FFB processing capacity of 125 MT
/hour and a palm kernel processing capacity of 7 MT /hour.
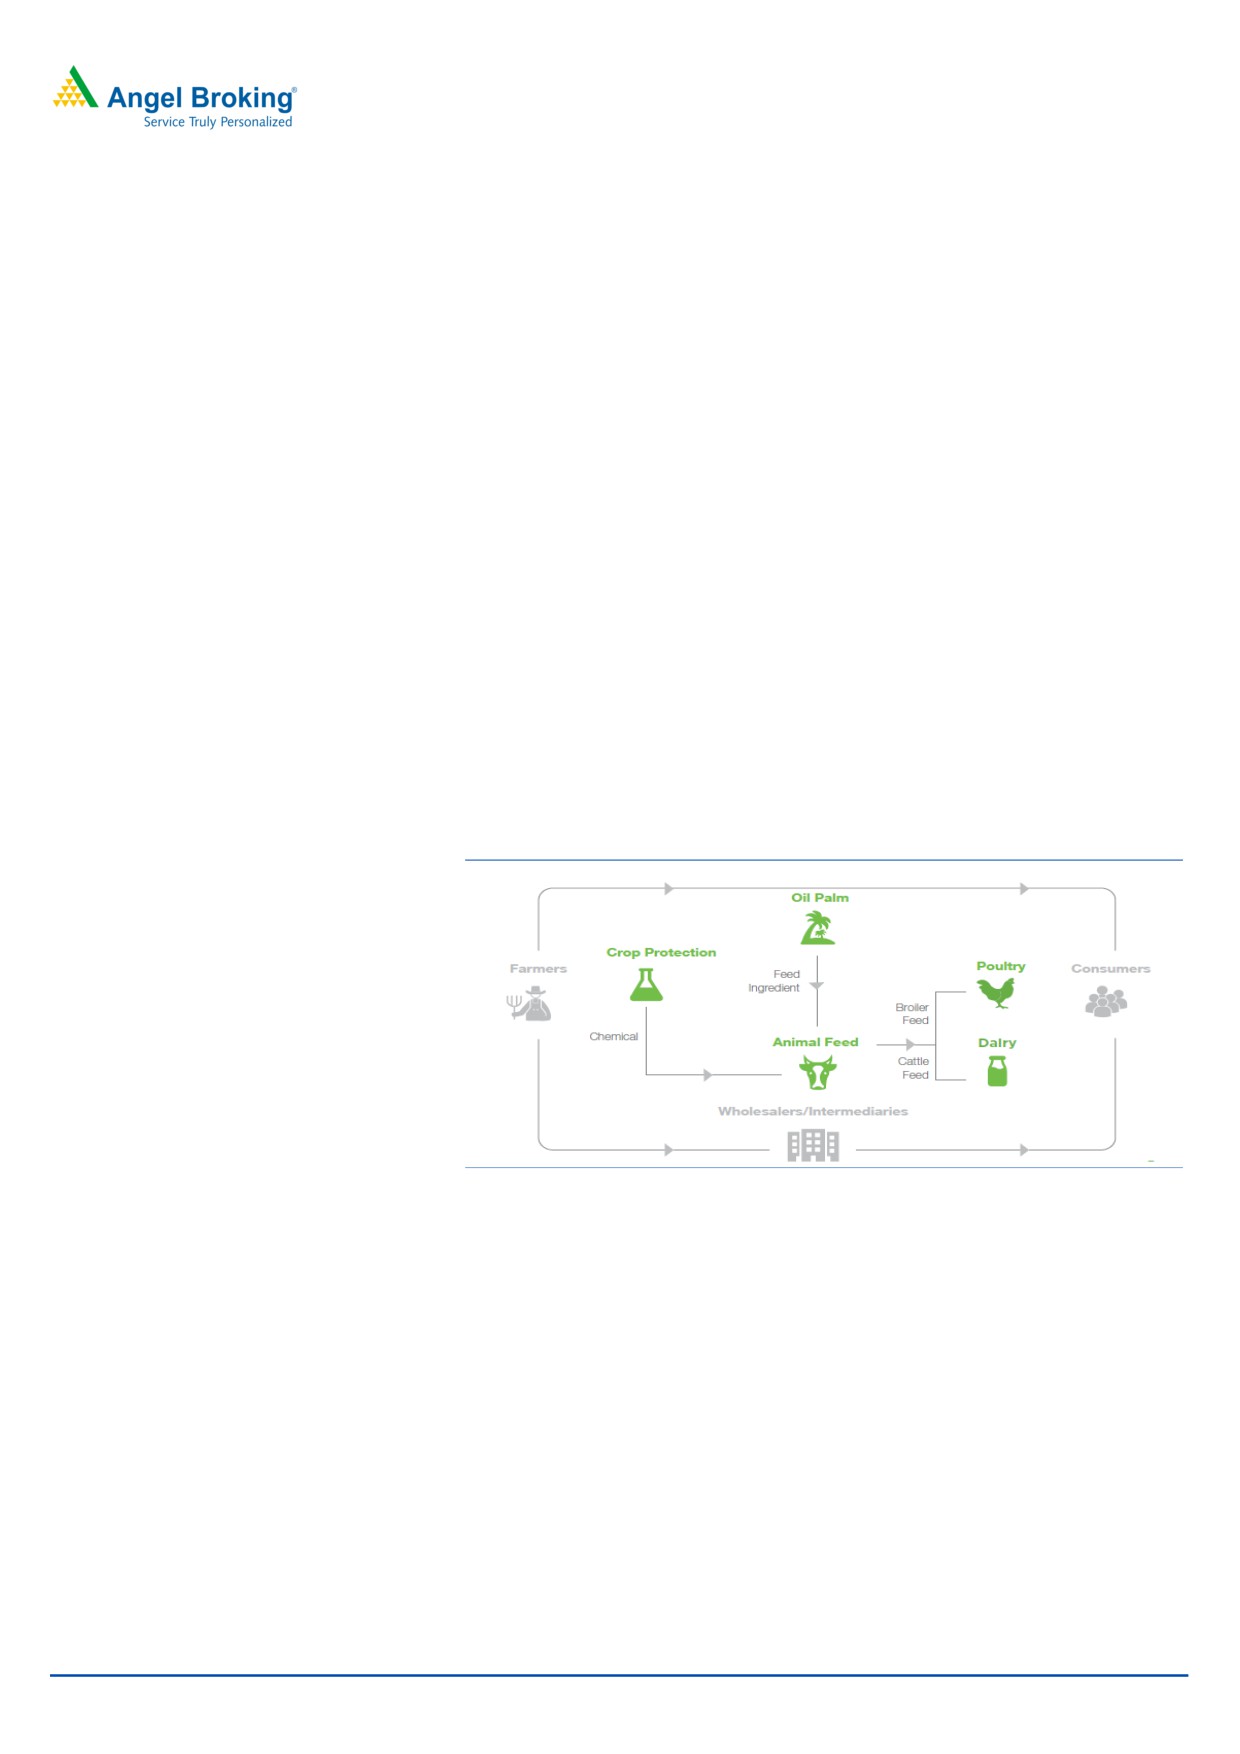
Exhibit 4: Inter-linkages Between Business Verticals
Source: Company, Angel Research
Dairy business: Company sells milk and milk based products under the brand
‘Jersey’ through its subsidiary, Creamline Dairy, across the states of Telangana,
Andhra Pradesh, Tamil Nadu, Karnataka and Maharashtra. Company owns and
operates 9 milk processing units and has a supply network of 120 chilling centers
and 4,000 milk distributors, ~3,000 milk product distributors and 50 retail
parlors, as of June-2017.
Poultry business: It manufactures and markets processed poultry and vegetarian
products through its brands Real Good Chicken and Yummiez. Company ventured
into the poultry business in 1994 by launching the Real Good Chicken bran. In
2008, to grow its poultry and processed foods business, company entered into a
joint venture with Tyson India Holding Limited. It has set up 2 processing plants
with integrated breeding and hatchery operations and has a diverse customer base
comprising of retail customers as well as institutional clients such as restaurants,
food service companies and hotels.
October 3, 2017
3
Godrej Agrovet| IPO Note
Issue details
The IPO consists of OFS (`854cr on lower band and `866cr on upper band) and a
fresh issue of `292cr. Through this IPO, V-Sciences Investments Pte Ltd, an indirect
wholly owned subsidiary of Temasek Holdings (Private) Limited will take a partial
exit while promoters will also sell some part of their shares from the company.
Before the IPO, V-Sciences Investments held 20% stake in the company which was
bought in 2012. After the IPO, the stake of V-Sciences Investments would come
down to 12.9% while promoters’ stake would come down to 68.8% from existing
74.8%. `20cr of the issue is reserved to the employees.
Separately a total 4,05,500 shares will be issued by the company to its already
identified employees as per GAVL’s Employee Share Purchase Scheme which will
fetch it `18.2cr on the lower band and `18.7cr on the upper band.
In the pre-IPO placement, GAVL has already issued `8.5cr by issuing 192,901
shares at `440/share.
Exhibit 5: Selling shareholders and pre and post IPO shareholding pattern
Pre-Issue
Post-Issue
Shareholder
No of shares
% of shareholding
No of shares
% of shareholding
Promoter
138,614,840
74.8
132,093,101
68.8
V-Sciences Investments Pte Ltd
37,007,698
20.0
24,707,698
12.9
Other public
9,701,239
5.2
35,265,696
18.4
185,323,777
100.0
192,066,494
100.0
Source: Company, Angel Research
Objects of the fresh issue
Repayment of working capital facilities (`100cr)
Repayment of commercial papers (`150cr)
General corporate purposes
October 3, 2017
4
Godrej Agrovet| IPO Note
Investment Rationale
A diversified business with improving business mix: GAVL operates a diversified
business model, the business segments of which are also interlinked together.
While the animal feed is its largest business, the company has been seeing a rapid
change in its revenue mix. Animal feed used to contribute 81% of revenue in FY13
the same however has come down to 53% in FY17. During this period, palm oil
business contribution has remained constant at 10% and crop protection business
has seen rapid increase in its contribution which has increased from 8% in FY13 to
~16% in FY17. Contribution of dairy business has also seen rapid growth from 1%
of total revenue in FY13 to 20% in FY17.
During this period, GAVL adopted an inorganic route to expand its business with
acquisition of Astec LifeSciences in crop protection business and increasing its
stake in the company Creamline Dairy in milk business.
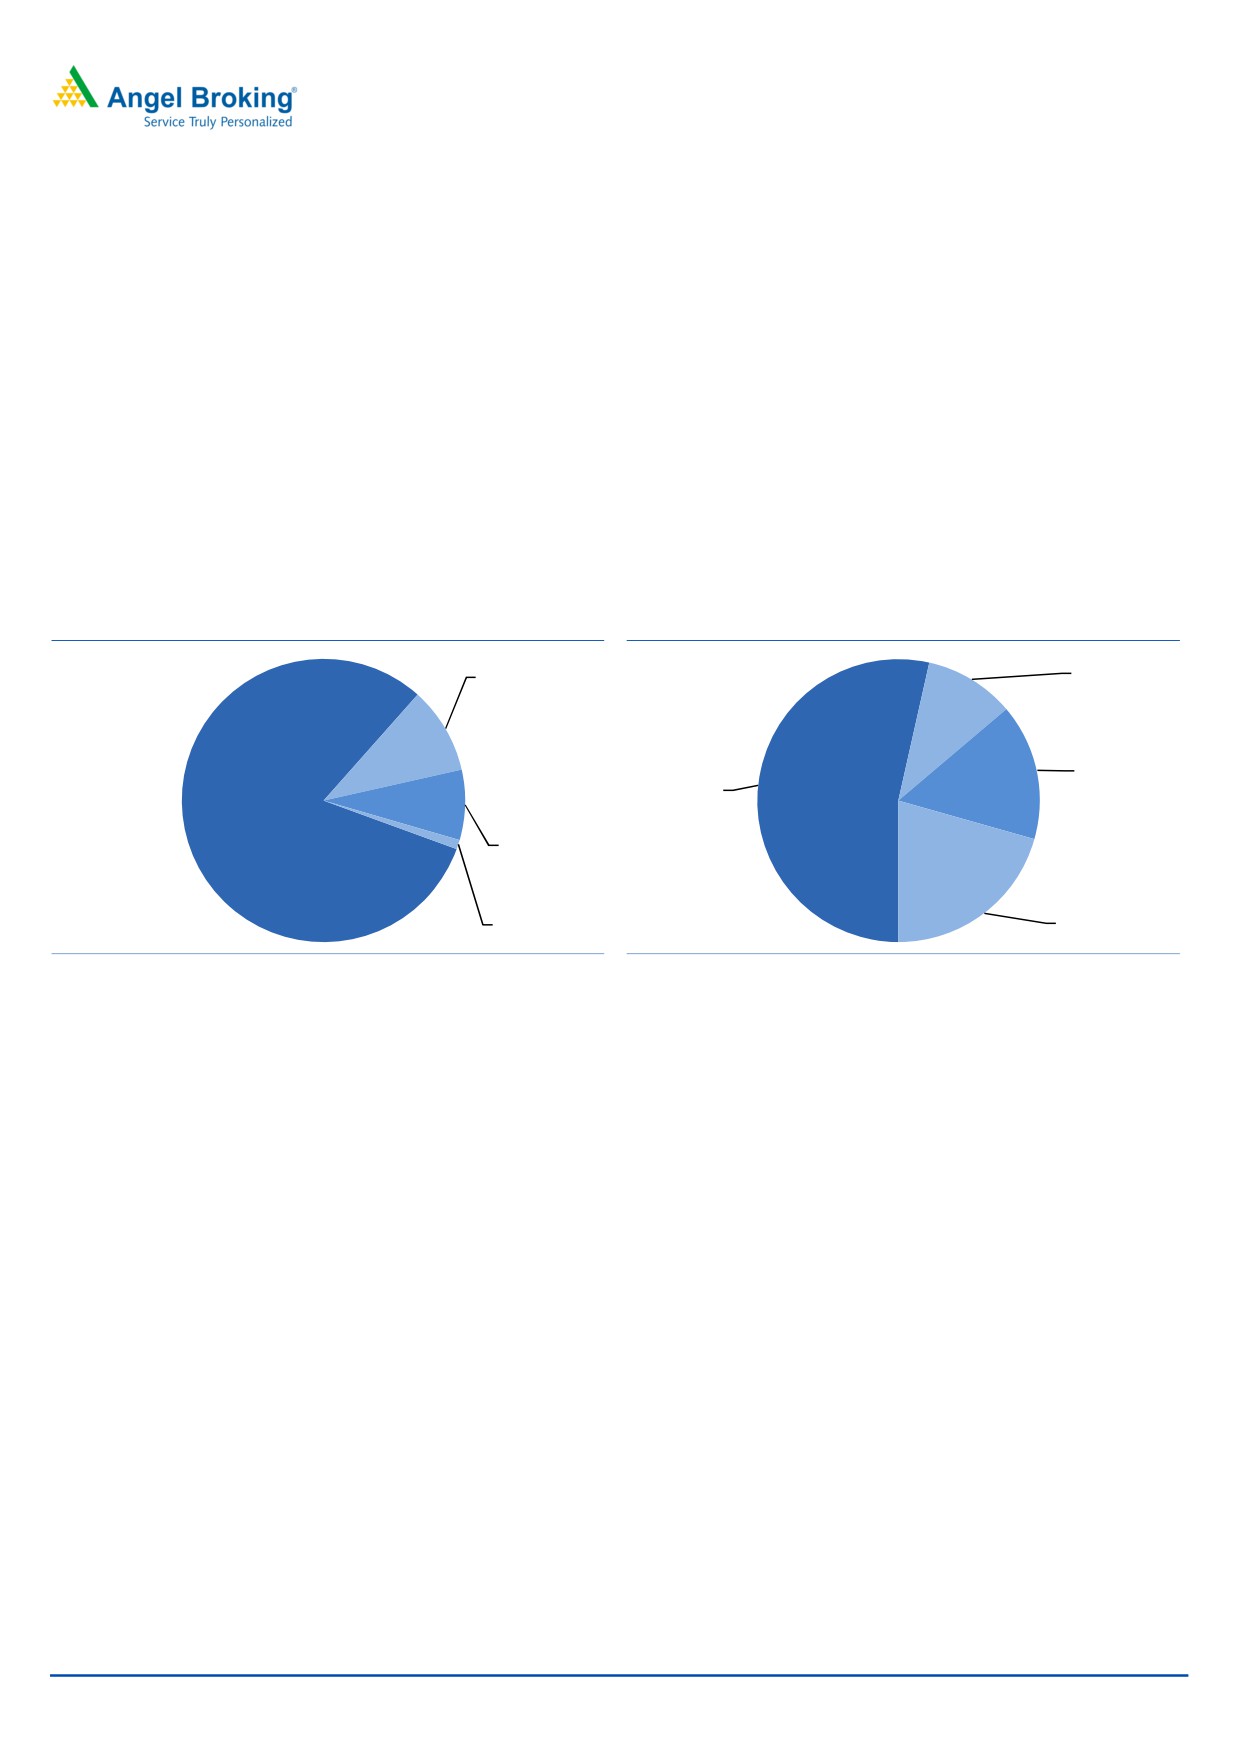
Exhibit 6: Evolution of its business mix
Exhibit 7: 27% CAGR in revenue between FY13-FY17
Vegetable oil,
Vegetable oil,
10%
10%
Crop
protection,
Animal feed,
16%
53%
Crop
Animal feed,
protection, 8%
81%
Dairy, 1%
Dairy, 21%
Source: DRHP, Angel Research, #JVs are not consolidated
Source: DRHP, Angel Research, #JVs are not consolidated
Additionally company also has a joint venture in its poultry business with Tyson
India Holdings Limited (subsidiary of Tyson Foods inc) named as Godrej Tyson
Foods. Godrej holds 49% stake in this business and this is a sizable business with
`446cr in revenues in FY17. While this business is not consolidated in total
revenues, at 49% of `446cr, poultry business can make ~4% of its total revenue.
We like GAVL’s diversified business model and that each business has a multiple
growth drivers which will benefit the company.
GAVL’s business segments have multiple growth drivers: GAVL’s diversified
business has multiple growth drivers in place.
1) ANIMAL FEED
Domestic animal feed industry drivers: Currently animal feed industry is about
`715bn-`725bn expected to grow at 13-14% over next 3 years. Within this
industry, poultry feed contributes 67% while cattle feed contributes ~21% and
rest 12% is contributed by aqua feed. The animal food industry is expected to
grow at ~14% CAGR to reach `1,060bn in 2020, within this poultry feed and
aqua feed segments will grow at 15% CAGR each while cattle feed will grow
by ~10% CAGR. The feed industry has a huge contribution of unorganized
segment (cattle feed ~88%, fish food 50% and shrimp food 80%) which
means that organized players like GAVL can gain market share in the industry
leading to a sizable growth opportunity.
October 3, 2017
5
Godrej Agrovet| IPO Note
Bangladesh animal feed industry drivers: The Company has a joint venture
named ACI Godrej in Bangladesh which operates in the animal feed business.
This industry in Bangladesh has a demand gap meaning demand is outpacing
the supply which is favorable for companies operating in this segment.
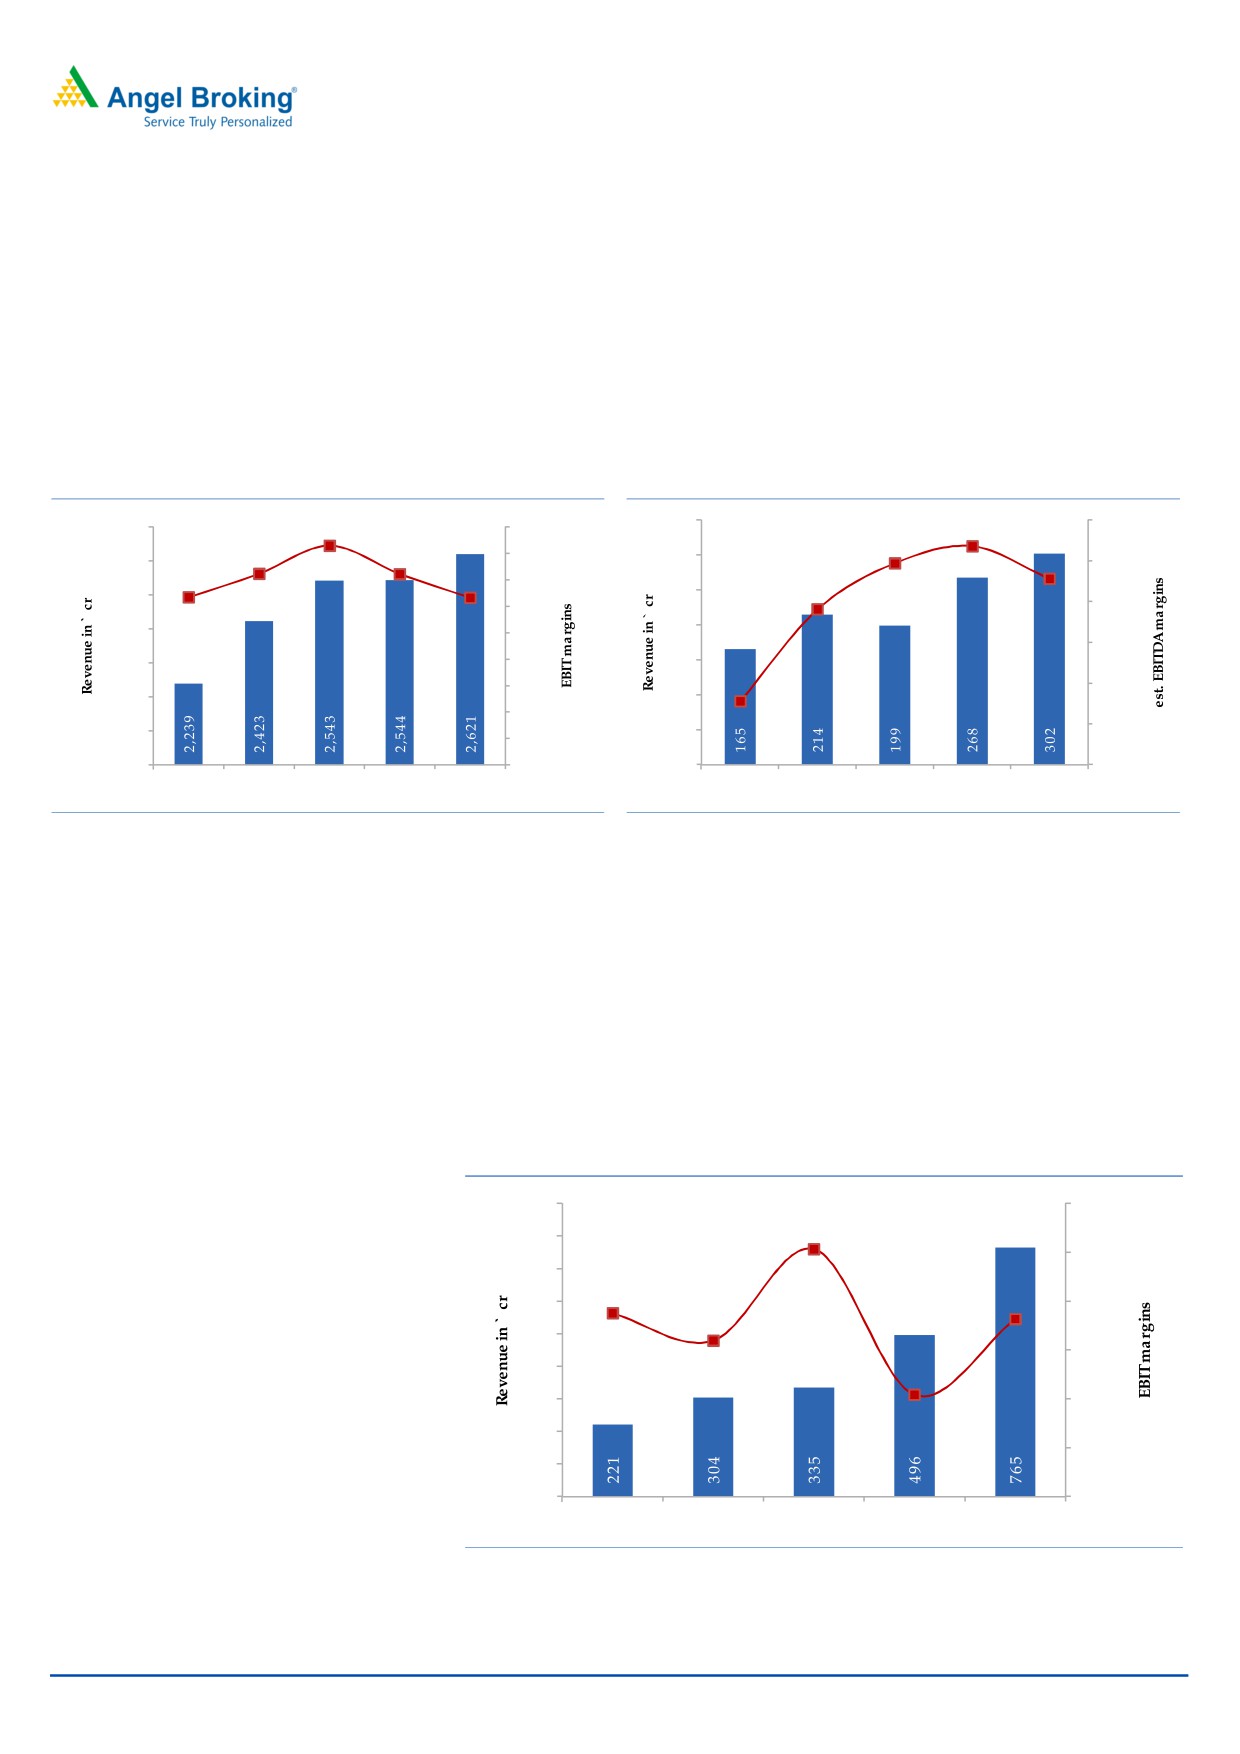
GAVL is present in all three animal feed segments in India (Poultry, cattle and
fish) and has seen revenue growth at CAGR 4% between FY13-FY17. ACI
Godrej is a 4th largest company in Bangladesh animal feed market growing at
a strong revenue CAGR of 16% (FY13-FY17)
Exhibit 8: Evolution of its business mix
Exhibit 9: 16% CAGR in revenue between FY13-FY17
350
9.9%
10.7%
12.0%
2,700
8.3%
9.0%
6.3%
7.2%
7.2%
8.0%
300
2,600
9.1%
10.0%
6.3%
7.0%
3.1%
250
7.6%
2,500
8.0%
6.0%
2,400
200
5.0%
6.0%
2,300
4.0%
150
3.0%
4.0%
2,200
100
2.0%
2.0%
2,100
50
1.0%
2,000
0.0%
0
0.0%
FY13
FY14
FY15
FY16
FY17
FY13
FY14
FY15
FY16
FY17
Source: DRHP, Angel Research
Source: DRHP, Angel Research
2) CROP PROTECTION
Industry drivers: The Indian crop protection market is ~`205bn in 2017 and it
is growing at a CAGR of 9.7% since 2013. Of this ~52% is domestic
consumption and 48% is exports. The crop protection industry has strong
drivers like increasing farm income, need to increase crop yields, rising use of
herbicides and pesticides, etc. Currently insecticides form 54% of the total
industry which will come down to 52% while herbicides’ contribution will
increase from 20% in 2017 to 21% in 2020 and fungicides’ contribution will
increase from 21% in 2017 to 22% in 2020.
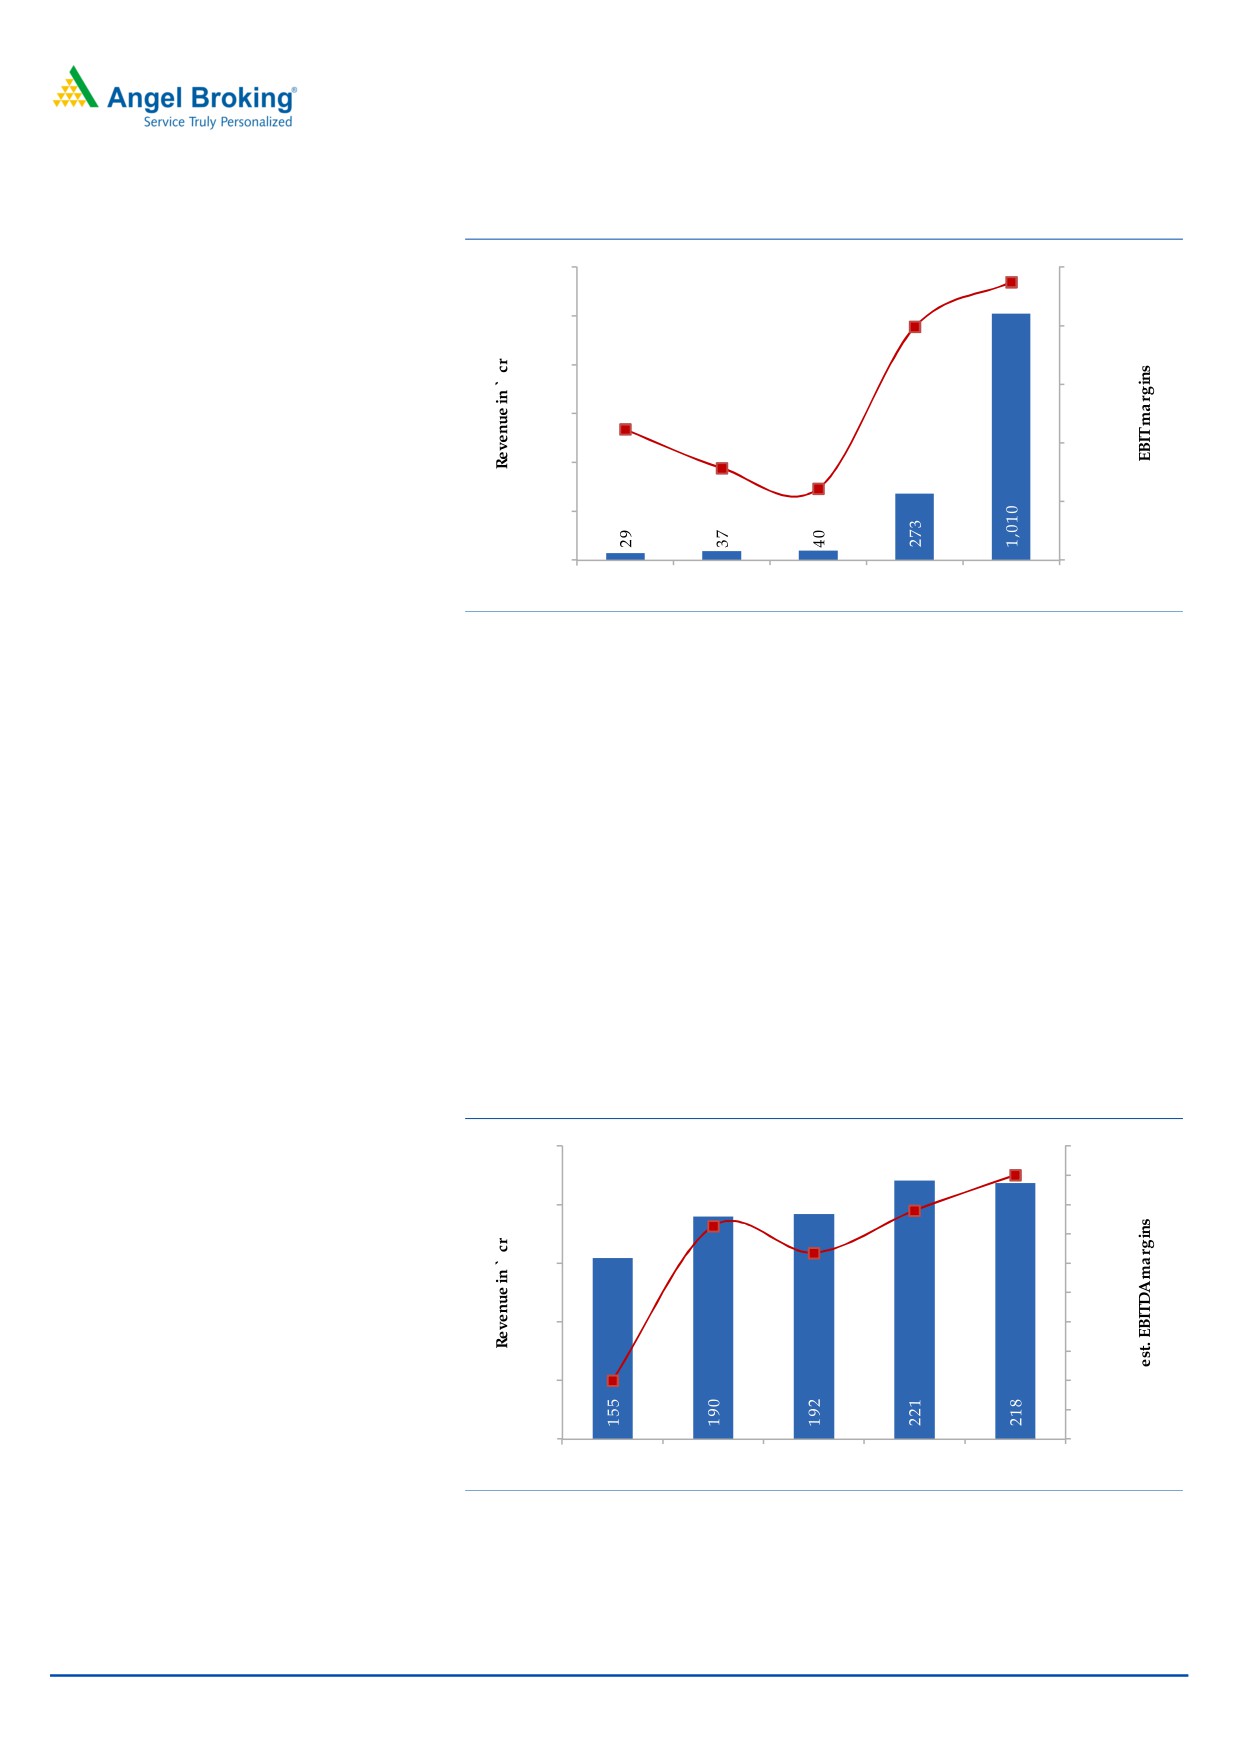
Exhibit 10: 36% CAGR in Crop protection revenues
900
27.0%
25.1%
800
22.3%
25.0%
700
22.5%
600
23.0%
21.4%
19.2%
500
21.0%
400
300
19.0%
200
17.0%
100
0
15.0%
FY13
FY14
FY15
FY16
FY17
Source: DRHP, Angel Research, #Includes Astec LifeSciences revenues
GAVL is present in herbicides and plant growth regulators and through the
acquisition of Astec LifeSciences it also has a acquired a portfolio of
October 3, 2017
6
Godrej Agrovet| IPO Note
agricultural active ingredients and intermediates. Company has
2
manufacturing facilities and it exports to 24 countries.
3) PALM OIL
Industry drivers: India is seeing rapid increase in the palm oil consumption
and 50% of the total supply is imported which makes India as largest imported
of edible oil in the world. India’s edible oil consumption is expected to
increase from average 14.8kg per capita (2012-14) to 19 kg per capita in
2024 which still will be below the global average of 21kg per capita. To
reduce the reliance on edible oil imports, government has sponsored palm oil
cultivation in the country.
GAVL is the market leader in domestic palm oil business with 35% market
share. It has 5 oil mills with fresh fruit bunches processing capacity of 125MT
per hour. It has 61,700 hectares land under oil palm cultivation (1/5th of the
total land under oil palm cultivation in India.
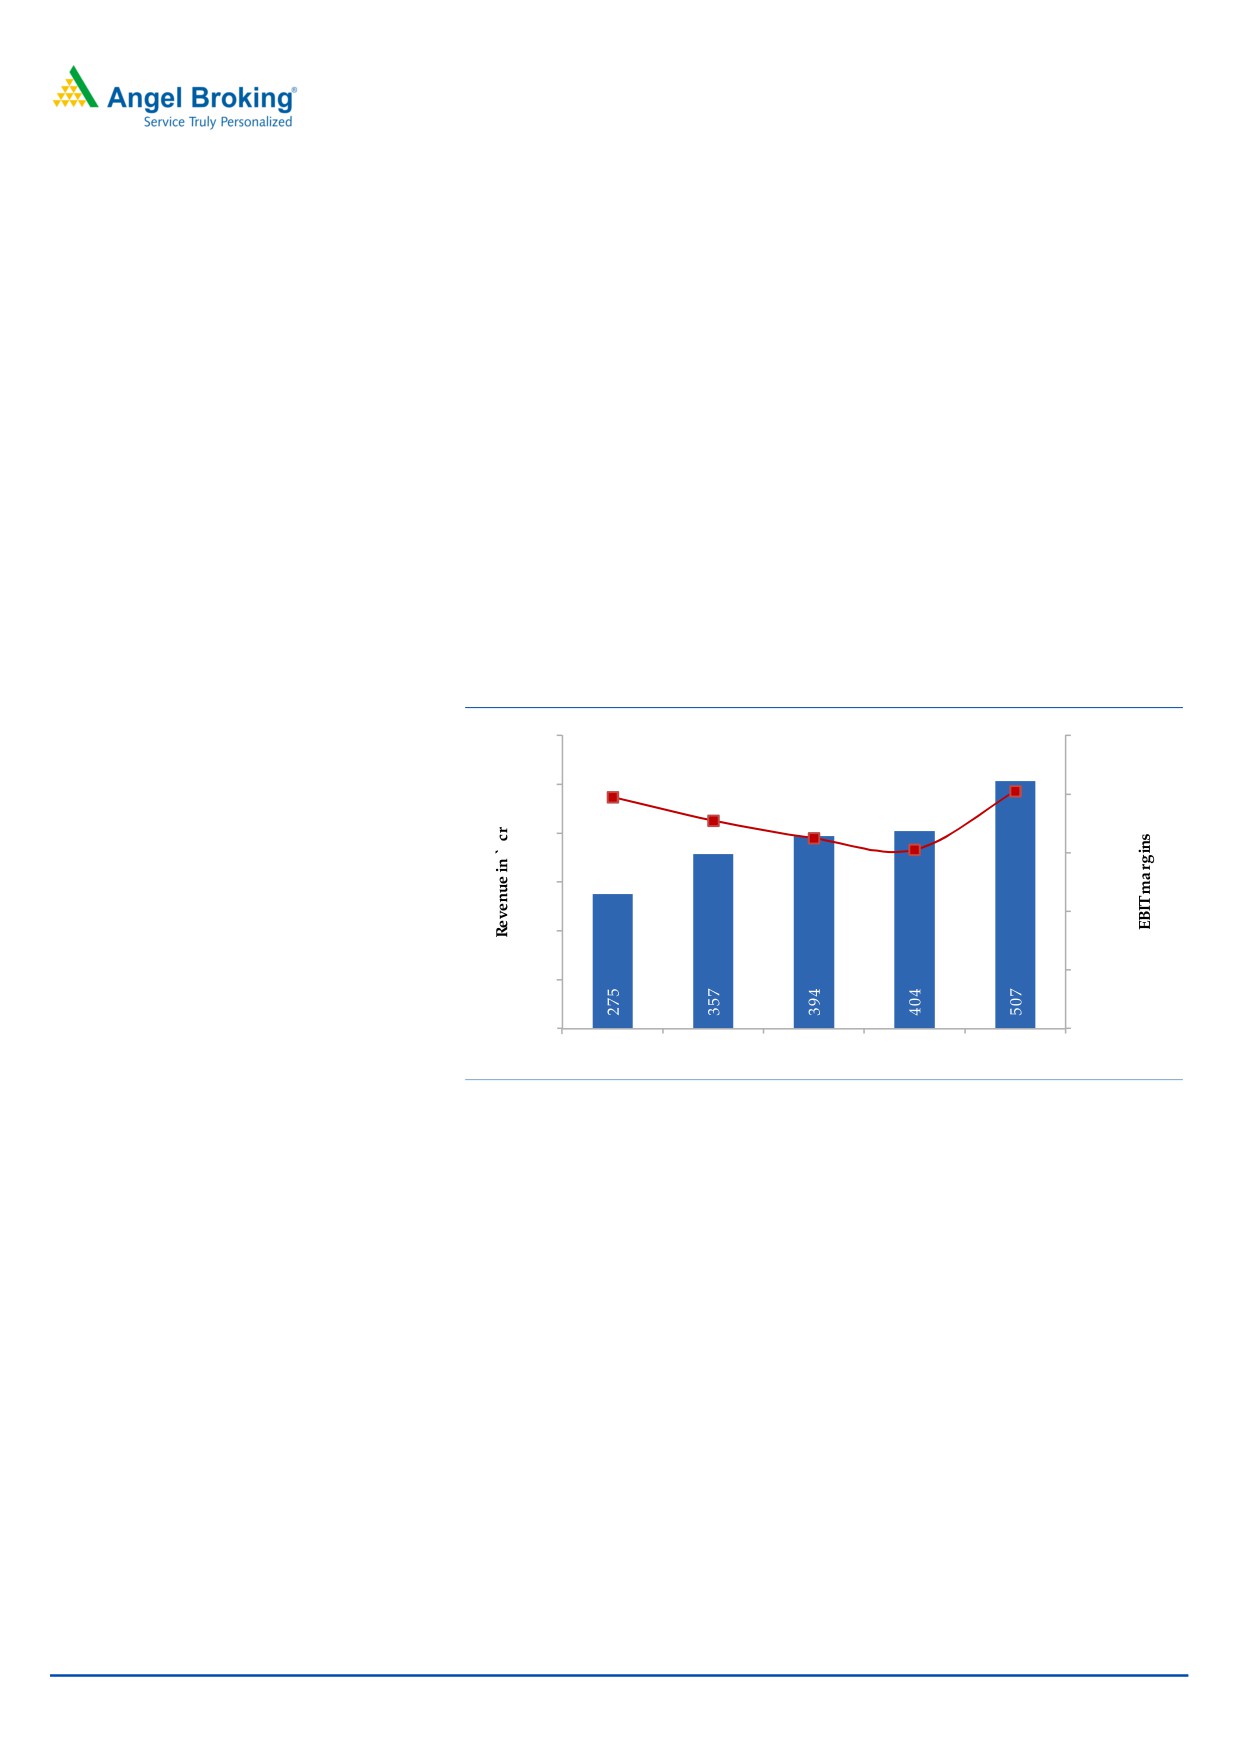
Exhibit 11: 16.5% CAGR in oil palm revenues
600
25.0%
20.3%
19.7%
500
17.7%
20.0%
16.2%
15.2%
400
15.0%
300
10.0%
200
5.0%
100
0
0.0%
FY13
FY14
FY15
FY16
FY17
Source: DRHP, Angel Research
4) DAIRY BUSINESS
Industry drivers: While India is one of the largest milk produce, we are lagging
behind in the milk consumption. Rising population and rising income levels
are the structural growth drivers for the industry. The high share of the
unorganized players (73% in 2017) also makes a case of growth for the
organized players like GAVL.
GAVL sells milk products under its brand, Jersey. Its main focus area is
Maharashtra, Karnataka, Andhra Pradesh, Telangana and Tamil Nadu.
Company has 4,000 milk distributors and 3,000 milk product distributors.
Company plans to increase value added product in its portfolio which will help
it achieve revenue growth and improve the margin profile.
October 3, 2017
7
Godrej Agrovet| IPO Note
Exhibit 12: GAVL’s dairy business is sizable
3.7%
1,200
5.0%
-0.1%
1,000
0.0%
800
-5.0%
-8.9%
600
-12.2%
-10.0%
400
-13.9%
-15.0%
200
0
-20.0%
FY13
FY14
FY15
FY16
FY17
Source: DRHP, Angel Research, Includes revenue of Creamline Dairy
5) POULTRY AND PROCESSED FOODS
Industry drivers: Meat consumption in India (3.7kg per year) is well below the
global average (17Kg per year). However this has been growing at a CAGR of
15-20% over the last decade due to the favorable demographics. India’s
poultry market is ~`5.65bn (3.5 million MT) of which 98% is live poultry and
the rest 2% is processed chicken market. The emergence of malls and hyper
markets is set to change this scenario. The 70% of the industry is organized
while 30% is unorganized.
GAVL through its JV with Godrej Tyson sells fresh and processed chicken
through its brands Real Good chicken and Yummiez. Company has
2
vertically integrated facilities. Company plans to introduce new value added
products and increase its reach in this market.
Exhibit 13: Poultry business growing at 9% CAGR
250
10.0%
9.0%
7.8%
9.0%
6.4%
200
7.3%
8.0%
2.0%
7.0%
150
6.0%
5.0%
100
4.0%
3.0%
50
2.0%
1.0%
0
0.0%
FY13
FY14
FY15
FY16
FY17
Source: DRHP, Angel Research
Margin improvement likely with favorable business mix: GAVL is seeing rapid
change in the business mix with rising contribution of segments with higher
operating margins. The vegetable oil and crop protection business clocked
operating margins of 20% and 22% respectively in FY17 and these two businesses
October 3, 2017
8
Godrej Agrovet| IPO Note
contribute 25% of the total revenues in FY17 vs. 18% in FY13. With the growth
expected to be strong going ahead, we believe that GAVL is likely to see
improvement in operating margins which will pave way for higher profitability and
improvement in the return ratios.
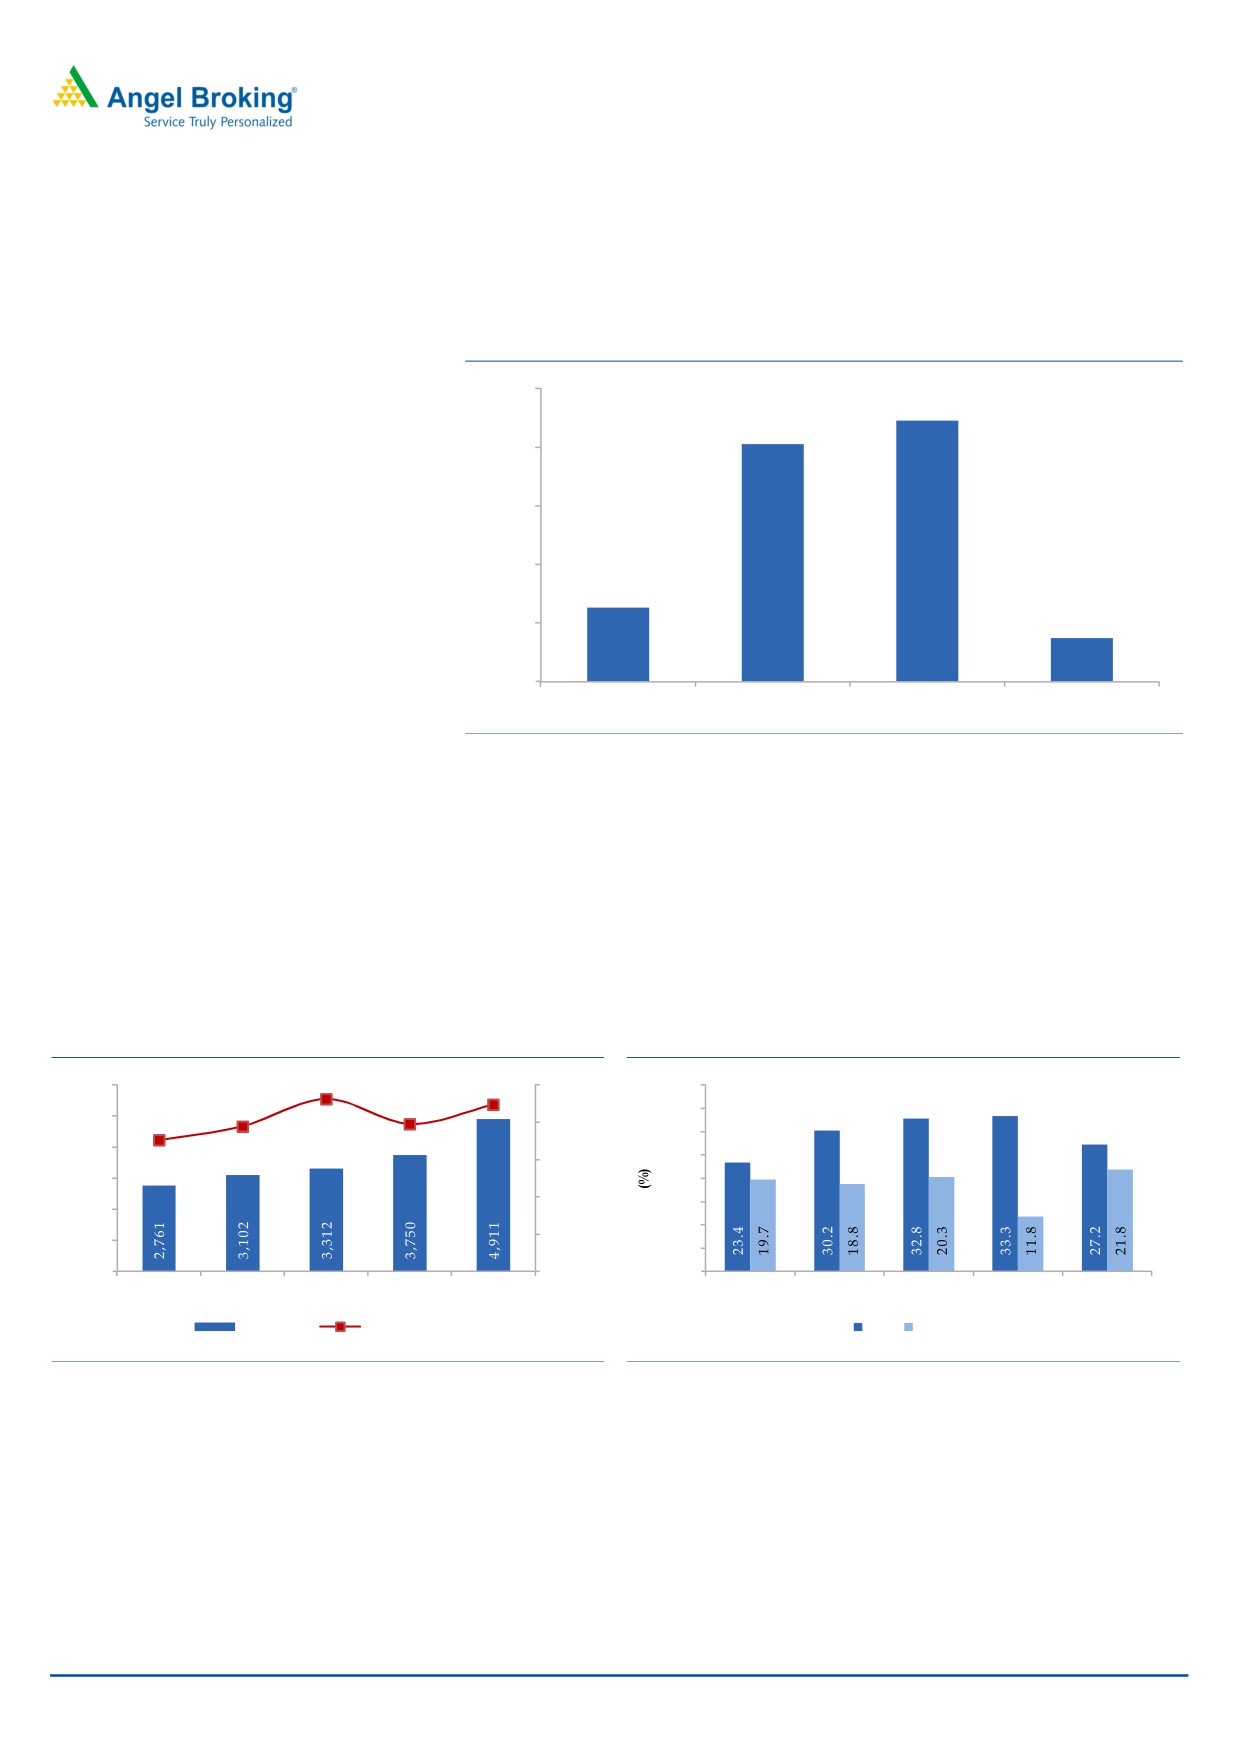
Exhibit 14: Margin profile of GAVL’s major segments
25.0%
22.3%
20.3%
20.0%
15.0%
10.0%
6.3%
5.0%
3.7%
0.0%
Animal feed
Vegetable oil
Crop protection
Dairy
Source: DRHP, Angel Research
Proven track record of profitability and returns: GAVL has shown a strong track
record of growth and profitability. Company has clocked a top line CAGR of
15.6% between FY13-FY17. Thanks to its favorable business mix, margins have
improved from 7% in FY13 to 8.9% in FY17. Its poultry JV during this period has
shown a CAGR of 9% and has shown turned around from loss of `11cr in FY13 to
profit of `15cr in FY17. Similarly its Bangladesh JV in animal feed business has
seen revenue CAGR of 16% (FY13-17). The Bangladesh JV has also seen a
turnaround with profit of `23cr in FY17 from loss of `4cr in FY13.
Exhibit 15: Sales CAGR of 15.5%, Margins improving
Exhibit 16: Trends in ROE and ROCE
9.2%
6,000
8.9%
10.0%
40.0
7.8%
7.9%
35.0
5,000
7.0%
8.0%
30.0
4,000
6.0%
25.0
3,000
20.0
4.0%
15.0
2,000
10.0
2.0%
1,000
5.0
0
0.0%
-
FY13
FY14
FY15
FY16
FY17
FY13
FY14
FY15
FY16
FY17
Net sales
EBITDA marigns
ROE ROCE
Source: Company, Angel Research
Source: Company, Angel Research
Owing to the strong growth in the business, PAT has grown at 2.6x over the last
five years (CAGR of 27%). The return on equity has also moved up from 23% in
FY13 to 27% in FY17 with >30% ROE between FY14-FY16. Company has a
strong balance sheet with debt of `660cr and debt to equity ratio of 0.6x in FY17.
Working capital days had increased in FY15 and FY16; however the same has
seen improvement in FY17.
October 3, 2017
9
Godrej Agrovet| IPO Note
Outlook and Valuation:
At the upper end of the price band (`450-`460), company is asking for a market
cap of `8,835cr, at the PE multiple of 33.5x of its FY17 adj. PAT. While there is no
exact peer to compare with GAVL’s diversified business, we note that businesses
which are present in at least one of the segments of GAVL, trade in a PE multiple
range of 22x-57x and ROE profile range of 15%-30%. At 33.5x, GAVL does not
appear expensive as PE multiple is in the mid of this range and ROE is at the
higher end of the range. We assign a subscribe rating to this IPO considering its
diversified business profile, decent margins, strong return ratios, healthy balance
sheet and strong history of its parent.
Downside risks
Higher competition in the existing business
Lower profitability of crop protection and palm oil business
Underperformance of the JVs (ACI Godrej and Godrej Tyson)
October 3, 2017
10
Godrej Agrovet| IPO Note
Income statement
Y/E March (` cr)
FY13
FY14
FY15
FY16
FY17
Net Sales
2,761
3,102
3,312
3,750
4,911
% chg
12.4
6.7
13.2
31.0
Total Expenditure
2,566
2,861
3,006
3,454
4,472
Raw Material Consumed
2,243
2,504
2,616
2,945
3,796
Personnel Expenses
104
130
133
156
232
Others Expenses
218
227
257
353
444
EBITDA
195
242
306
297
439
% chg
24.1
26.7
(3.1)
48.1
(% of Net Sales)
7.0
7.8
9.2
7.9
8.9
Depreciation& Amortisation
19
28
37
52
75
EBIT
175
214
269
244
365
% chg
22.1
25.8
(9.2)
49.2
(% of Net Sales)
6.3
6.9
8.1
6.5
7.4
Share of equity-accounted
(1)
19
17
33
19
investees, net of tax
Other income
11
15
14
63
57
Interest & other Charges
49
40
65
98
86
Recurring PBT
137
207
234
242
354
% chg
51.3
13.1
3.3
46.3
Exceptional Items
-
-
36
95
20
PBT (reported)
137
207
271
337
374
Tax
40
51
61
75
100
(% of PBT)
29.4
24.4
22.4
22.4
26.6
PAT before MI
97
157
210
261
274
Minority Interest (after tax)
-
-
-
-
-
Profit/Loss of Associate Company
-
-
-
-
-
PAT after MI(reported)
97
157
210
261
274
Exceptional Items
-
-
-
-
-
Reported PAT
97
157
210
261
274
% chg
61.8
34.2
24.3
5.1
(% of Net Sales)
3.5
5.0
6.3
7.0
5.6
Basic EPS (`)
5.2
8.4
9.4
9.0
13.7
Fully Diluted EPS (`)
5.2
8.4
9.4
9.0
13.7
% chg
61.8
10.9
(4.1)
52.8
Source: DRHP, Angel Research
October 3, 2017
11
Godrej Agrovet| IPO Note
Balance Sheet
Y/E March (` cr)
FY13
FY14
FY15
FY16
FY17
SOURCES OF FUNDS
Equity Share Capital
13
13
93
93
185
Reserves& Surplus
400
505
548
691
825
Shareholders’ Funds
414
519
640
783
1,010
Minority Interest
-
-
-
232
254
Total Loans
476
620
685
1,281
660
Other long term liabilities
1
8
12
54
51
Long-term provisions
9
12
14
20
27
Deferred Tax Liability
26
43
57
146
167
Total Liabilities
925
1,203
1,407
2,517
2,169
APPLICATION OF FUNDS
Gross Block
308
486
602
1,147
1,340
Less: Acc. Depreciation
21
46
80
49
118
Net Block
287
440
522
1,099
1,222
Intangible assets
33
26
22
256
251
Biological assets
18
18
12
9
5
Capital Work in Progress
125
149
138
62
50
Other non current assets
172
164
238
289
265
Current Assets
580
779
820
1,409
1,422
Inventories
278
319
389
667
738
Sundry Debtors
182
226
269
455
522
Cash
21
114
13
31
54
Loans & Advances
78
86
100
149
34
Other Assets
20
34
49
107
75
Current liabilities
289
374
346
607
1,046
Net Current Assets
291
405
474
802
376
Total Assets
925
1,203
1,407
2,517
2,169
Source: DRHP, Angel Research
October 3, 2017
12
Godrej Agrovet| IPO Note
Cash Flow Statement
Y/E March (` cr)
FY13
FY14
FY15
FY16
FY17
Profit before tax
137
207
271
337
374
Depreciation
19
28
37
52
75
Change in Working Capital
(127)
(23)
(209)
(273)
442
Interest / Dividend (Net)
49
40
65
98
86
Direct taxes paid
(33)
(42)
(56)
(46)
(80)
Cash Flow from Operations
45
210
109
168
897
(Inc.)/ Dec. in Fixed Assets
(159)
(188)
(112)
(133)
(205)
(Inc.)/ Dec. in Investments
(8)
(3)
(19)
(295)
118
Cash Flow from Investing
(167)
(191)
(131)
(428)
(87)
Issue of Equity
103.1
(0.5)
-
0.2
0.8
Inc./(Dec.) in loans
71.8
145.0
68.6
474.8
(702.7)
Dividend Paid (Incl. Tax)
-
(29.4)
(82.6)
(54.1)
-
Interest / Dividend (Net)
(50.3)
(42.1)
(65.0)
(142.4)
(86.1)
Cash Flow from Financing
125
73
(79)
278
(788)
Inc./(Dec.) in Cash
2
92
(101)
19
22
Opening Cash balances
19
22
114
13
31
Closing Cash balances
21
114
13
31
54
Source: DRHP, Angel Research
October 3, 2017
13
Godrej Agrovet| IPO Note
Key Ratios
Y/E March
FY13
FY14
FY15
FY16
FY17
Valuation Ratio (x)
P/E (on FDEPS)
88.1
54.5
49.1
51.2
33.5
P/CEPS
73.4
46.3
34.5
27.2
24.4
P/BV
20.6
16.4
13.3
10.9
8.4
Dividend yield (%)
0.0
0.3
0.8
0.5
0.0
EV/Sales
3.4
3.0
2.9
2.7
1.9
EV/EBITDA
47.7
38.7
31.1
34.0
21.5
EV / Total Assets
7.6
5.9
5.4
3.2
2.9
Per Share Data (`)
EPS (Basic)
5.2
8.4
9.4
9.0
13.7
EPS (fully diluted)
5.2
8.4
9.4
9.0
13.7
Cash EPS
6.3
9.9
13.3
16.9
18.8
DPS
0.0
1.4
3.8
2.4
0.0
Book Value
22.3
28.0
34.6
42.3
54.5
Returns (%)
ROCE
19.7
18.8
20.3
11.8
21.8
Angel ROIC (Pre-tax)
24.1
24.6
23.1
14.2
27.6
ROE
23.4
30.2
32.8
33.3
27.2
Turnover ratios (x)
Asset Turnover (Gross Block)
9.0
6.4
5.5
3.3
3.7
Inventory / Sales (days)
37
38
43
65
55
Receivables (days)
24
27
30
44
39
Payables (days)
24
27
24
33
62
Working capital cycle (ex-cash) (days)
37
37
49
76
31
Solvency ratios (x)
Net debt to equity
1.1
1.0
1.0
1.6
0.6
Net debt to EBITDA
2.3
2.1
2.2
4.2
1.4
Interest Coverage (EBIT / Interest)
3.6
5.3
4.1
2.5
4.2
Source: DRHP, Angel Research
October 3, 2017
14
Godrej Agrovet| IPO Note
Research Team Tel: 022 - 39357800
DISCLAIMER
Angel Broking Private Limited (hereinafter referred to as “Angel”) is a registered Member of National Stock Exchange of India Limited,
Bombay Stock Exchange Limited and Metropolitan Stock Exchange Limited. It is also registered as a Depository Participant with CDSL
and Portfolio Manager and investment advisor with SEBI. It also has registration with AMFI as a Mutual Fund Distributor. Angel Broking
Private Limited is a registered entity with SEBI for Research Analyst in terms of SEBI (Research Analyst) Regulations, 2014 vide
registration number INH000000164. Angel or its associates has not been debarred/ suspended by SEBI or any other regulatory
authority for accessing /dealing in securities Market. Angel or its associates/analyst has not received any compensation / managed or
co-managed public offering of securities of the company covered by Analyst during the past twelve months.
This document is solely for the personal information of the recipient, and must not be singularly used as the basis of any investment
decision. Nothing in this document should be construed as investment or financial advice. Each recipient of this document should
make such investigations as they deem necessary to arrive at an independent evaluation of an investment in the securities of the
companies referred to in this document (including the merits and risks involved), and should consult their own advisors to determine
the merits and risks of such an investment.
Reports based on technical and derivative analysis center on studying charts of a stock's price movement, outstanding positions and
trading volume, as opposed to focusing on a company's fundamentals and, as such, may not match with a report on a company's
fundamentals. Investors are advised to refer the Fundamental and Technical Research Reports available on our website to evaluate the
contrary view, if any.
The information in this document has been printed on the basis of publicly available information, internal data and other reliable
sources believed to be true, but we do not represent that it is accurate or complete and it should not be relied on as such, as this
document is for general guidance only. Angel Broking Pvt. Limited or any of its affiliates/ group companies shall not be in any way
responsible for any loss or damage that may arise to any person from any inadvertent error in the information contained in this report.
Angel Broking Pvt. Limited has not independently verified all the information contained within this document. Accordingly, we cannot
testify, nor make any representation or warranty, express or implied, to the accuracy, contents or data contained within this document.
While Angel Broking Pvt. Limited endeavors to update on a reasonable basis the information discussed in this material, there may be
regulatory, compliance, or other reasons that prevent us from doing so.
This document is being supplied to you solely for your information, and its contents, information or data may not be reproduced,
redistributed or passed on, directly or indirectly.
Neither Angel Broking Pvt. Limited, nor its directors, employees or affiliates shall be liable for any loss or damage that may arise from
or in connection with the use of this information.
October 3, 2017
15