IPO Note | NBFC
June 15, 2017
Central Depository Services Ltd
SUBSCRIBE
Issue Open: June 19, 2017
High entry barriers provide bright future
Issue Close: June 21, 2017
Central Depository Services Ltd (CDSL) is one of the two depositories operating in
India, which facilitate the holding of securities in electronic form and enable
Issue Details
securities to be processed by book entry. It was originally promoted by BSE, which
Face Value: `10
subsequently divested part of its stake to leading banks as its sponsors.
Depository services - Duopoly market with high entry barriers: The Indian
Present Eq. Paid up Capital: `104.5cr
depositories market is shared by two players i.e. CDSL and NSDL promoted by
O ffer for Sale: 3.52cr Shares
BSE and NSE. The business is highly regulated with entry barriers in place, and
hence, the market is likely to remain duopoly in nature. With little threat of new
Fresh issue: ` 0cr
entrants coming in the incremental business is to be shared by both CDSL &
NSDL and this makes the business model quite interesting.
Post Eq. Paid up Capital: `104.5cr
CDSL has wide base of revenue sources: CDSL has wide source of revenues, 35%
Issue size (amount): *`510cr -**524cr
from the annual issuer charges (which is recurring in nature) and 21% from
transactions having some correlation with volumes in the markets. Another 13%
comes from online data charges. As the capital markets have remained buoyant,
Price Band: `145-149
there has been an increasing trend of new listings, and thus, CDSL has generated
Lot Size: 100 shares and in multiple
11% of its revenues from the IPO/ Corporate action charges. Hence, broadly
thereafter
speaking, the revenue base of CDSL is quite diversified.
Post-issue implied mkt. cap: *`1,515cr
- **`1,557cr
Decent growth in number of demat accounts: The number of demat accounts of
CDSL has grown at a CAGR of 8.6% over FY2011-17 to 12.3 mn, compared to
Promoters holding Pre-Issue: 50.05%
5.1% for NSDL over the same period to 15.6 mn. While CDSL has an overall
Promoters holding Post-Issue: 24%
market share of 43% in the cumulative demat accounts, on the incremental
accounts opened, it had a market share of 59% in FY2017. With capital markets
*Calculated on lower price band
remaining buoyant, the growth in demat accounts is likely to remain strong.
** Calculated on upper price band
Revenue/PAT CAGR of 10%/12% over FY13-17, likely to sustain: Charges levied
Book Building
by CDSL to its clients like DPs are regulated by SEBI. However, a decent growth in
number of accounts has ensured revenue/PAT CAGR of 10%/ 12% over FY13-17.
QIBs
50% of issue
With markets remaining buoyant and increasing share of financial savings in
Non-Institutional
15% of issue
India, we expect the growth momentum to sustain going ahead as well.
Retail
35% of issue
Outlook & Valuation: CDSL has a unique business model with high entry barriers
coupled with decent growth prospects. The average ROE for the last six years has
been ~17%, which we believe will sustain going ahead as well. The incremental
Post Issue Shareholding Patter
capital required for doing business in this space is very minimal and this makes it
an interesting business model. At the issue price band of `145-149, the stock is
Promoters
24%
offered at 17.7x-18.2x its FY2017 EPS, which we believe is reasonably priced,
Others
76%
and hence, recommend SUBSRIBE to the issue.
Key Financials
Y/E March (` cr)
FY2013
FY2014
FY2015
FY2016
FY2017
Operating Income
90.7
88.9
105.3
122.9
146.0
% chg
(6)
(2)
18
17
19
Net profit
49.9
49.4
57.7
90.9
85.8
% chg
(10)
(1)
17
58
(6)
Siddhart Purohit
EPS (`)
4.8
4.7
5.5
8.7
8.2
+022 39357600, Extn: 6872
Book Value (`)
31.4
33.8
35.3
39.4
51.0
P/E
31.2
31.6
27.0
17.1
18.2
P/BV (x)
4.7
4.4
4.2
3.8
2.9
RoE (%)
Please refer to important disclosures at the end of this report
1
CDSL | IPO Note
Company background
Central Depository Services (India) Limited (CDSL) commenced depository business
in 1999. The depository system in India is `240cr market (FY2016) comprising of
two depositories CDSL & NSDL. As a security depository, CDSL facilitates holding
of securities in electronic form and enables security transactions, including off
market transfer and pledge to be processed by book entry. CDSL was initially
promoted by the BSE, which subsequently divested part of its stake to leading
Indian banks. As on 30th April, 2017 CDSL had 589 registered DPs as its clients
and 12.4 million investor accounts. It had a 59% market share of incremental BO
(Beneficiary Owners) accounts in FY2017 and the net BO accounts grew by
13.68% in FY2017. CDSL has connectivity with all the leading stock exchange of
India viz. BSE, NSE and Metropolitan Stock Exchange.
It offers services to a range of clients
(1) Depository participants (DP) and other capital market intermediaries:
offers dematerialization for a wide range of securities.
(2) Corporates: Offers facilities to issuers to credit securities to shareholders
or applicant’s demat account to give effect to a range of non cash
corporate events.
(3) Capital market intermediaries: Offers KYC services in respect of investors
in Indian capital markets to capital market intermediaries including
mutual funds.
(4) Insurance Companies: Offers facilities to allow holding of insurance
policies in electronic form to the policy holders of several insurance
companies.
(5) Others: Offers other online services such as e-voting, e-locker, National
Academy Depository, etc.
Scope and functions of a depository like CDSL
A depository facilitates holding of securities in the electronic form and
enables securities to be processed by book entry.
The Depository Participants (DP), who acts as an agent of the depository
offers depository services to investors.
According to SEBI guidelines, financial institutions, banks, custodians,
stock brokers are eligible to act as DPs.
The investor who is known as Beneficiary Owner (BO) has to open a
demat account through any DP for dematerialization of his holdings and
transferring securities.
The balances in the investor accounts recorded and maintained with CDSL
can be obtained through the DP.
The DP is required to provide the investors, at regular intervals, a
statement of account, which gives the details of the securities holdings and
transactions.
June 15, 2017
2
CDSL | IPO Note
Issue details
CDSL is offering 3.52cr equity shares of `10 each via book building route in price
band of `145-149/share, entirely comprising offer for sale by current BSE limited.
Exhibit 1: Pre and Post-IPO shareholding pattern
No. of shares (Pre-issue)
(%)
No. of shares (Post-issue)
(%)
Promoters
5,22,97,850
50.0%
2,50,80,000
24.0%
Others
5,22,02,150
50.0%
7,94,20,000
76.0%
Total
10,45,00,000
10,45,00,000
Source: RHP
Exhibit 2: Top 10 share holders (%)
BSE Ltd
50.1
State Bank Of India
9.6
HDFC Bank Ltd
7.2
Standard Charted Bank Ltd
7.2
Canara Bank
6.5
Bank Of India
5.6
Bank Of Baroda
5.1
LIC
4.2
Union Bank Of India
1.9
Bank Of Maharastra
1.9
Source: Company, Angel Research
Objects of the offer
The objects of the offer are to achieve the benefits of listing the Equity Shares
on NSE and for the sale of Equity Shares by the Selling Shareholders.
The Company expects that listing of the Equity Shares will enhance its visibility
and brand image and provide liquidity to its existing Shareholders.
June 15, 2017
3
CDSL | IPO Note
Investment rationale
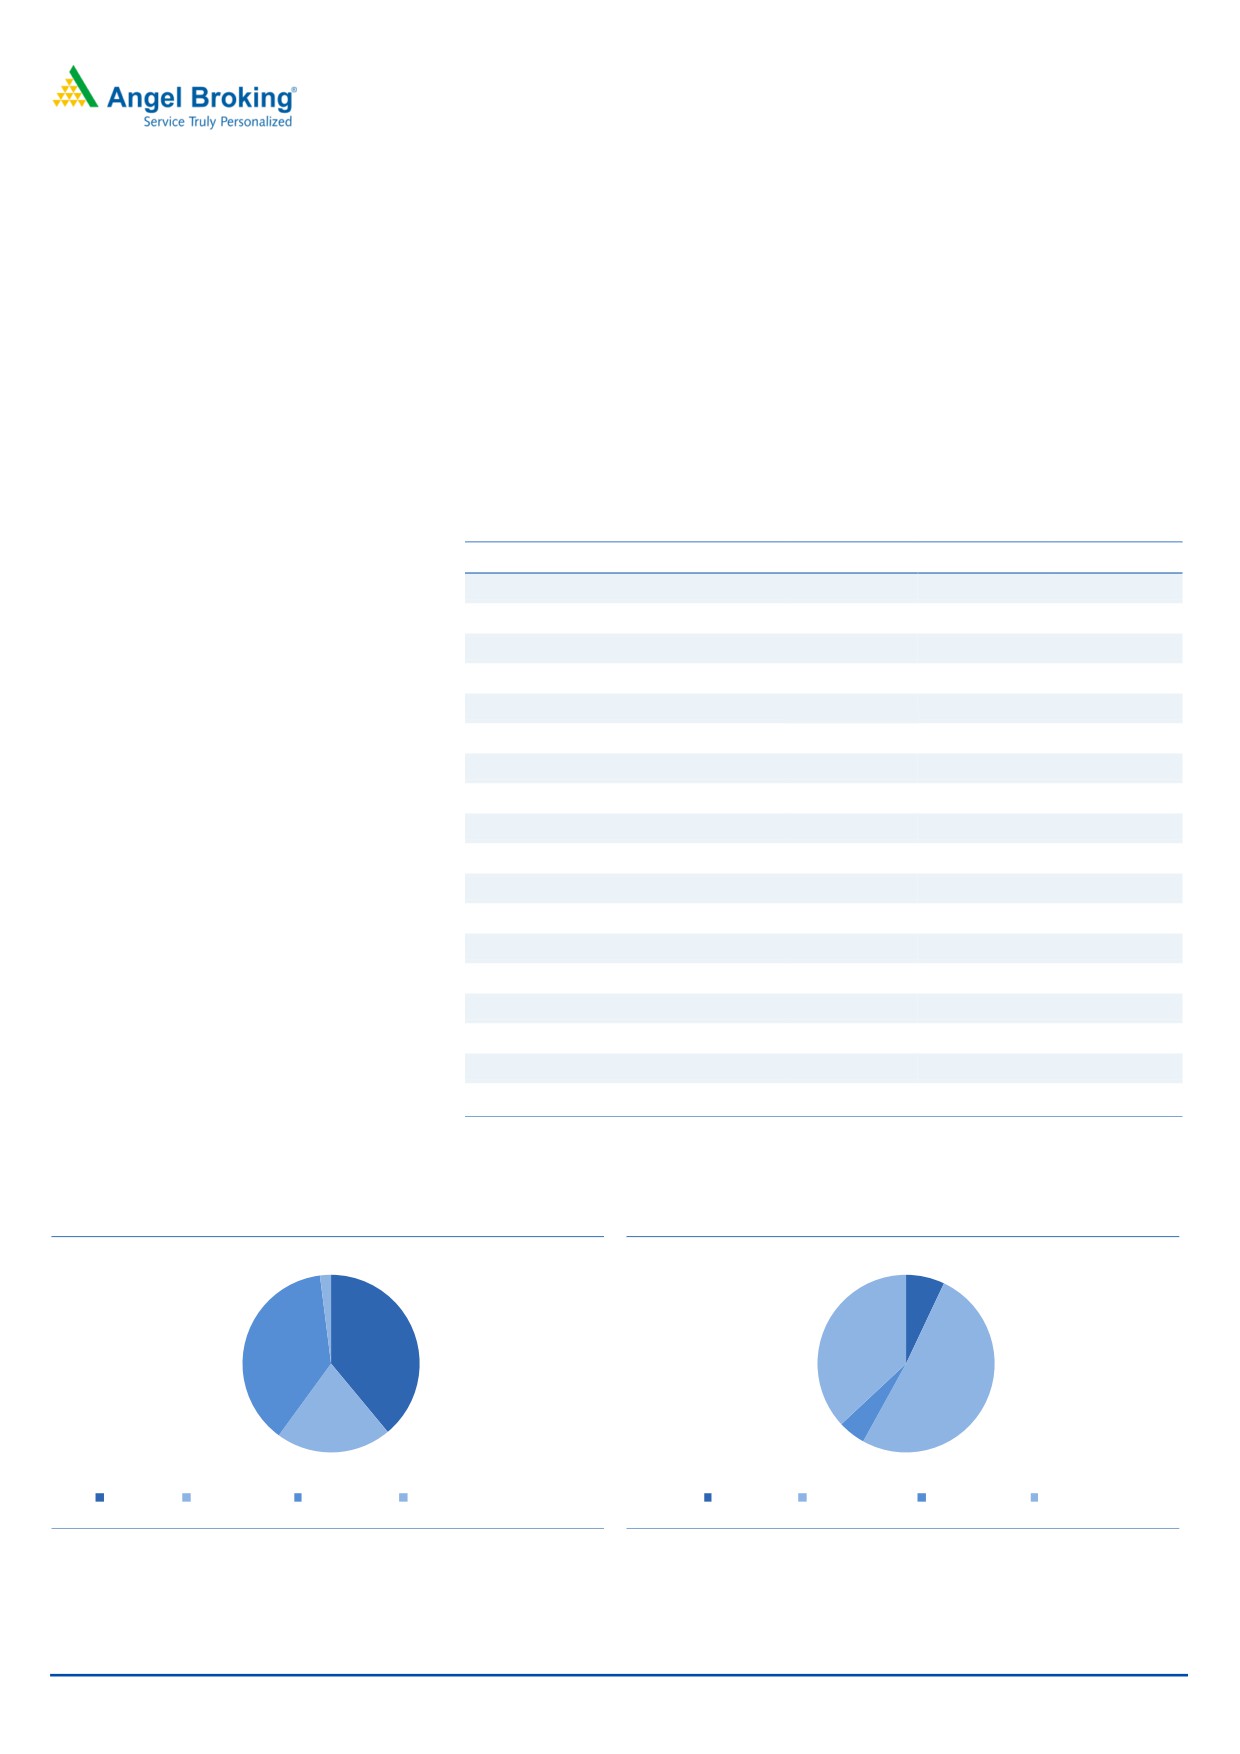
Wide source of revenues: CDSL has wide source of revenues at its privilege. Nearly
39% of the revenues come from the annual listing fees, which are steady in nature.
Further, 21% of the revenues come from the transaction charges, which it levies on
the DPs. While the transaction charges has co-relation with the markets and can
be volatile based on volume of transactions, the annual charges fees insulates the
company from any major volatility. On comparative basis, NSDL derives only 7%
of its revenues from the annual fees and 51% of the revenues from the transaction
charges. This lends higher revenue visibility for CDSL compared to NSDL.
Exhibit 3: Revenue Bifurcation of CDSL
Sources of revenues (` cr)
FY15
FY16
FY17
Annual Issuer Charges
36
48
52
Transaction Charges
28
26
31
Online data charges
15
15
19
IPO/ Corp action charges
6
11
17
ECAS Charges
2
8
Document storage charges
5
5
5
E-Voting charges
5
5
4
Others
11
11
11
Total
105.2
122.8
146.0
Annual Issuer Charges
34%
39%
35%
Transaction Charges
27%
21%
21%
Online data charges
14%
13%
13%
IPO/ Corp action charges
6%
9%
11%
ECAS Charges
0%
2%
5%
Document storage charges
5%
4%
4%
E-Voting charges
5%
4%
3%
Others
10%
9%
7%
Total
100%
100%
100%
Source: RHP
Exhibit 4: Sources of revenue CDSL
Exhibit 5: Sources of revenue NSDL
2%
7%
39%
37%
38%
51%
21%
5%
Annual fees Transaction fees Other Charges Annual maintenance charges
Annual fees
Transaction fees
Other Charges
Custody Fees
Source: RHP
Source: RHP
June 15, 2017
4
CDSL | IPO Note
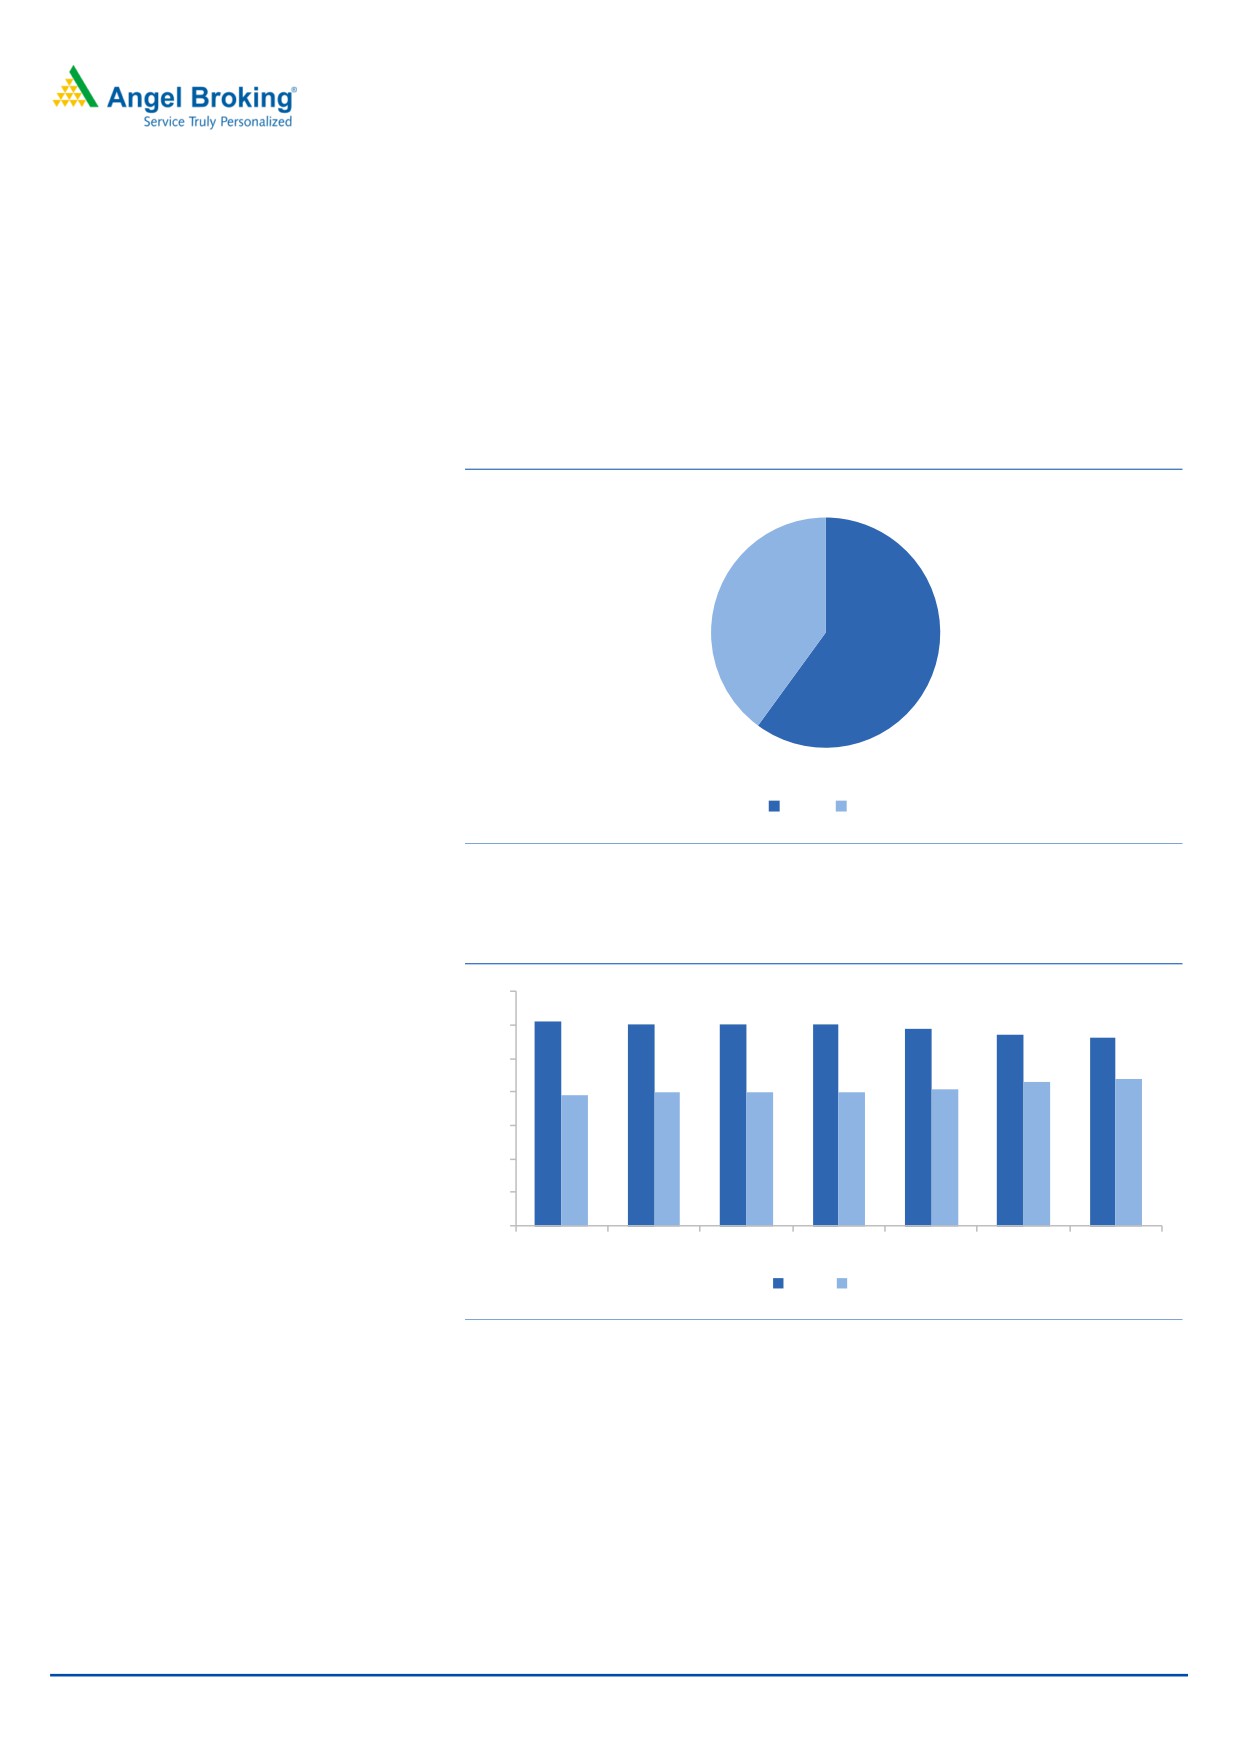
Depository services is a duopoly market with high entry barrier: In India there are
two depositories i.e. CDSL and NSDL promoted by the two leading stock
exchanges BSE and NSE, the operations of these depositories is highly regulated.
With strong entry barriers in place, the market is likely to remain duopoly in
nature, and hence, all the incremental business is to be shared by both CDSL &
NSDL. This makes the business model quite interesting. While CDSL has an overall
market share of 43% in the cumulative demat accounts, on the incremental demat
accounts opened, it had a market share of 59% in FY2017.
Exhibit 6: Incremental market share (%)
40
60
CDSL NSDL
Source: RHP
Exhibit 7: Market share trend (%) of CDSL & NSDL
70
61
60
60
60
59
57
56
60
50
44
43
39
40
40
40
41
40
30
20
10
0
FY11
FY12
FY13
FY14
FY15
FY16
FY17
NSDL CDSL
Source: RHP
June 15, 2017
5
CDSL | IPO Note
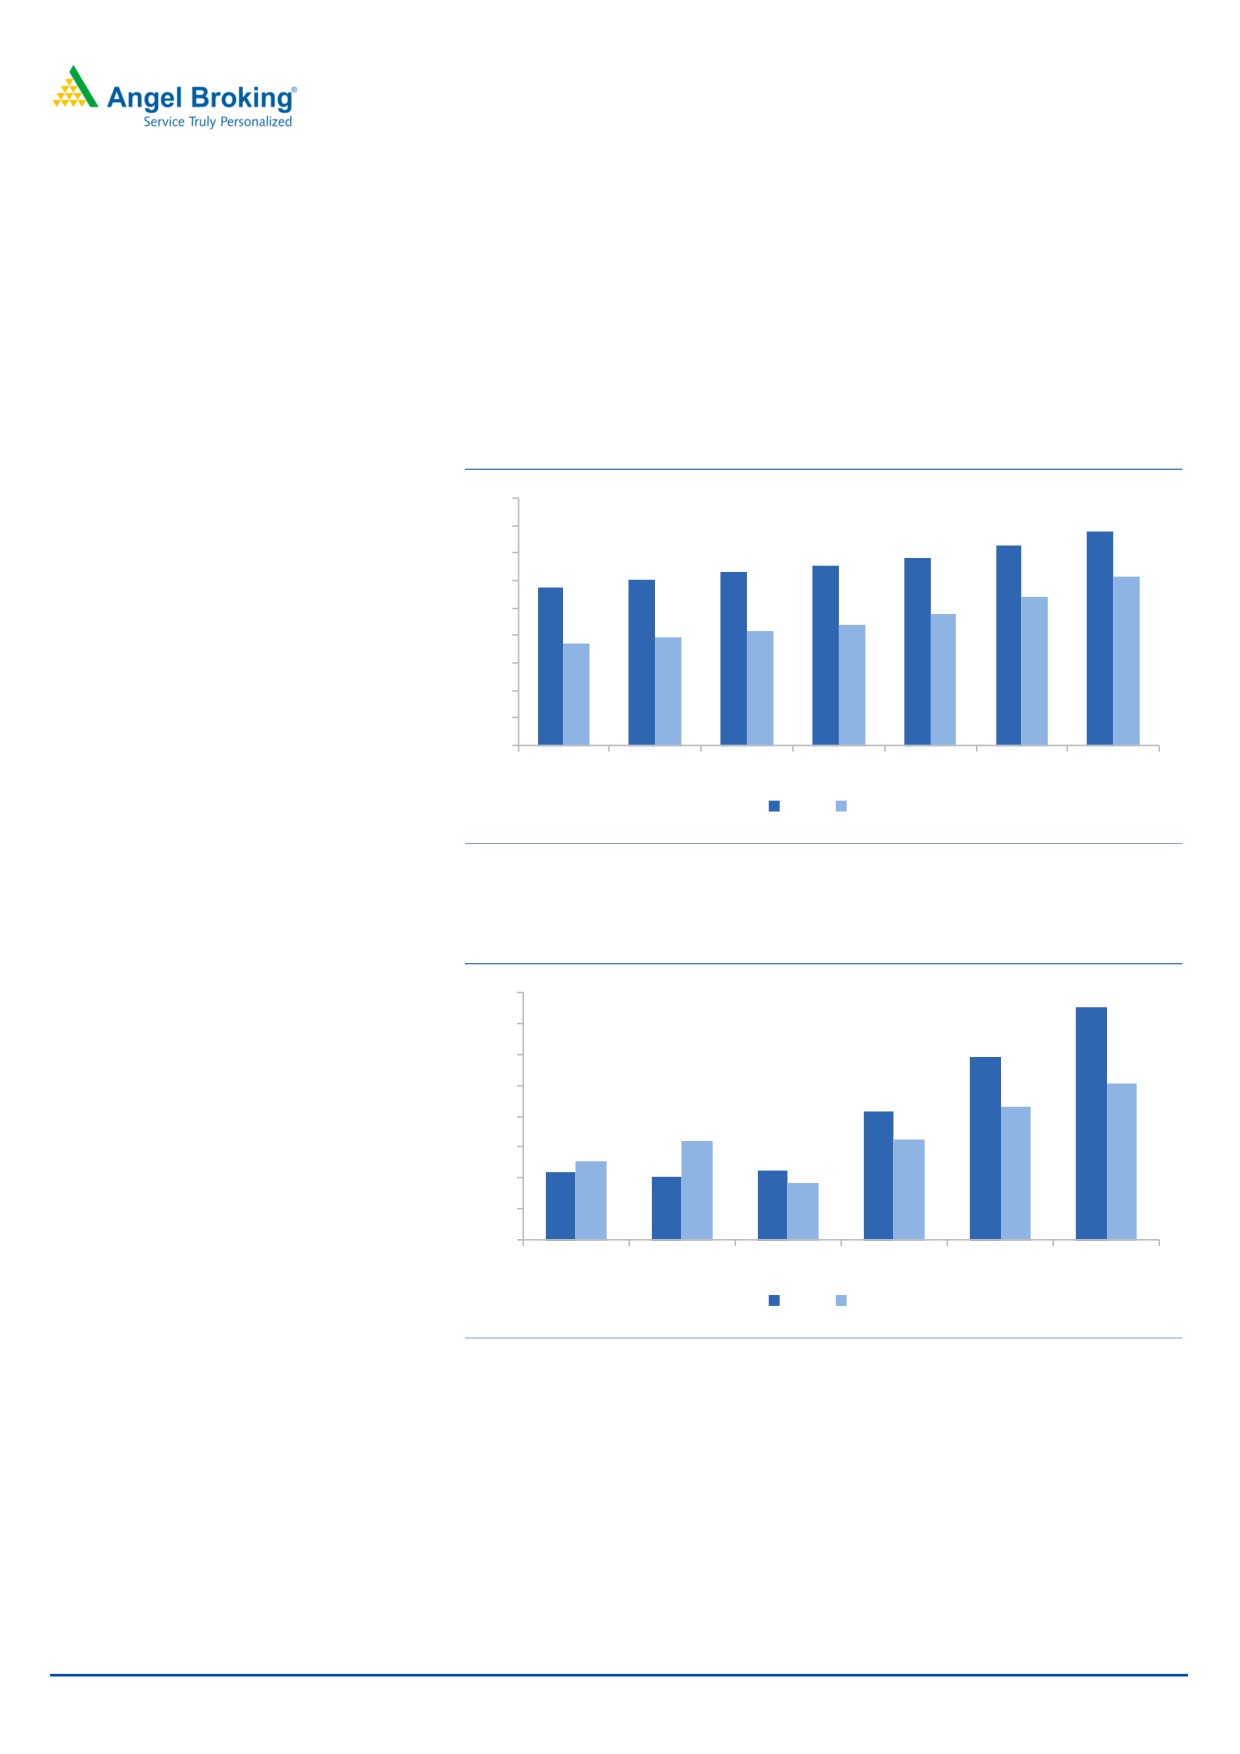
Decent growth in number of demat accounts: CDSL’s number of demat accounts
has grown at a CAGR of 8.6% over FY2011-17 to 12.3 mn, compared to 5.1% for
NSDL over the same period to 15.6 million. While CDSL has an overall market
share of 43% in the cumulative demat accounts, on the incremental demat
accounts opened, it had a market share of 59% in FY2017. The table below shows
that in the last four out of six years, CDSL had generated higher incremental
accounts compared to its competitors NSDL. With capital markets remaining
buoyant the growth in demat accounts is likely to remain strong going ahead.
Exhibit 8: Demat account growth trend ( millions)
18
15.58
16
14.57
13.71
14
12.68
13.05
12.04
12.3
11.54
12
10.79
9.61
10
8.78
8.33
7.92
7.48
8
6
4
2
0
FY11
FY12
FY13
FY14
FY15
FY16
FY17
NSDL CDSL
Source: RHP
Exhibit 9: Incremental demat accounts opened ( millions)
1.6
1.51
1.4
1.18
1.2
1.01
1
0.86
0.83
0.8
0.64
0.65
0.6
0.51
0.45
0.44
0.41
0.37
0.4
0.2
0
FY12
FY13
FY14
FY15
FY16
FY17
CDSL NSDL
Source: RHP
June 15, 2017
6
CDSL | IPO Note
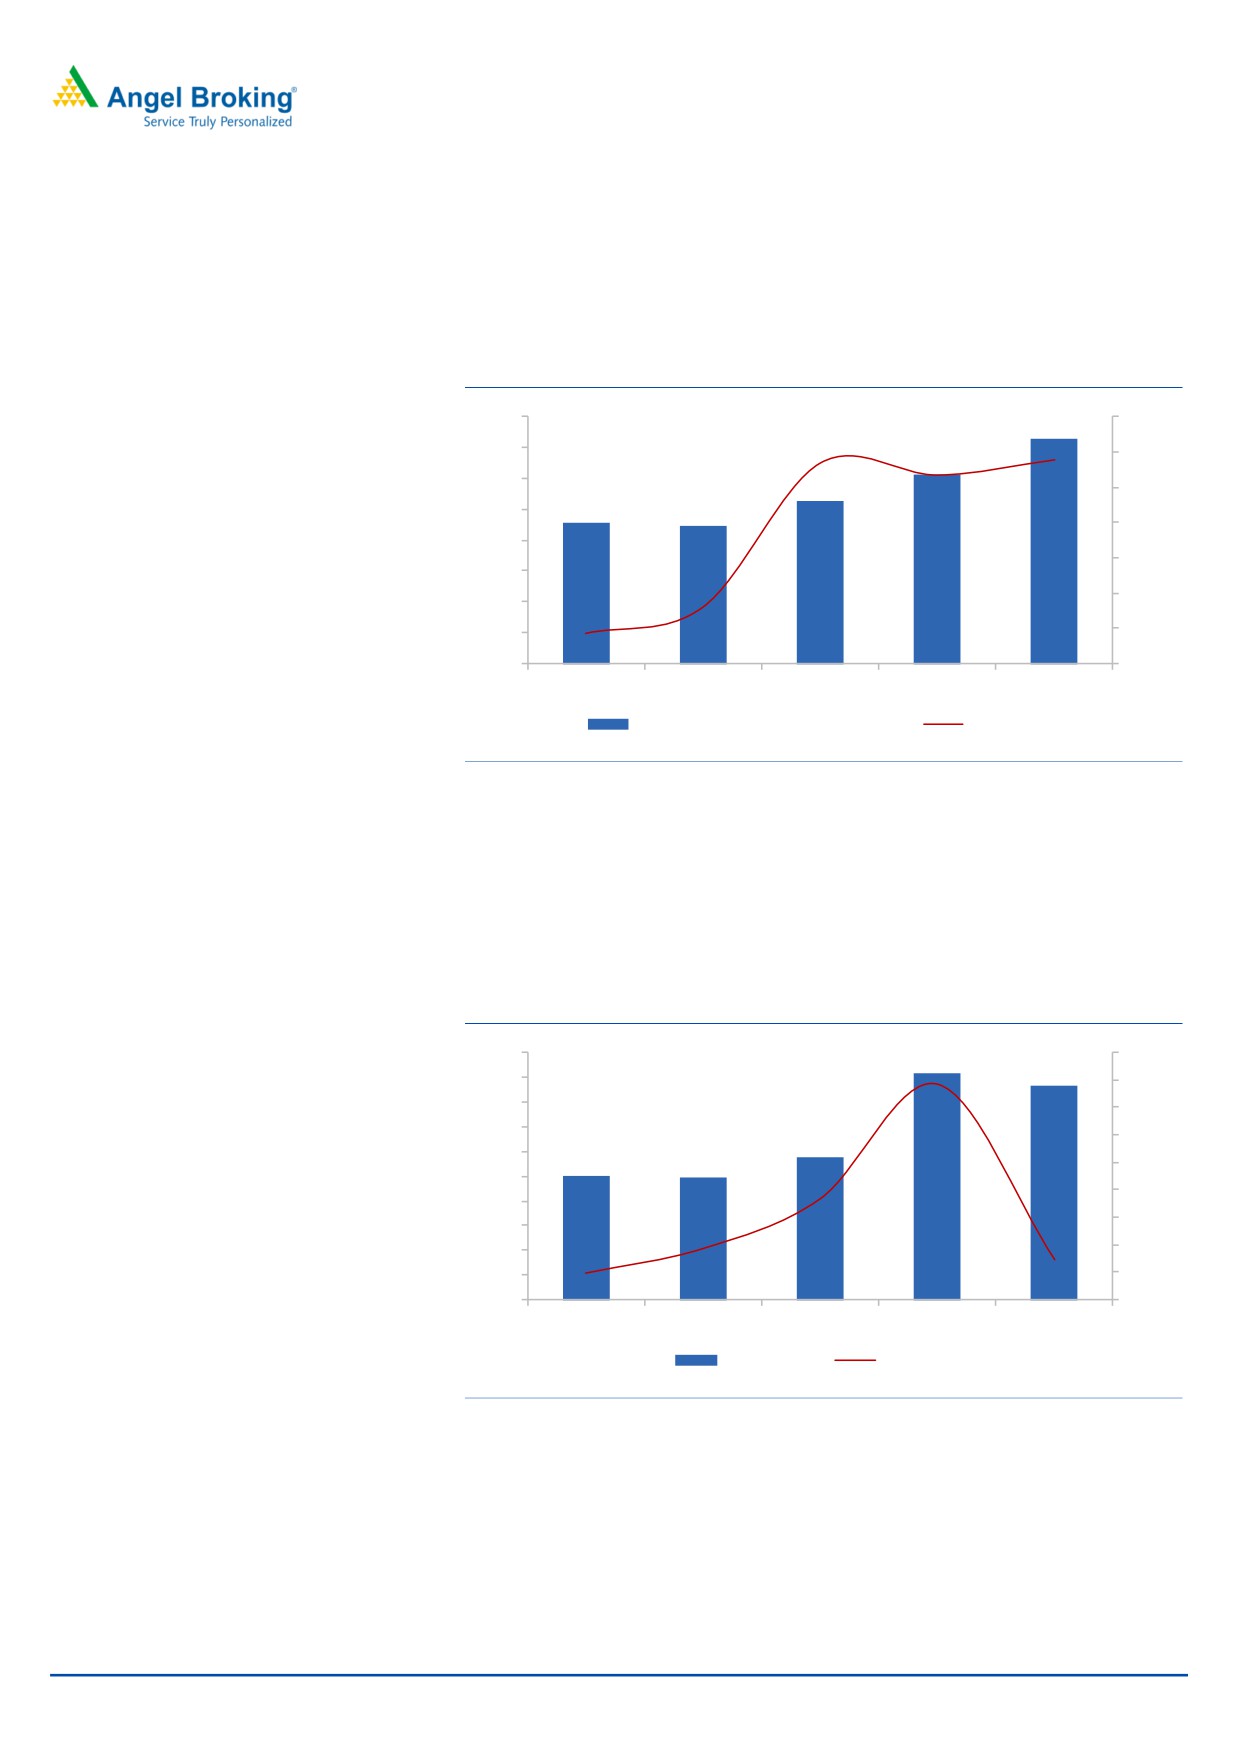
Revenue/PAT CAGR of 10%/12% over FY2013-17, likely to sustain over next few
years: The charges levied by CDSL to its clients like DPs are regulated by SEBI.
However, a decent growth in number of accounts has ensured revenue growth of
10% and PAT growth of 12% over FY2013-17. With markets remaining buoyant,
we expect the growth momentum to sustain going ahead as well
Exhibit 10: Revenue growth trend (` cr)
160
25.0
18.8
18.4
140
16.7
20.0
120
146
123
15.0
100
105
10.0
80
91
89
5.0
60
-2.0
0.0
40
-5.7
20
-5.0
0
-10.0
FY13
FY14
FY15
FY16
FY17
Revenues from Operations ( Rs Cr )
% Growth YoY
Source: Company, Angel Research
While ~21% of the company’s revenues is derived from the transaction charges
which is linked to market based trading volumes, a fairly large part i.e. 35% of the
revenues is derived from the annual issuer charges and 13% from the online data
charges, and hence, we believe that in addition to a decent growth in the revenue,
the company will be able to maintain stable margins.
Exhibit 11: PAT growth trend (` cr)
100
91
70.0
87
90
60.0
80
58.4
50.0
70
58
40.0
60
50
49
30.0
50
20.0
40
16.9
10.0
30
20
0.0
-1.2
-5.2
10
-10.0
-10.1
0
-20.0
FY13
FY14
FY15
FY16
FY17
PAT ( Rs Cr )
% Growth YoY
Source: RHP
June 15, 2017
7
CDSL | IPO Note
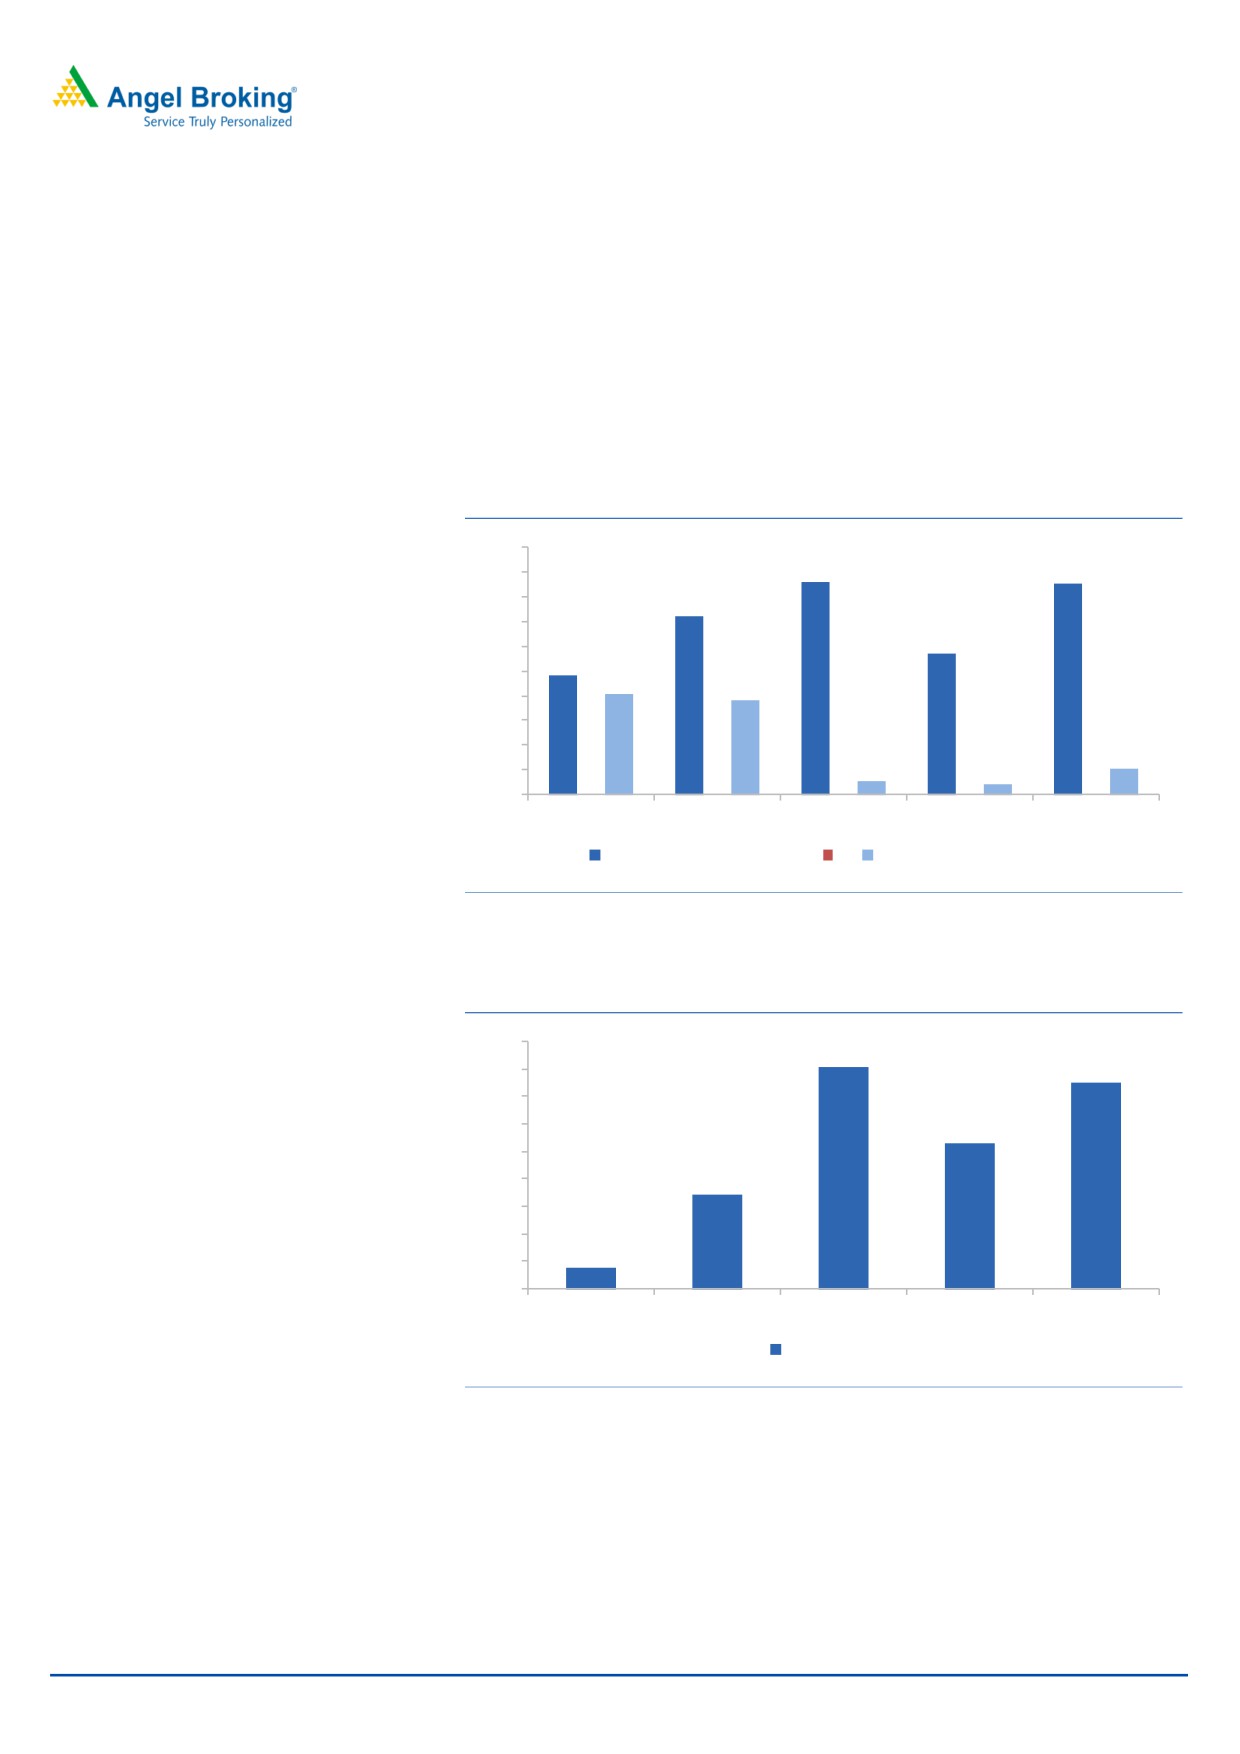
Strong free cash flow generation can be used for higher dividend payouts: The
working capital requirements are very minimal in case of CDSL due to its nature of
business, and hence, the cash flow operations have been healthy on a continuous
basis. Over FY2013-17 the cumulative cash flow from operations for CDSL was
`174 cr, while the investments in fixed assets were to the tune of `49 cr only. This
resulted in strong cumulative fresh cash flows of `125 cr over the last five years.
The average dividend payout of CDSL for the last five years is ~38% and with low
capital investment requirements going ahead, the company can very much
maintain the current dividend payout ratio.
Exhibit 12: Cash flow and Investments in fixed assets (` Cr)
50
43
43
45
40
36
35
28
30
24
25
20
19
20
15
10
5
3
2
5
-
FY13
FY14
FY15
FY16
FY17
Cash flow from operations
Investments In Fixed Assets
Source: RHP
Exhibit 13: Free Cash Flow Generations (` Cr)
45
40
40
37
35
30
26
25
20
17
15
10
4
5
-
FY13
FY14
FY15
FY16
FY17
Free cash flow
Source: RHP
June 15, 2017
8
CDSL | IPO Note
Outlook & Valuation
CDSL has a unique business model with high entry barriers coupled with decent
growth prospects. The average ROE for the last six years has been ~17%, which
we believe will sustain going ahead as well. The incremental capital required for
doing business in this space is very minimal and this makes it an interesting
business model. At the issue price band of `145-149, the stock is offered at
17. 7x-18.2x its FY2017 Earnings, which we believe is reasonably priced, and
hence, recommend SUBSRIBE to the issue.
Key Concerns:
CDSL operates in a highly regulated industry. The various charges levied
by CDSL to its users and clients are regulated by the market regulator
SEBI. Inability to increase the pricing when cost goes up can impact the
profitability.
A large proportion of the business is transaction related and dependent
on trading volume. Further, the business of the organization has direct
correlation with the level of delivery based volumes and price levels on
major stock exchanges. Hence, any declines in trading volume and
market liquidity could adversely affect the operations of the company.
June 15, 2017
9
CDSL | IPO Note
Exhibit 14: Income Statement
Income Statement (` cr)
FY13
FY14
FY15
FY16
FY17
Revenues from Operations
90.7
88.9
105.3
122.9
146.0
- YoY Growth (%)
(6)
(2)
18
17
19
Employee Expenses
17.2
17.5
19.2
21.5
24.9
- YoY Growth (%)
38
2
10
12
16
Other Expenses
37.9
38.8
39.8
36.3
41.5
- YoY Growth (%)
64
2
3
(9)
14
Total Expenses
55.0
56.2
59.0
57.8
66.4
- YoY Growth (%)
55
2
5
(2)
15
EBITDA
35.7
32.7
45.2
63.9
79.4
- YoY Growth (%)
(41)
(8)
38
41
24
Depreciation
2.6
5.0
6.2
4.2
3.7
- YoY Growth (%)
(35)
90
26
(33)
(12)
Other Income
33.3
33.9
40.2
38.5
40.8
- YoY Growth (%)
36
2
19
(4)
6
Profit Before Tax
66.4
61.6
79.1
98.2
116.6
- YoY Growth (%)
(18)
(7)
28
24
19
Exceptional Items
0.0
0.0
1.7
33.1
0.0
PBT After Exceptional Item
66.4
61.6
80.8
131.3
116.6
Prov. for Taxation
15.4
12.7
23.3
40.2
30.0
- as a % of PBT
23.2
20.5
28.9
30.6
25.7
PAT
49.9
49.4
57.7
91.3
86.6
- YoY Growth (%)
(10)
(1)
17
58
(5)
Source: RHP
June 15, 2017
10
CDSL | IPO Note
Exhibit 15: Balance Sheet
Y/E March (` cr)
FY13
FY14
FY15
FY16
FY17
Share Capital
105
105
105
105
105
Reserve & Surplus
224
249
312
375
429
Net Worth
329
353
416
479
533
Minority Interest
12.4
13.6
14.6
14.7
15.5
Other Long Term Liabilities
21.6
21.8
22.9
22.9
23.2
Total Current Liabilities
54.2
67.0
56.6
32.6
33.9
Total Non Current Liabilities
0.0
0.0
1.4
3.4
1.4
Total Liabilities
417
456
511
553
607
Total Fixed Assets
9.8
9.8
6.7
3.7
5.5
Total Non Current Assets
42
62
259
240
298
Investments
316
331
191
247
230
Trade Receivables, Loans & advances & other CA
13.4
11.9
8.8
15.2
15.8
Cash & Cash equivalents
35.3
41.0
43.1
40.4
48.3
Other Current Assets
0.0
0.0
3.3
6.5
9.7
Total Assets
417
456
511
553
607
Source: RHP
June 15, 2017
11
CDSL | IPO Note
Exhibit 16: Key Ratios
FY13
FY14
FY15
FY16
FY17
Per Share Data ( ` )
EPS
4.8
4.7
5.5
8.7
8.2
BVPS
31.4
33.8
35.3
39.4
51.0
DPS
2.0
2.0
2.2
2.5
3.0
Valuation Ratios
P/E
31.2
31.6
27.0
17.1
18.2
P/BV
4.7
4.4
4.2
3.8
2.9
EV/ EBITDA
33.7
36.2
29.1
20.1
16.1
EV/Sales
13.3
13.3
12.5
10.5
8.8
Dividend Yield (%)
1.3
1.3
1.5
1.7
2.0
Profitability Ratios
ROE %
15.2
14.0
15.6
22.1
16.1
ROIC %
0.0
0.0
19.8
28.9
28.0
EBITDA %
39.4
36.8
42.9
52.0
54.4
PAT %
55.0
55.5
54.8
74.0
58.8
Source: RHP
June 15, 2017
12
CDSL | IPO Note
Research Team Tel: 022 - 39357800
DISCLAIMER
Angel Broking Private Limited (hereinafter referred to as “Angel”) is a registered Member of National Stock Exchange of India Limited,
Bombay Stock Exchange Limited and Metropolitan Stock Exchange Limited. It is also registered as a Depository Participant with CDSL
and Portfolio Manager with SEBI. It also has registration with AMFI as a Mutual Fund Distributor. Angel Broking Private Limited is a
registered entity with SEBI for Research Analyst in terms of SEBI (Research Analyst) Regulations, 2014 vide registration number
INH000000164. Angel or its associates has not been debarred/ suspended by SEBI or any other regulatory authority for accessing
/dealing in securities Market. Angel or its associates/analyst has not received any compensation / managed or co-managed public
offering of securities of the company covered by Analyst during the past twelve months.
This document is solely for the personal information of the recipient, and must not be singularly used as the basis of any investment
decision. Nothing in this document should be construed as investment or financial advice. Each recipient of this document should
make such investigations as they deem necessary to arrive at an independent evaluation of an investment in the securities of the
companies referred to in this document (including the merits and risks involved), and should consult their own advisors to determine
the merits and risks of such an investment.
Reports based on technical and derivative analysis center on studying charts of a stock's price movement, outstanding positions and
trading volume, as opposed to focusing on a company's fundamentals and, as such, may not match with a report on a company's
fundamentals. Investors are advised to refer the Fundamental and Technical Research Reports available on our website to evaluate the
contrary view, if any.
The information in this document has been printed on the basis of publicly available information, internal data and other reliable
sources believed to be true, but we do not represent that it is accurate or complete and it should not be relied on as such, as this
document is for general guidance only. Angel Broking Pvt. Limited or any of its affiliates/ group companies shall not be in any way
responsible for any loss or damage that may arise to any person from any inadvertent error in the information contained in this report.
Angel Broking Pvt. Limited has not independently verified all the information contained within this document. Accordingly, we cannot
testify, nor make any representation or warranty, express or implied, to the accuracy, contents or data contained within this document.
While Angel Broking Pvt. Limited endeavors to update on a reasonable basis the information discussed in this material, there may be
regulatory, compliance, or other reasons that prevent us from doing so.
This document is being supplied to you solely for your information, and its contents, information or data may not be reproduced,
redistributed or passed on, directly or indirectly.
Neither Angel Broking Pvt. Limited, nor its directors, employees or affiliates shall be liable for any loss or damage that may arise from
or in connection with the use of this information.
June 15, 2017
13