Angel Top Picks - July 2019
Top Picks
Indian stock market closed in the red for the first time in four months. BSE 100
Company
CMP (`)
TP (`)
index was down by 1.2% for the month of May while returns for the calander year
Banking/NBFC
2019 is 6.7%. Our top picks have generated a total return of 60.2% since
Aditya Birla Capital
92
130
inception, an outperformance of 14.9% over BSE100.
ICICI Bank
437
490
Profit booking post election results - Major indices like the Sensex and Nifty 50
HDFC Bank
2,495
2,660
hit all-time highs by the first week of Jun’19 on the back of better than
RBL Bank
653
775
expected outcome of the general elections as the ruling NDA Government
Shriram Transport Finance
1,068
1,470
returned to power with an even bigger majority than 2014. However post the
Consumption
initial euphoria all indices came under pressure as traders used the rally to
Amber Enterprises
828
910
book profits. FII flows too slowed down to ` 2273 cr. in Jun’19 as compared
Bata India
1,459
1,643
to INR 7920 cr. in May’19 and a peak of ` 33,980 cr. in Mar’19. FII flows for
Blue Star
769
867
calendar year 2019 stands at ` 71,352 cr.
Safari Industries
663
1,000
RBI cuts rate for the third time in 2019 to counter economic slowdown - Tight
Parag Milk Foods
261
330
fiscal and monetary policy over the past few years coupled with major
TTK Prestige
6,664
7,708
structural changes have taken a toll on growth which was further exacerbated
Media/Automobiles
post the IL&FS crisis and its fallout. In order to stimulate growth the RBI in it’s
Maruti Suzuki
6,559
8,552
third bi monthly meeting for CY19 announced a 25bps rate cut in the
M&M
667
1,050
benchmark repo rate to 5.75%. Given very low inflation of ~3% we expect at
Real Estate/Infra/Logistics/Power
least another 50bps rate cuts by the RBI over the next 6-9 months.
GMM Pfaudler
1,363
1,570
Jindal Steel
141
250
Monsoon and US-China trade war are key risks - Monsoon has been delayed
this year due to formation of El Nino over the Pacific Ocean. As of the 4th of
KEI Industries
477
612
July monsoon is deficient by 27% which is a major source of concern. However
Pharmaceutical
of late the monsoon has revived, and is expected to strengthen further which
Aurobindo Laboratories
611
890
bodes well for the rural economy. While the trade war between US and China
Source: Angel Research;
Note: CMP as of 02 July, 2019
has already taken a toll on global growth any further escalation could further
hurt global growth and is a risk to the Indian economy as well. However any
US China trade deal would be positive for both global and Indian economy.
Union Budget to be key event in first week of July - The final Union Budget for
2019-20 assumes great importance given shortfall in tax revenues in FY19.
We expect that the Government will resist cutting back on expenditure and try
and stimulate the economy by providing tax breaks to middle class which
would boost consumption. We expect fiscal slippage in FY20 unless there is a
transfer of at least some of RBI’s surplus reserves to the Government.
Top pick’s overview
We recommend our top picks as it has outperformed the benchmark BSE 100
significantly since inception. All of our top picks are backed by sound business
model and are likely to do well in coming years. We continue to remain
positive on consumer (both discretionary and non discretionary) space and
private sector banks (both corporate and retail).
Exhibit 1: Top Picks Performance
Return Since Inception (30th Oct, 2015)
Top Picks Return
60.2%
BSE 100
45.3%
Outperformance
14.9%
Source: Company, Angel Research
Please refer to important disclosures at the end of this report
1
Angel Top Picks | July 2019
Top Picks
July 4, 2019
2
Angel Top Picks | July 2019
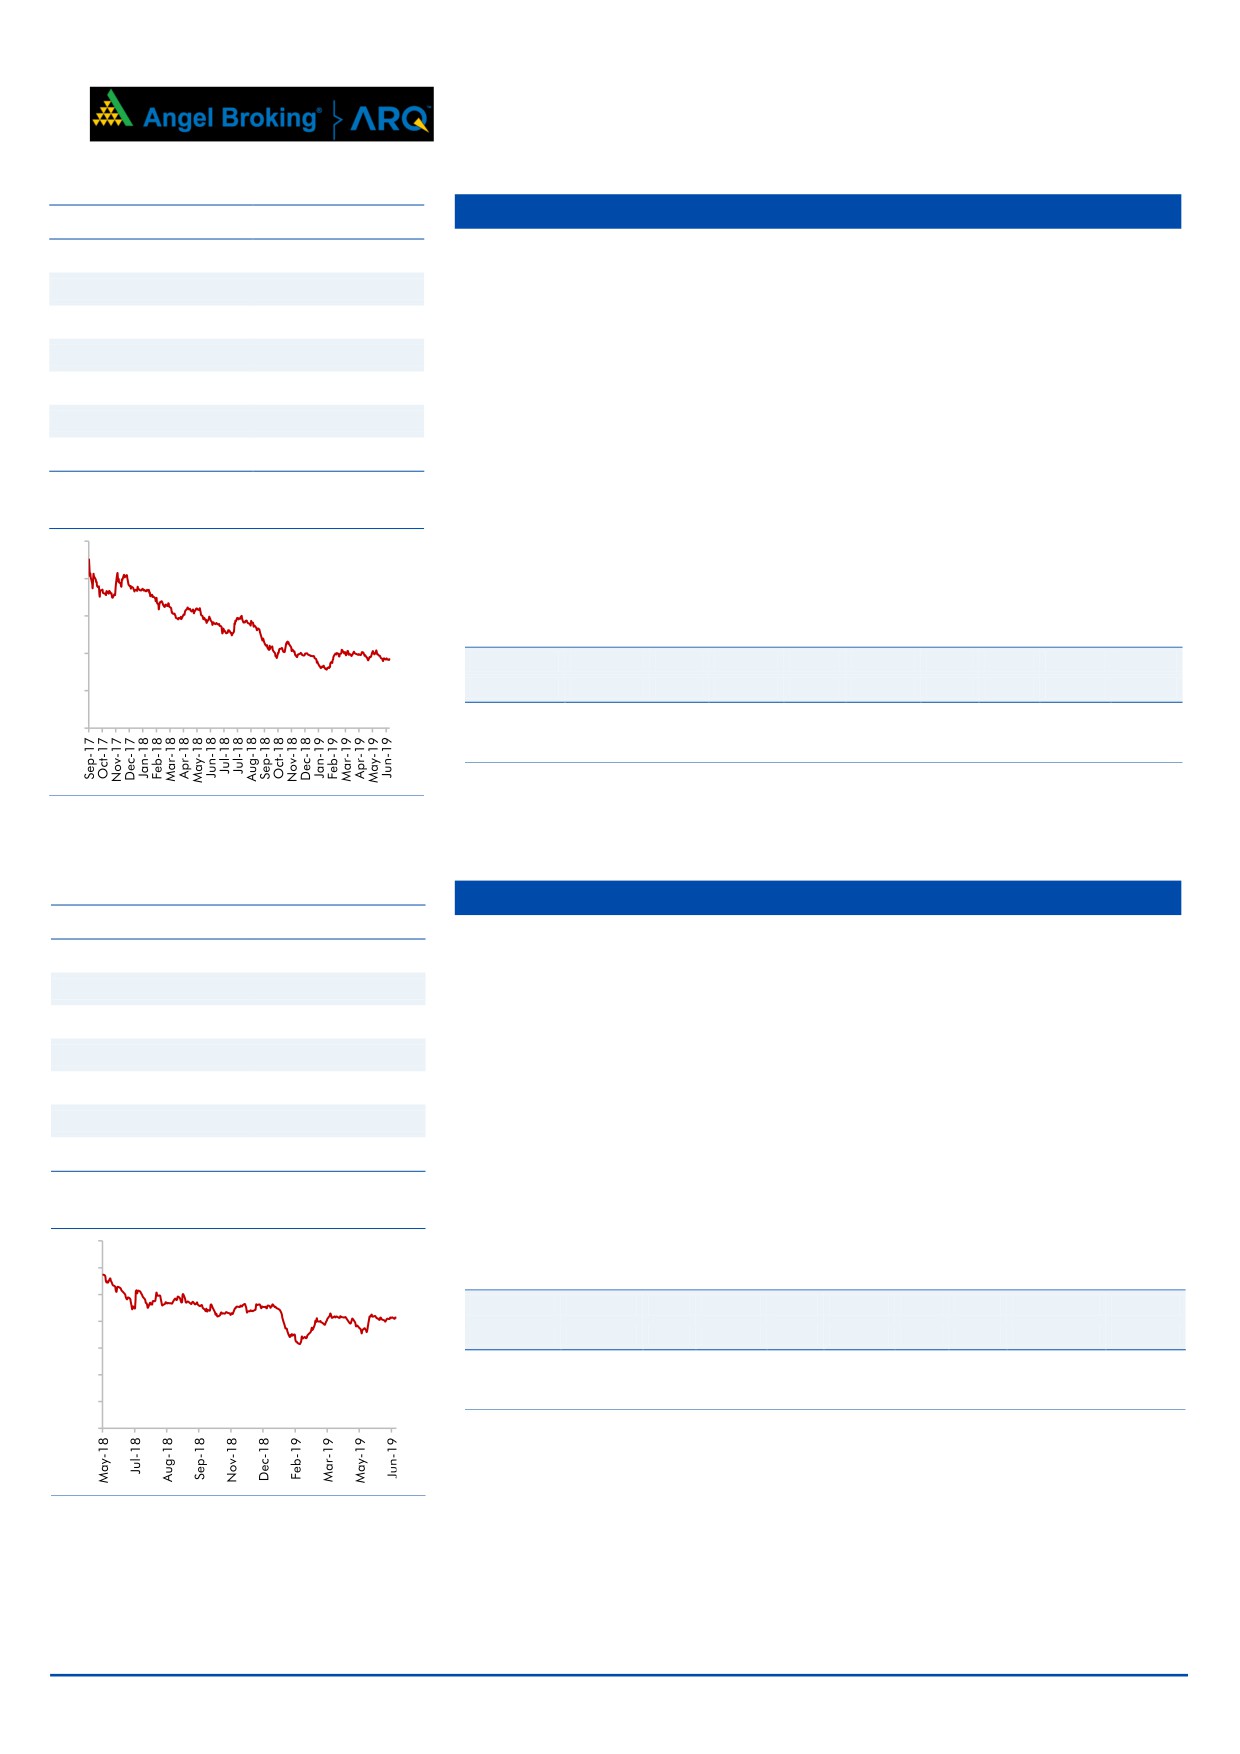
Aditya Birla Capital
Stock Info
CMP
92
Aditya Birla Capital (ABCL) is one of the most diversified financial services
TP
130
entities, with a presence in non-bank financing, asset management, housing
Upside
41.3%
finance, insurance and advisory businesses.
Sector
Financials
ABFL (NBFC) business contributes highest value in our SOTP valuation. It has
Market Cap (` cr)
20,341
recorded a strong CAGR of 32% over FY14-19. Despite aggressive growth in
Beta
1.6
lending and migration to 90dpd for NPA recognition, GNPA has remained at
~1%. Banka Tie up with HDFC bank has gaining traction which is visible in
52 Week High / Low
152/78
improvement in VNB margin (FY18-4.5%, FY19-9.5%) and new business
premium.
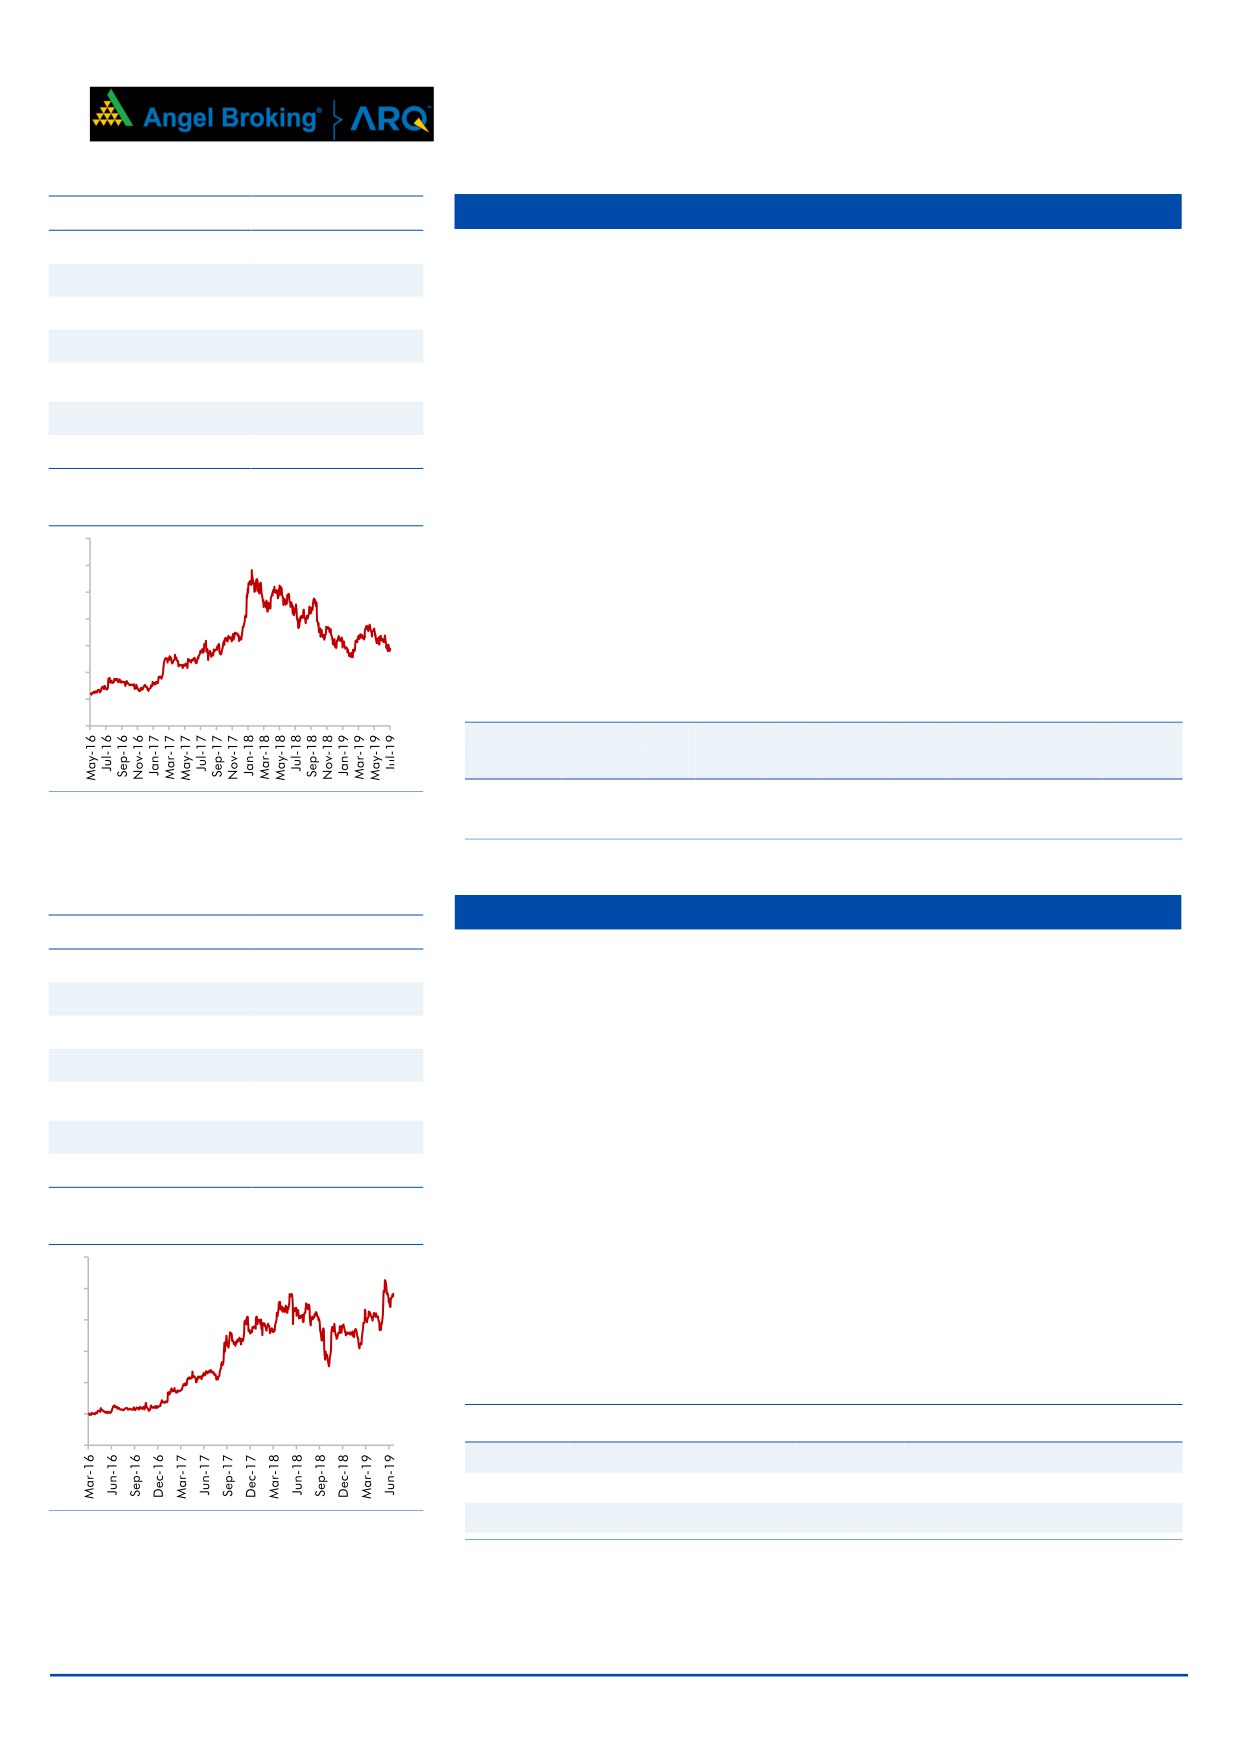
2 year-Chart
We expect financialization of savings, increasing penetration in Insurance &
250
Mutual funds would ensure steady growth. Further, Banca tie-up with HDFC
200
Bank, DBS and LVB should restore insurance business.
150
Key Financials
100
Y/E
Op. Inc
PAT
EPS
ABV
ROE
P/E
P/ABV
Op. Inc
PAT
50
March
(` cr)
(` cr)
(`)
(`)
(%)
(x)
(x)
(` cr)
(` cr)
FY2020E
2,368
1,281
5.8
49.1
12
16
1.9
2,368
1,281
-
FY2021E
3,032
1,699
7.7
56.8
14
12
1.6
3,032
1,699
Source: Company, Angel Research
Source: Company, Angel Research
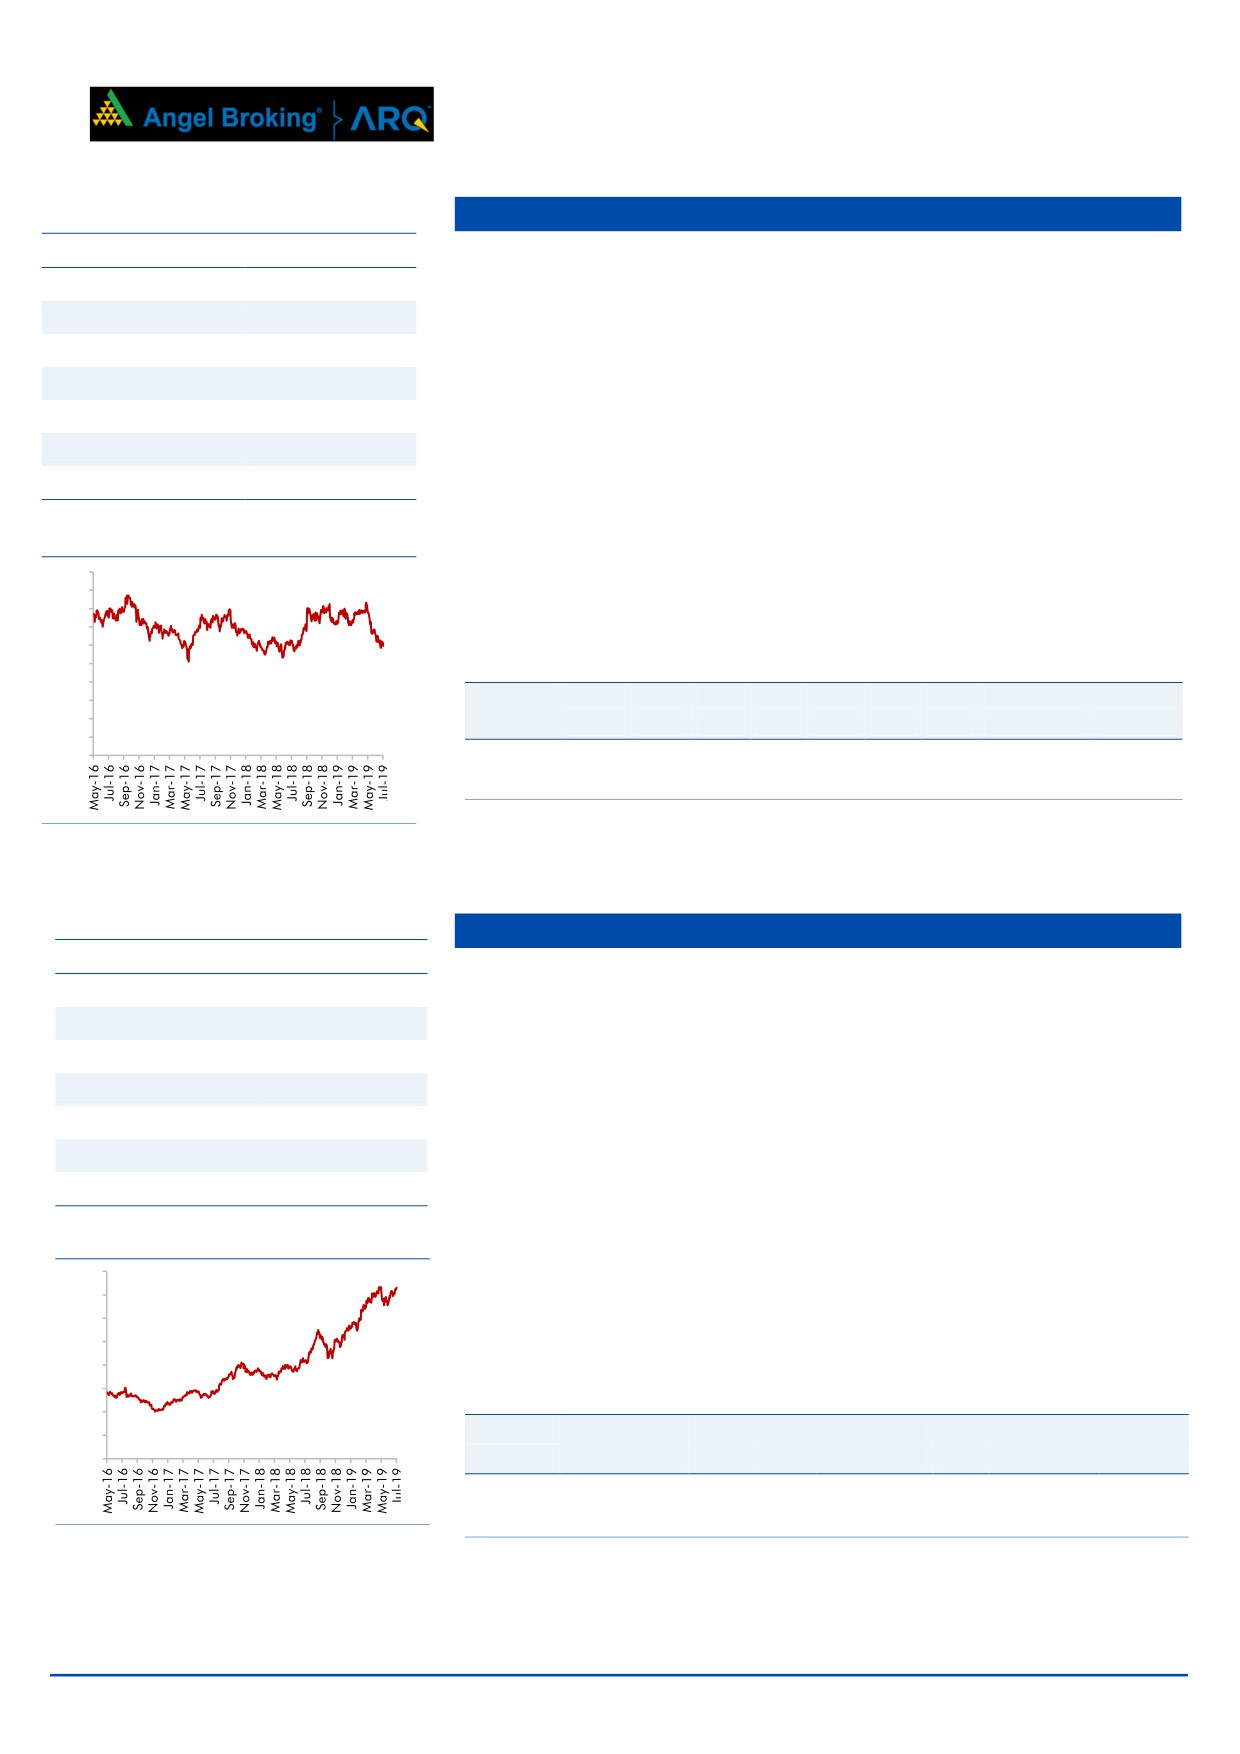
Amber Enterpries
Stock Info
Amber Enterprises India Ltd. (Amber) is the market leader in the room air
CMP
828
conditioners (RAC) outsourced manufacturing space in India. It is a one-stop
TP
910
solutions provider for the major brands in the RAC industry and currently
Upside
10.0%
serves eight out of the ten top RAC brands in India.
Sector
Electronics
In line with its strategy to capture more wallet share, it has made 2 acquisitions
Market Cap (` cr)
2,593
in the printed circuit board (PCB) manufacturing space over the last 1 year
which will boost its manufacturing capabilities.
Beta
0.9
We expect Amber to report consolidated revenue/PAT CAGR of 23%/41%
52 Week High / Low
1,121/621
respectively over FY2018-20E. Its growing manufacturing capabilities and
scale put it in a sweet spot to capture the underpenetrated RAC market in
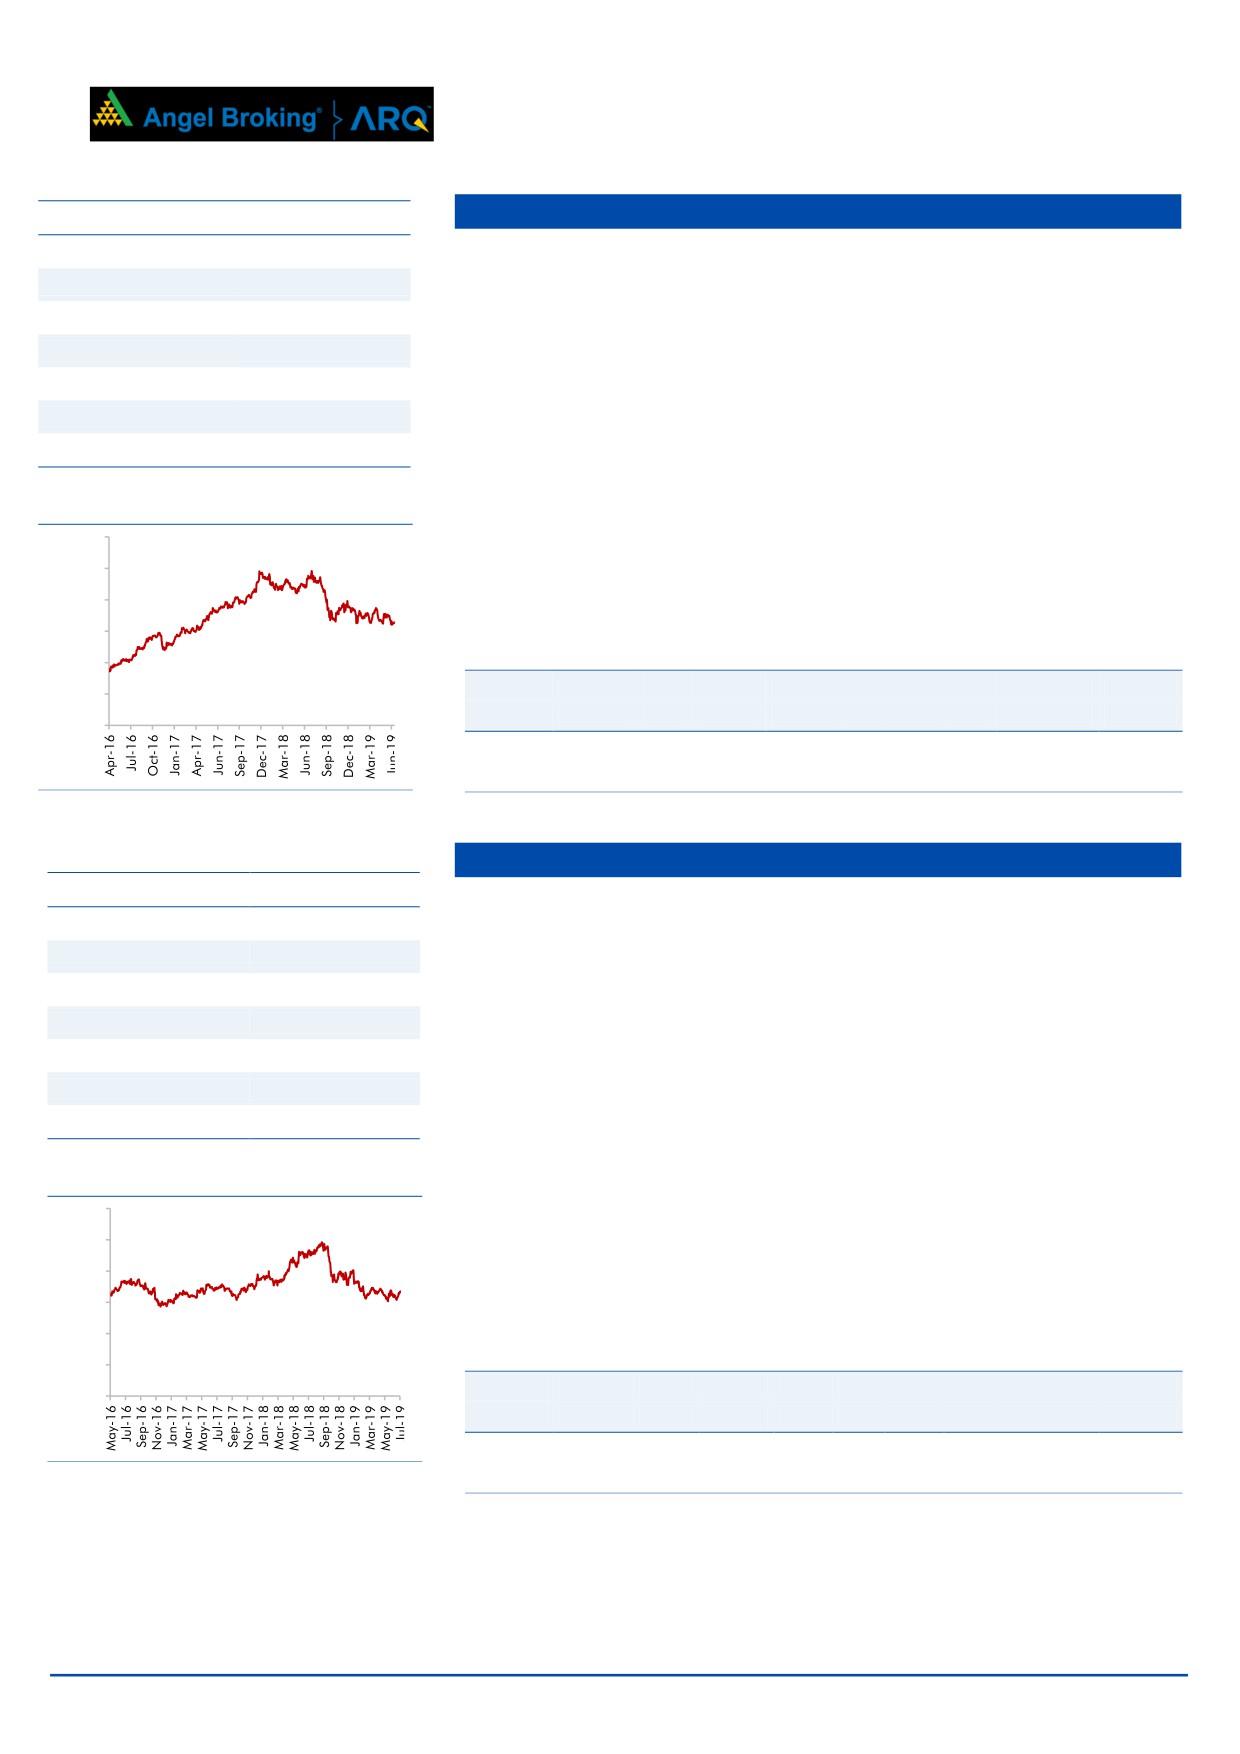
1 year-Chart
India.
1,400
1,200
Key Financials
1,000
Y/E
Sales
OPM
PAT
EPS
ROE
P/E
P/BV
EV/EBITDA
EV/Sales
800
March
(` cr)
(%)
(` cr)
(`)
(%)
(x)
(x)
(x)
(x)
600
FY2019
2,752
8.1
93.6
29.7
9.8
27.9
2.6
12.5
1.0
400
200
FY2020E
3125
7.5
114.4
36.4
10.7
22.7
1.9
8.2
0.6
-
Source: Company, Angel Research
Source: Company, Angel Research
July 4, 2019
3
Angel Top Picks | July 2019
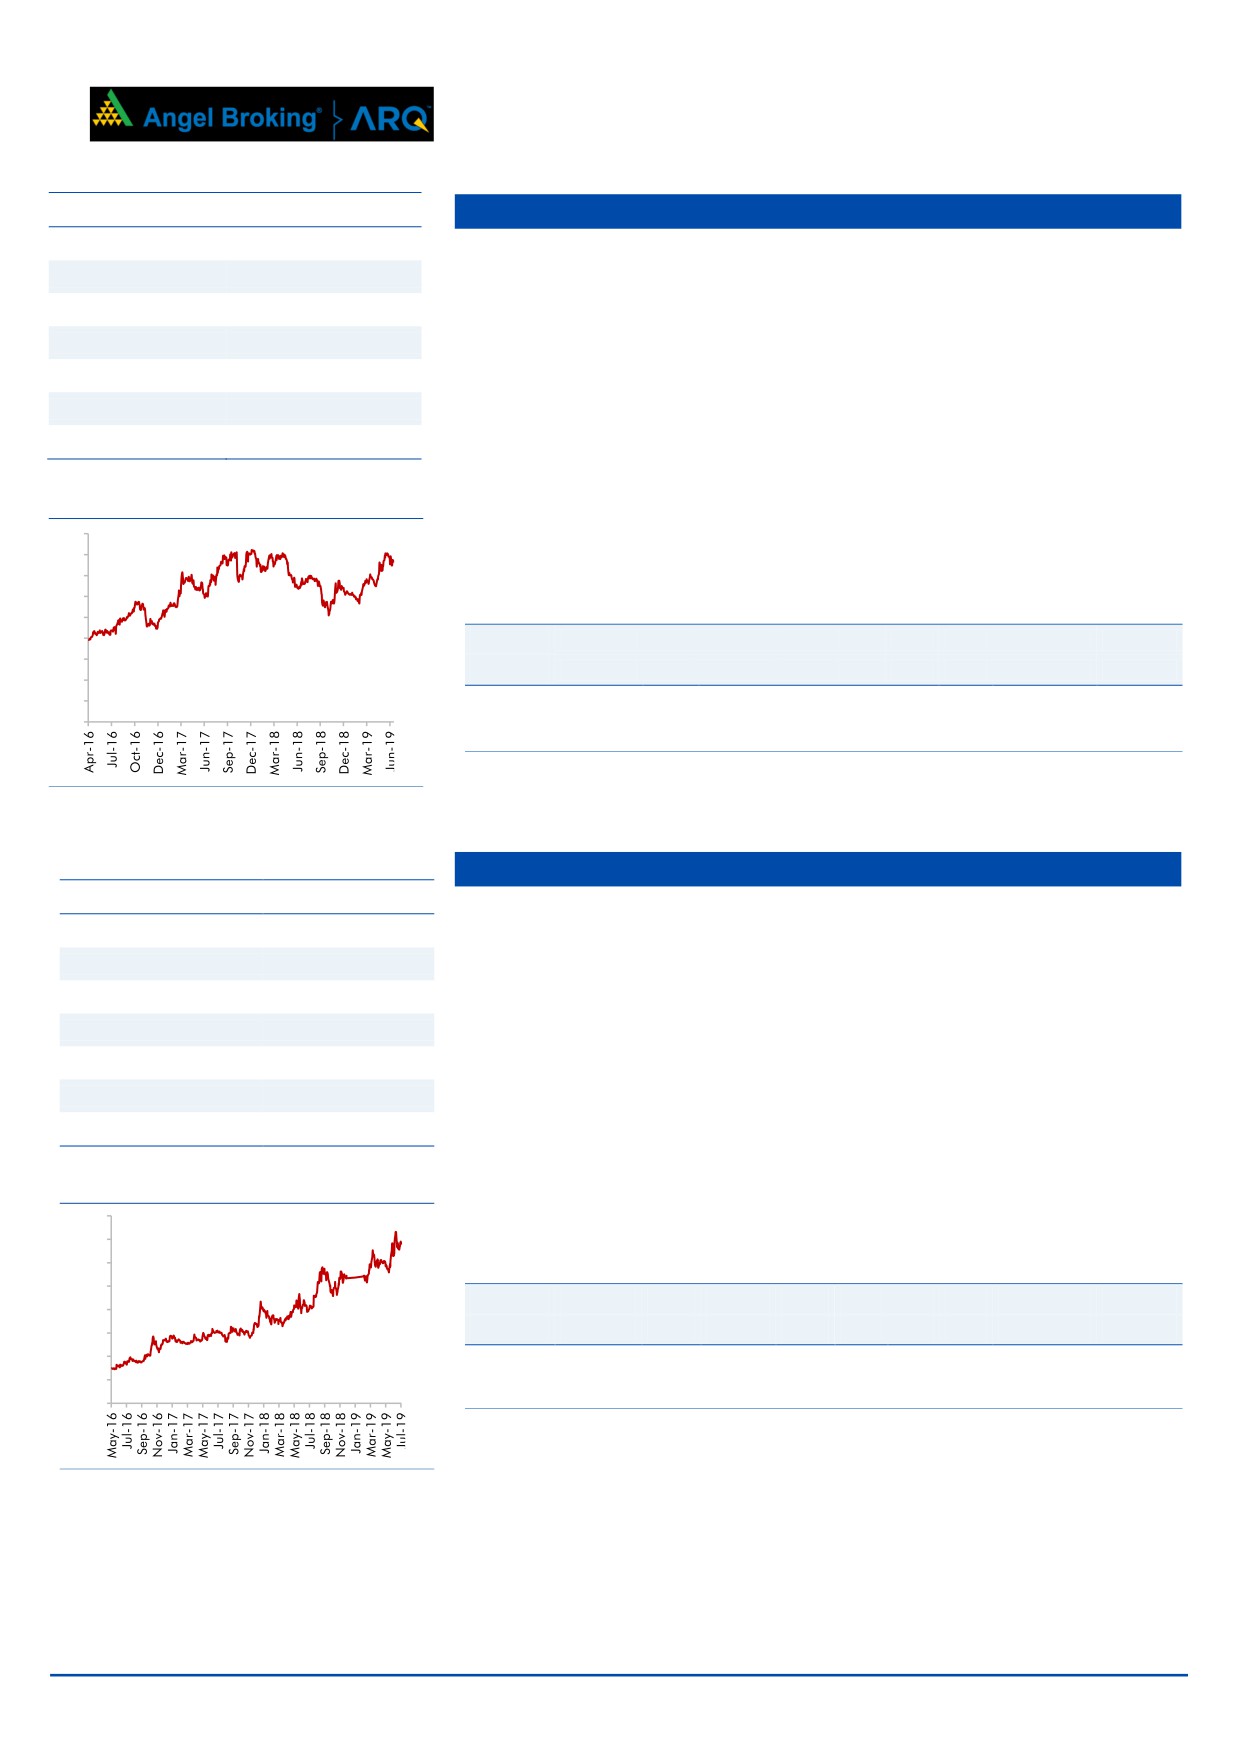
Aurobindo Pharma
Stock Info
Aurobindo Pharmaceuticals is an India-based leading global generic
CMP
611
company. It’s predominately formulations Export Company, with USA &
Europe contributing ~80% of sales (FY2018).
TP
890
Recently it acquired dermatology and oral solids businesses from Sandoz Inc.,
Upside
45.7%
USA. With this acquisition, Aurobindo adds sales of US$0.9bn and would
Sector
Pharmaceuticals
become the 2nd largest generic player in the US by number of prescriptions.
Market Cap (` cr)
34,926
Beta
1.2
Aurobindo has a robust pipeline (has filed 519 ANDA’s; second highest
52 Week High / Low
838/566
amongst Indian companies) & is investing to enhance its foray into complex
generic (mainly injectables, ophthalmic etc.) & biosimilar, which will drive its
next leg of growth.
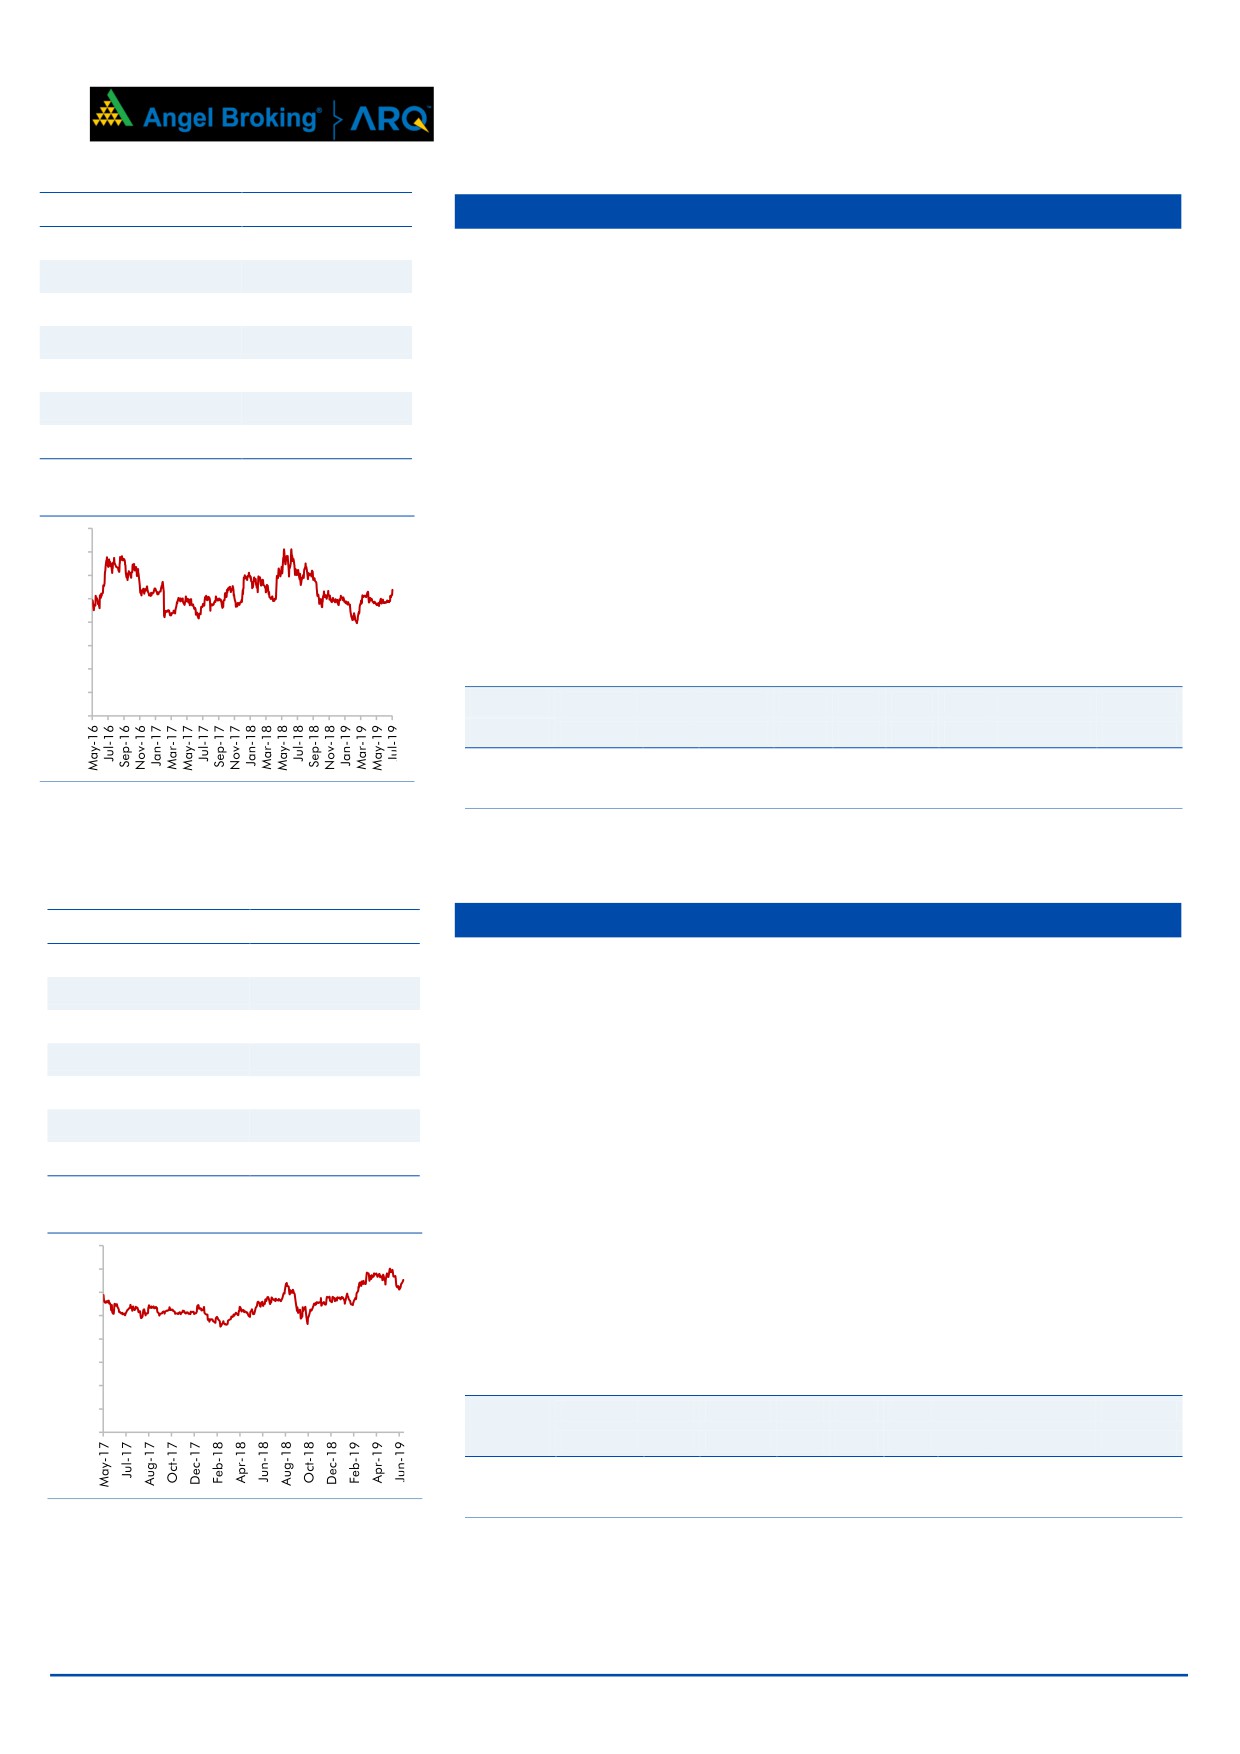
3 year-Chart
1,000
We expect Aurobindo to report net revenue CAGR of ~22% & net profit to
900
800
grow at ~19% CAGR during FY2018-20E, aided by acquisitions. Valuations of
700
the company are cheap V/s its peers and own fair multiples of 17-18x.
600
500
Key Financials
400
300
Y/E
Sales
OPM
PAT
EPS
ROE
P/E
P/BV
EV/EBITDA
EV/Sales
200
March
(` cr)
(%)
(` cr)
(`)
(%)
(x)
(x)
(x)
(x)
100
-
FY2019
19,226
20.4
2,365
41.5
17.1
14.7
2.6
10.3
2.1
FY2020E
24,234
21.9
3,438
58.9
22.2
10.4
2.4
7.2
1.6
Source: Company, Angel Research
Source: Company, Angel Research
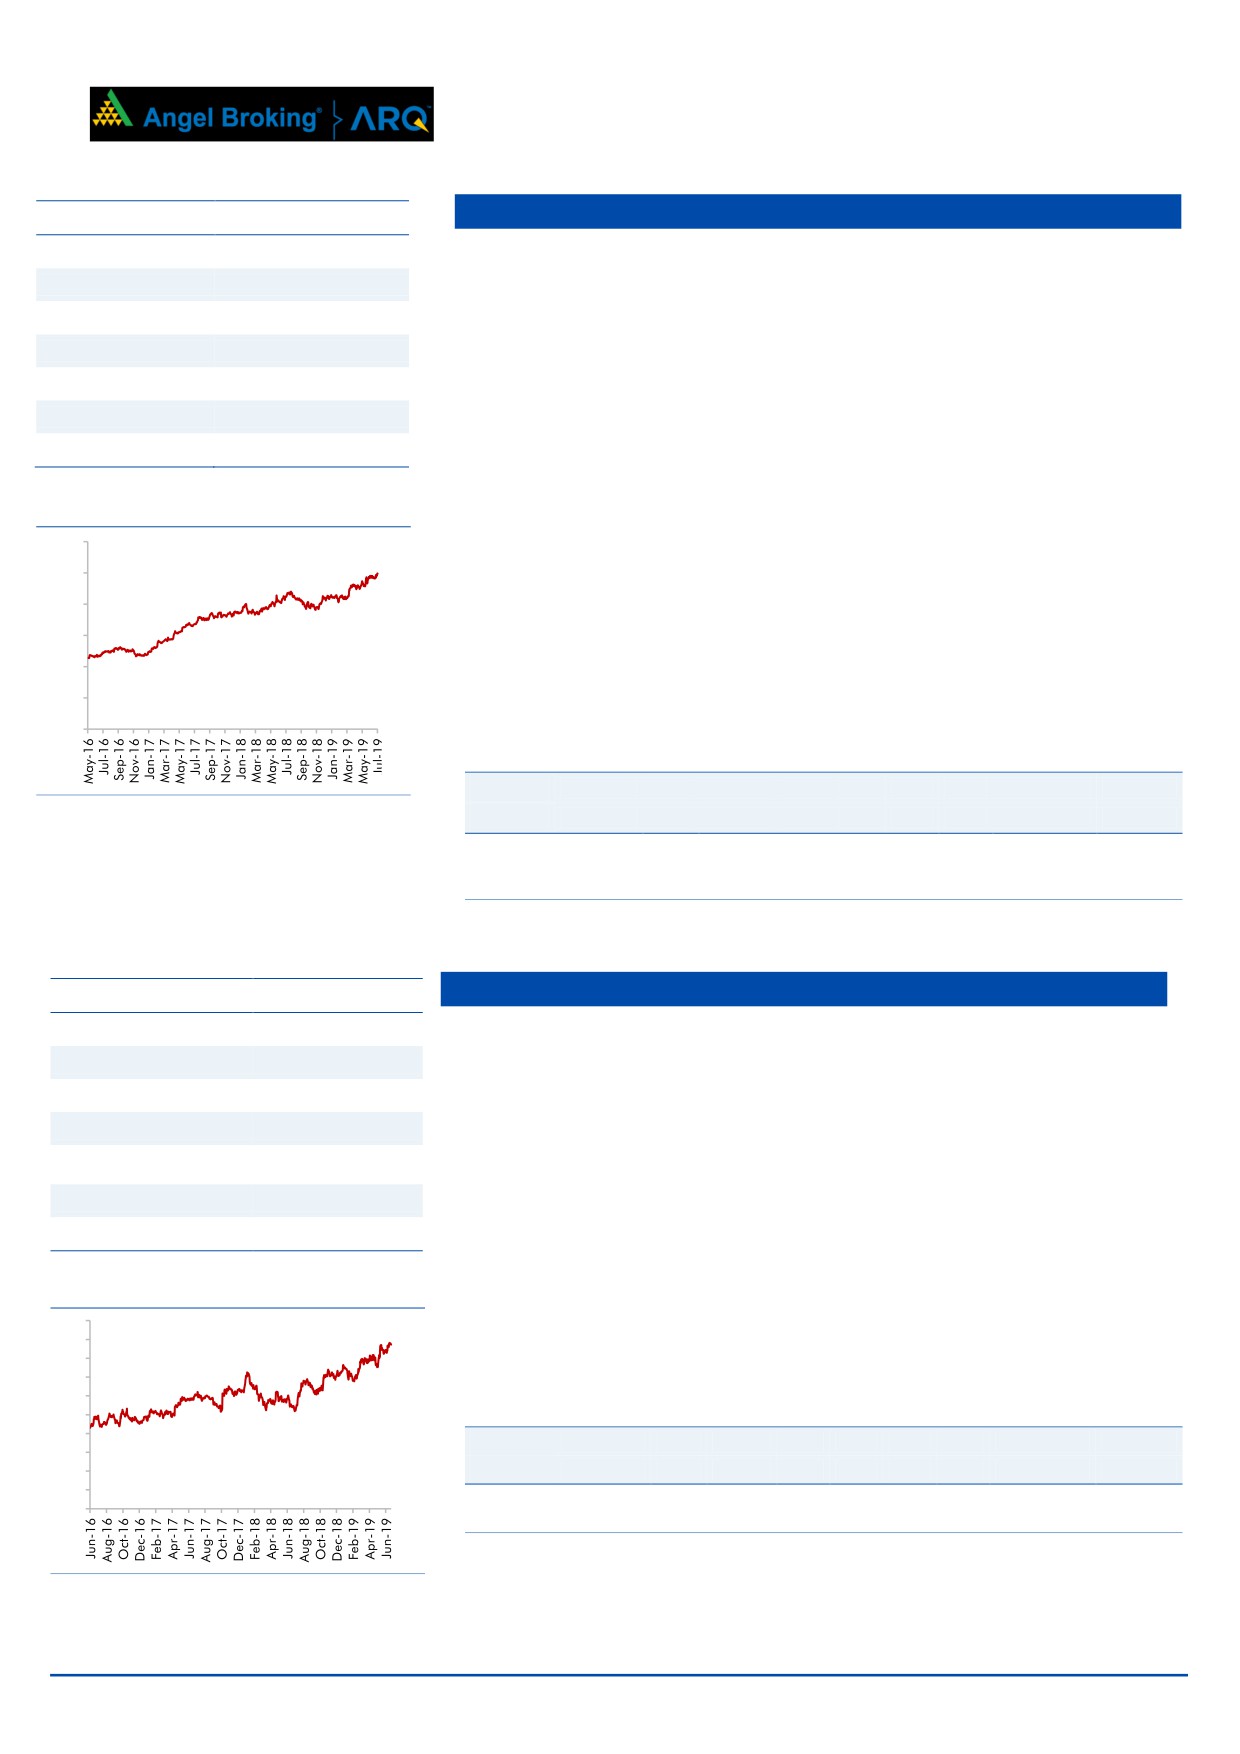
Bata India
Stock Info
Bata India Ltd (BIL) is the largest footwear retailer in India, offering footwear,
CMP
1,459
accessories and bags across brands like Bata, Hush Puppies, Naturalizer,
TP
1,643
Power, etc. BIL’s ~70% revenue is derived from Men & Kids segment and
Upside
12.7%
balance from women’s segment. BIL has over 1,400 Bata retail stores across
Sector
Footwear
India.
Market Cap (` cr)
18,829
Further, over the last 3 years, the company has added 135 stores (net
Beta
0.9
addition). Going forward, the company has plans to open 500 stores (already
52 Week High / Low
1,478 / 813
identified 435 cities) mainly in tier-II and tier-III cities over the next 4-5 years.
We expect BIL to report net revenue CAGR of ~17% to ~`4,100cr over
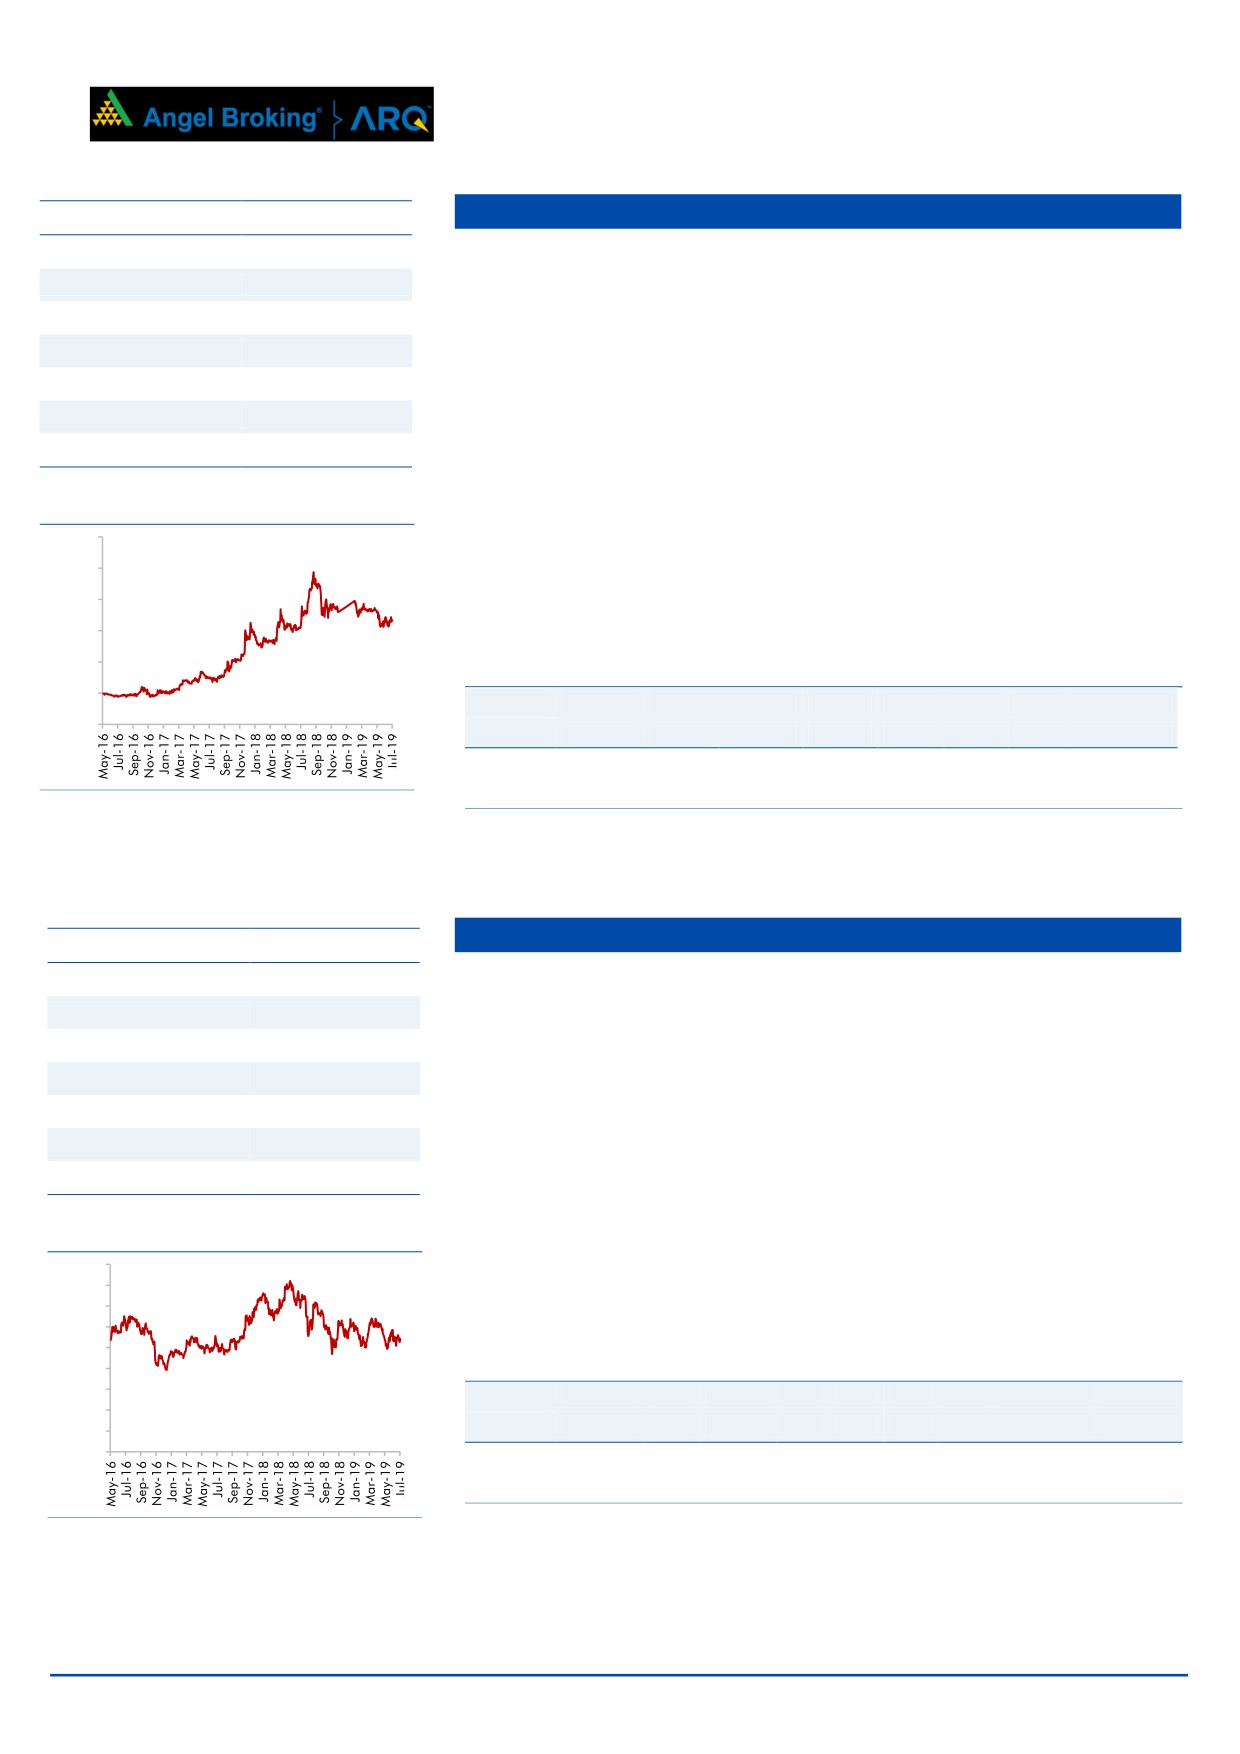
3 year-Chart
FY2019-21E mainly due increasing brand consciousness amongst Indian
1,600
consumers, new product launches and focus on women’s segment (high
1,400
growth segment). Further, on the bottom-line front, we expect CAGR of ~18%
1,200
to
`422cr over the same period on the back of margin improvement
1,000
800
(increasing premium product sales).
600
Key Financials
400
200
Y/E
Sales
OPM
PAT
EPS
ROE
P/E
P/BV
EV/EBITDA
EV/Sales
-
March
(` cr)
(%)
(` cr)
(`)
(%)
(x)
(x)
(x)
(x)
FY2020E
3,497
16.4
358
27.9
17.6
52.7
9.3
31.4
5.1
FY2021E
4,100
16.5
422
32.9
17.7
44.6
7.9
26.4
4.4
Source: Company, Angel Research
Source: Company, Angel Research
July 4, 2019
4
Angel Top Picks | July 2019
Stock Info
Blue Star
CMP
769
BSL is one of the largest air-conditioning companies in India. With a mere 3%
TP
867
penetration level of ACs vs 25% in China, the overall outlook for the room air-
Upside
12.9%
conditioner (RAC) market in India is favorable.
Sector
Cons.Durable
BSL's RAC business has been outgrowing the industry by ~10% points over the
Market Cap (` cr)
7,362
last few quarters, resulting in the company consistently increasing its market
share. This has resulted in the Cooling Products Division (CPD)'s share in
Beta
0.2
overall revenues increasing from~23% in FY2010 to ~50% in FY2018
52 Week High / Low
825/507
(expected to improve to ~50-55% in FY20E). With strong brand equity and
higher share in split ACs, we expect the CPD to continue to drive growth.
3 year-Chart
Going Aided by increasing contribution from the Unitary Products, we expect
900
the overall top-line to post revenue CAGR of ~13% over FY2018-20E and
800
700
margins to improve from 5.8% in FY2018 to 6.2% in FY2020E.
600
500
Key Financials
400
Y/E
Sales
OPM
PAT
EPS
ROE
P/E
P/BV
EV/EBITDA
EV/Sales
300
March
(` cr)
(%)
(` cr)
(`)
(%)
(x)
(x)
(x)
(x)
200
100
FY2020E
5,891
6.5
205
21.3
20.9
32.7
6.8
17.8
1.2
-
FY2021E
6,680
6.8
246
25.6
22.8
27.2
6.2
15.0
1.0
Source: Company, Angel Research
Source: Company, Angel Research
GMM Pfaudler Ltd.
Stock Info
GMM Pfaudler Limited (GMM) is the Indian market leader in glass-lined (GL)
CMP
1,363
steel equipment used in corrosive chemical processes of agrochemicals,
TP
1,570
specialty chemical and pharma sector. The company is seeing strong order
Upside
15.2%
inflow from the user industries which is likely to provide 20%+ growth outlook
for next couple of years.
Sector
Machinery
Market Cap (` cr)
1,993
GMM has also increased focus on the non-GL business, which includes mixing
Beta
0.7
equipment, filtration and drying equipment for the chemical processing
industry. It is expecting to increase its share of non-GL business to 50% by
52 Week High / Low
1,483/780
2020.
3 year-Chart
GMM is likely to maintain the 20%+ growth trajectory over FY18-20 backed
1,600
by capacity expansion and cross selling of non-GL products to its clients.
1,400
1,200
Key Financials
1,000
Y/E
Sales
OPM
PAT
EPS
ROE
P/E
P/BV
EV/EBITDA
EV/Sales
800
600
March
(` cr)
(%)
(` cr)
(`)
(%)
(x)
(x)
(x)
(x)
400
FY2019
502
16.99
50.5
34.6
19.0
39.4
7.4
22.3
3.8
200
FY2020E
591
17.1
69
47.3
20.4
28.8
5.2
17.9
3.0
-
Source: Company, Angel Research
Source: Company, Angel Research
July 4, 2019
5
Angel Top Picks | July 2019
HDFC Bank
Stock Info
CMP
2,495
Bank has planned to improve business with digital platform and engaging with
TP
2,660
mid market client. Banks next leg of growth road map 1) increasing branch
Upside
6.6%
opening number from 300 current to 600 annually in non urban area. 2)
Increase POS 4x to 4mn by FY21 and double the virtual relationship manager
Sector
Banking
client in 3 years.
Market Cap (` cr)
680,334
Asset Strong and steady NIM of 4.4% on the back of lower cost of funds and
Beta
0.8
lower credit cost will ensure healthy return ratios for the company. Despite
52 Week High / Low
2,502/1,884
strong growth, the company has maintained stable asset quality (GNPA/NPA -
1.3%/0.4%).
3 year-Chart
HDFC bank’s subsidiaries, HDB Financial Services (HDBFS) and HDFC
3,000
Securities continue to contribute well to the banks overall growth. Strong loan
2,500
book, well-planned product line and clear customer segmentation aided this
2,000
growth.
1,500
We We expect the company’s loan growth to remain 22% over next two years
1,000
and earnings growth is likely to be more than 21%.
500
-
Key Financials
Y/E
NII
NIM
PAT
EPS
ABV
ROA
ROE
P/E
P/ABV
Source: Company, Angel Research
March
(` cr)
(%)
(` cr)
(`)
(`)
(%)
(%)
(x)
(x)
FY2020E
58,049
4.4
25,611
94.0
605
1.9
16.5
26.5
4.1
FY2021E
70,343
4.4
31,312
115.0
701
1.9
17.5
21.7
3.6
Source: Company, Angel Research
ICICI Bank
Stock Info
CMP
437
ICICI bank has taken a slew of steps to strengthen its balance sheet. Measures
TP
490
such as Incremental lending to higher rated corporate, reducing concentration
Upside
12.2%
in few stressed sectors and building up the retail loan book. The share of retail
loans in overall loans increased to 60% (Q4FY19) from 38% in FY12.
Sector
Banking
ICICI bank’s slippages remained high during FY18 and hence GNPA went up
Market Cap (` cr)
281,314
to 8.8% vs. 5.8% in FY16. We expect addition to stress assets to reduce and
Beta
1.7
credit costs to further decline owing to incremental lending to higher rated
52 Week High / Low
443/257
corporate and faster resolution in Accounts referred to NCLT under IBC.
The gradual improvement in recovery of bad loans would reduce credit costs
3 year-Chart
that would help to improve return ratio. The strength of the liability franchise,
500
shift in loan mix towards retail assets and better rated companies, and
450
400
improvement in bad loans would be a key trigger for multiple expansion.
350
300
250
Key Financials
200
Y/E
Op. Inc
NIM
PAT
EPS
ABV
ROA
ROE
P/E
P/ABV
150
100
March
(` cr)
(%)
(` cr)
(`)
(`)
(%)
(%)
(x)
(x)
50
FY2020E
31,749
3.4
12,600
20
169
1.2
11
22
2.6
-
FY2021E
37,524
3.5
15,448
24
188
1.3
12
18
2.3
Source: Company, Angel Research
Source: Company, Angel Research
July 4, 2019
6
Angel Top Picks | July 2019
Stock Info
Jindal Steel & Power Ltd.
CMP
141
The company has increased its crude steel capacity more than double in last
TP
250
five years from 3.6 MTPA to 8.6 MTPA and currently running at ~65%
Upside
77.5%
utilization.
Owing to continuous demand of steel from infrastructure, housing and auto
Sector
Steel & Power
sectors along with limited addition of steel capacity in near term and favorable
Market Cap (` cr)
14,650
government policies augur well for JSPL to perform well going forward, we
Beta
2.6
expect JSPL’s utilization to improve to 80-85% by FY20 along with reduction in
52 Week High / Low
246/123
debt led by improving in profitability.
From April 2019, power segment has seen improvement in PLF and now
3 year-Chart
producing 1,700 megawatts, up from the average 1,400 megawatts, this will
350
lead improvement in PLF from 34% to 50%.
300
Expect 515MW of PPA from NHPC currently, JPL emerged as L1 bidder.
250
200
JSPL is trading at attractive valuation to its peer, we value the stock based on
150
asset based approach of Steel segment on EV/Tone basis and Power segment
100
on EV/MW basis.
50
Key Financials
-
Y/E
Sales
OPM
PAT
EPS
ROE
P/E
P/BV
EV/EBITDA
EV/Sales
March
(` cr)
(%)
(` cr)
(`)
(%)
(x)
(x)
(x)
(x)
FY2020E
45,561
22.4
2,076
21
7.0
6.7
0.5
3.9
0.9
Source: Company, Angel Research
FY2021E
47,450
24.1
3,239
33
9.0
4.3
0.4
3.2
0.8
Source: Company, Angel Research
KEI Industries
Stock Info
CMP
477
KEI’s current order book (OB) stands at `3,866cr (segmental break-up: out
which EPC is around `1,508cr and balance from cables, substation & EHV). Its
TP
612
OB grew by ~28% in the last 3 years due to strong order inflows from State
Upside
28.5%
Electricity Boards, Power grid, etc.
Sector
cable
KEI’s consistent effort to increase its retail business from 30-32% of revenue in
Market Cap (` cr)
3,778
FY18 to 40-45% of revenue in the next 2-3 years on the back of strengthening
Beta
1.3
distribution network (currently 926 which is expect to increase `1,500 by FY20)
52 Week High / Low
532/248
and higher ad spend.
KEI’s export (FY19 - 16% of revenue) is expected to reach a level 20% in next
3 year-Chart
two years with higher order execution from current OB and participation in
600
various international tenders. We expect KEI to report net revenue CAGR of
500
~1% to ~`5,610cr and net profit CAGR of ~25% to `276cr over FY2019-
400
21E.
300
200
Key Financials
100
Y/E
Sales
OPM
PAT
EPS ROE P/E
EV/EBITDA
EV/Sales
-
March
(` cr)
(%)
(` cr)
(`)
(%)
(x)
(x)
(x)
FY2020E
4,878
10.5
233
30.2
3.7
15.8
8.4
0.9
FY2021E
5,610
10.5
276
35.8
22.3
13.3
7.1
0.8
Source: Company, Angel Research
Source: Company, Angel Research
July 4, 2019
7
Angel Top Picks | July 2019
Maruti Suzuki
Stock Info
CMP
6,559
Maruti Suzuki continues to hold ~52% market share in the passenger vehicles.
TP
8,552
The launch of exciting models has helped the company to ride on the
Upside
30.4%
premiumization wave that is happening in the country. In the last two years,
Sector
Automobile
company has seen improvement in the business mix with the pie of the utility
vehicles growing from ~4% to current 15%. The 2-3 months of waiting period
Market Cap (` cr)
197,264
of new models, launch of Swift Hatchback in January, 2018 and headroom
Beta
1.0
for more capacity utilization at Gujarat plant is the near term earning triggers.
52 Week High / Low
9,923/6,324
Due to the favorable business mix, company has also been seeing
3 year-Chart
improvement in the margins. Company has already moved from ~11-12%
12,000
Together with higher operating leverage at Gujarat plant, increasing Nexa
10,000
outlets, and improving business mix, we believe that company has further
8,000
room to improve its margins.
6,000
4,000
Key Financials
Y/E
Sales
OPM
PAT
EPS
ROE
P/E
P/BV
EV/EBITDA
EV/Sales
2,000
March
(` cr)
(%)
(` cr)
(`)
(%)
(x)
(x)
(x)
(x)
-
FY2020
94,790
14.2
8,670
287.1
16.7
23.2
4.52
11.5
1.6
FY2021E
107,896
14.5
9,970
330.1
17.2
20.2
3.78
9.4
1.4
Source: Company, Angel Research
Source: Company, Angel Research
Mahindra & Mahindra Ltd.
Stock Info
M&M is an India-based company, operating in nine segments: automotive,
CMP
667
farm equipment, IT services, financial services, steel trading & processing,
TP
1,050
infrastructure, hospitality, Systech and Others (comprising logistics, after-
Upside
57.6%
market, two wheelers and investment).
Sector
Automobile
IMD has predicted a near normal monsoon for 2019 for the third consecutive
year which should be a strong trigger for tractor sales growth. In our view,
Market Cap (` cr)
83,325
strong growth in tractor industry would benefit M&M the most due to strong
Beta
0.8
brand recall and leadership position in farm tractor.
52 Week High / Low
992/598
We expect M&M to report net revenue CAGR of ~9% to ~`63,184cr over
3 year-Chart
FY2019-21E mainly due to healthy growth in automobile segment like Utility
1,200
Vehicles (on the back of new launches and facelift of some models) and strong
1,000
growth in Tractors segment driven by strong brand recall and improvement in
800
rural sentiment. Further on the bottom-line front, we expect CAGR of ~9% to
600
`5,107cr over the same period on the back of margin improvement.
400
Key Financials
200
Y/E
Sales
OPM
PAT
EPS
ROE
P/E
P/BV
EV/EBITDA
EV/Sales
-
March
(` cr)
(%)
(` cr)
(`)
(%)
(x)
(x)
(x)
(x)
FY2020E
57,337
12.4
4,756
40.0
12.6
16.7
2.1
8.5
1.0
Source: Company, Angel Research
FY2021E
63,184
12.4
5,107
42.9
13.9
15.5
2.2
7.8
1.0
Source: Company, Angel Research
July 4, 2019
8
Angel Top Picks | July 2019
Stock Info
Parag Milk Foods
CMP
261
Parag Milk Foods (PARAG) is one of the leading dairy products companies in
TP
330
India. The company has been successful in creating strong brands like GO,
Upside
26.8%
Gowardhan and in introducing new products like Whey Protein. It has become
Sector
Dairy
the 2nd player in processed cheese (after Amul) in a short span of 10 years
Market Cap (` cr)
2,264
and commands 33% market share.
Beta
1.1
Value Added Products like cheese, whey protein enjoy higher gross margins of
52 Week High / Low
344/197
25-45% versus 6-8% entailed in liquid milk. VAP forms ~66% to its revenue
(the highest among the listed players versus 25-30% for others). Driven by
3 year-Chart
recently launched products and higher share of VAP, its operating margins
400
would improve in next few years.
350
300
Thus we expect PARAG to report net revenue/PAT CAGR of
18%/19%
250
200
respectively over FY2019-21E.
150
100
Key Financials
50
Y/E
Sales
OPM
PAT
EPS
ROE
P/E
P/BV
EV/EBITDA
EV/Sales
-
March
(` cr)
(%)
(` cr)
(`)
(%)
(x)
(x)
(x)
(x)
FY2020E
2,822.9
10.6
150.9
17.9
14.9
14.5
2.1
7.8
0.8
FY2021E
3,246.3
9.8
163.7
19.5
13.9
13.4
1.8
7.3
0.7
Source: Company, Angel Research
Source: Company, Angel Research
RBL Bank
Stock Info
CMP
653
RBL Bank (RBK) has grown its loan book at healthy CAGR of 53% over FY10-
TP
775
19. We expect it to grow at 35% over FY19-21E. With adequately diversified,
Upside
18.7%
well capitalised B/S, RBK is set to grab market share from corporate lenders
Sector
Banking
(esp.PSUs).
Market Cap (` cr)
27,872
The retail loan portfolio grew 57% YoY to `16,467cr and now constitutes 30%
Beta
0.9
of the loan book (18% share in 4QFY17).NIM has expanded to 4.23%, up
52 Week High / Low
716/439
25bps YoY, despite a challenging interest rate scenario on the back of a
changing portfolio mix and lower cost of deposits. The management stated
2 year-Chart
that the bank is slated to breach 4% NIM early in FY19.
800
700
RBL Bank currently trades at 2.8x its FY2021E price to book value, which we
600
believe is reasonable for a bank in a high growth phase with stable asset
500
quality.
400
300
200
Key Financials
100
Y/E
Op. Inc
NIM
PAT
EPS
ABV
ROA
ROE
P/E
P/ABV
-
March
(` cr)
(%)
(` cr)
(`)
(`)
(%)
(%)
(x)
(x)
FY2020E
3,500
3.9
1,291
31
200
1.4
16
21
3.3
FY2021E
4,804
4.0
1,861
44
235
1.5
20
15
2.8
Source: Company, Angel Research
Source: Company, Angel Research
July 4, 2019
9
Angel Top Picks | July 2019
Safari Industries
Stock Info
CMP
663
Safari Industries Ltd (Safari) is the third largest branded player in the Indian
TP
1,000
luggage industry. Post the management change in 2012, Safari has grown its
Upside
50.8%
revenue by 6x in the last 7 years. This has been achieved by foraying in many
Sector
Luggage
new categories like back pack, school bags (via acquisition of Genius and
Genie) and improvement in distribution networks.
Market Cap (` cr)
1,476
Beta
0.3
Its margins have more than doubled from 4.1% in FY2014 to 9.8% in FY2018,
52 Week High / Low
1,005/608
driven by launch of new product categories and business. We expect it to
maintain 9%+ margins from FY2018 onwards led by regular price hikes, shift
3 year-Chart
towards organized player and favorable industry dynamics.
1,200
We expect its revenue to grow by a CAGR of ~37%/49% in revenue/ earnings
1,000
over FY2018-20E on the back of growth in its recently introduced new
800
products.
600
400
Key Financials
200
Y/E
Sales
OPM
PAT
EPS
ROE
P/E
P/BV
EV/Sales
-
March
(` cr)
(%)
(` cr)
(`)
(%)
(x)
(x)
(x)
FY2019
577
9.3
26.9
12
13.9
55.3
7.4
2.8
FY2020E
785
10.4
47.0
21.1
19.1
31.4
7.3
2.0
Source: Company, Angel Research
Source: Company, Angel Research
Shriram Transport Finance
Stock Info
CMP
1,068
SHTF's primary focus is on financing pre-owned commercial vehicles. We
TP
1,470
expect AUM to grow at CAGR of 15% over FY2019-21E led by pick up in
Upside
37.7%
infra/ construction Post 2019 elections, macro revival and Ramping up in rural
distribution.
Sector
Financials
Market Cap (` cr)
24,619
In last three year SHTF, GNPA and credit cost has been increased primarily
Beta
0.9
due to the transition of NPA recognition from 180DPD to 90DPD (Q4FY18).
52 Week High / Low
1,476/904
Q1FY19 onwards asset quality started witnessing steady improvement, and we
expect this trend to continue.
3 year-Chart
We expect STFC to report RoA/RoE to2.7%/17.6% in FY2021E respectively. At
1,800
1,600
CMP, the stock is trading at 1.3x FY2021E ABV and 7x FY2021E EPS, which
1,400
we believe is reasonable for differentiated business model with return ratios.
1,200
1,000
800
Key Financials
600
Y/E
Op. Inc
NIM
PAT
EPS
ABV
ROA
ROE
P/E
P/ABV
400
200
March
(` cr)
(%)
(` cr)
(`)
(`)
(%)
(%)
(x)
(x)
-
FY2020E
8,804
8.2
2,910
128
813
2.6
17
8
1.5
FY2021E
10,305
8.3
3,531
156
953
2.7
18
7
1.3
Source: Company, Angel Research
Source: Company, Angel Research
July 4, 2019
10
Angel Top Picks | July 2019
TTK Prestige
Stock Info
CMP
6,664
TTK Prestige (TTK) is the leading brands in kitchen appliances with 40%+
TP
7,708
market share in organized market. It has successfully transformed from a
Upside
15.7%
single product company to a multi product company offering an entire gamut
of kitchen and home appliances (600+ products).
Sector
Houseware
Market Cap (` cr)
9,328
It has also launched an economy range - ‘Judge Cookware’ to capture the
Beta
1.2
untapped demand especially at the bottom end of the pyramid. It is expecting
good growth in cleaning solution.
52 Week High / Low
7,738/4,581
It expects to double its revenue in the next five years backed by revival in
3 year-Chart
consumption demand, new 6 cr LPG connections under the Ujjawala Scheme,
10,000
inorganic expansion and traction in exports. We expect TTK to report a CAGR
9,000
8,000
of 16%/22% in revenue/PAT respectively over FY2018-20E.
7,000
6,000
5,000
Key Financials
4,000
3,000
Y/E
Sales
OPM
PAT
EPS
ROE P/E P/BV EV/Sales
2,000
1,000
March
(` cr)
(%)
(` cr)
(`)
(%)
(x)
(x)
(x)
-
FY2019
2,106
15.1
192.4
138.7
16.7
48.0
7.9
4.4
FY2020E
2,648
14.3
246.3
213.4
17.7
31.2
5.5
2.9
Source: Company, Angel Research
Source: Company, Angel Research
July 4, 2019
11
Angel Top Picks | July 2019
Exhibit 2: Changes in Recommendation
Effective Date
Stock
CMP
Change in recommantaion
(`)
From
To
06-06-2019
Ashok Leyland
90
Buy
Hold
06-06-2019
GIC Housing
256
Buy
Hold
06-06-2019
Inox Wind
70
Buy
Hold
06-06-2019
Music Broadcast
58
Buy
Hold
06-06-2019 Siyaram Silk Mills
311
Buy
Hold
Source: Angel Research
Hold - While we recommend to Hold on to existing positions at current level, we
would await for further data points before recommending any fresh purchases.
July 4, 2019
12
Angel Top Picks | July 2019
Research Team Tel: 022 - 39357800
DISCLAIMER
Angel Broking Limited (hereinafter referred to as “Angel”) is a registered Member of National Stock Exchange of India Limited, Bombay
Stock Exchange Limited and Metropolitan Stock Exchange Limited. It is also registered as a Depository Participant with CDSL and
Portfolio Manager and investment advisor with SEBI. It also has registration with AMFI as a Mutual Fund Distributor. Angel Broking
Private Limited is a registered entity with SEBI for Research Analyst in terms of SEBI (Research Analyst) Regulations, 2014 vide
registration number INH000000164. Angel or its associates has not been debarred/ suspended by SEBI or any other regulatory
authority for accessing /dealing in securities Market. Angel or its associates/analyst has not received any compensation / managed or
co-managed public offering of securities of the company covered by Analyst during the past twelve months.
This document is solely for the personal information of the recipient, and must not be singularly used as the basis of any investment
decision. Nothing in this document should be construed as investment or financial advice. Each recipient of this document should
make such investigations as they deem necessary to arrive at an independent evaluation of an investment in the securities of the
companies referred to in this document (including the merits and risks involved), and should consult their own advisors to determine
the merits and risks of such an investment.
Reports based on technical and derivative analysis center on studying charts of a stock's price movement, outstanding positions and
trading volume, as opposed to focusing on a company's fundamentals and, as such, may not match with a report on a company's
fundamentals. Investors are advised to refer the Fundamental and Technical Research Reports available on our website to evaluate the
contrary view, if any.
The information in this document has been printed on the basis of publicly available information, internal data and other reliable
sources believed to be true, but we do not represent that it is accurate or complete and it should not be relied on as such, as this
document is for general guidance only. Angel Broking Limited or any of its affiliates/ group companies shall not be in any way
responsible for any loss or damage that may arise to any person from any inadvertent error in the information contained in this report.
Angel Broking Limited has not independently verified all the information contained within this document. Accordingly, we cannot testify,
nor make any representation or warranty, express or implied, to the accuracy, contents or data contained within this document. While
Angel Broking Limited endeavors to update on a reasonable basis the information discussed in this material, there may be regulatory,
compliance, or other reasons that prevent us from doing so.
This document is being supplied to you solely for your information, and its contents, information or data may not be reproduced,
redistributed or passed on, directly or indirectly.
Neither Angel Broking Limited, nor its directors, employees or affiliates shall be liable for any loss or damage that may arise from or in
connection with the use of this information
Ratings (Based on expected returns
Buy (> 15%)
Accumulate (5% to 15%)
Neutral (-5 to 5%)
over 12 months investment period):
Reduce (-5% to -15%)
Sell (< -15)