Angel Top Picks - July 2017
The goods and services tax (GST) became a reality from July 1st 2017. The new
Top Picks
indirect tax regime unifies the country by making India a homogenous market. By
Company
CMP (`)
TP (`)
removing the state barriers, trade becomes easier. While GST, in the current form
Banking/NBFC
may not be the perfect, but it is better than the earlier tax regime and was due for
Dewan Housing
436
520
long. We revisit how GST is likely to benefit the economy.
Karur Vysa Bank
144
160
Consumption
Positive for macros: By removing the complicated indirect tax system, government
has simplified indirect taxes; this is a big relief to the businesses. The new tax
Asian Granito
446
480
regime is expected to improve our ease of doing business ranking which will help
Blue Star
612
760
in bringing more FDI inflows in the country. Also by keeping household items in
Siyaram Silk Mills
2,200
2,500
the lower tax bracket, government has ensured that GST does not exert inflationary
Media
pressure on the economy. GST also requires adherence to invoicing which is
Maruti Suzuki
7,371
8,495
expected increase tax compliance. This will result in widening the tax base and
TV Today
251
344
increasing the tax collection. This is expected to be credit positive for the country
Real Estate/Infra/Logistics/Power
and may lead to improve our credit rating.
KEI Industries
234
258
Benefits for the corporate sector: GST has made India a single market which
Mahindra Lifespace
439
522
means companies will be able to sell their products/services at the same cost
Navkar Corp.
210
265
across the country. Single tax has also removed the state barriers which mean
Pharma
companies will be able to operate hub and spoke model on a more efficient
Alkem Lab.
1,836
2,161
manner. This will reduce the transport cost and bring efficiency in the operations.
Source: Angel Research;
Note: CMP as of July 5, 2017
GST removes the tax differential between the organized and unorganized players
and will help the tax compliant companies/businesses. This will remove the pricing
advantage of unorganized players implying that organized players are expected to
benefit.
Strong boost to the consumption sector: With the implementation of five different
tax rates announced under GST, government has ensured smooth transition from
earlier tax regime to GST. Under GST, due to the reduced logistics costs,
household goods/services prices are likely to soften; this will help curbing the
inflation in long term. The household items, FMCG products are already seeing
price cuts. The automobile sector is also seeing ~3-4% price cuts in the most
vehicle categories; this will be a boost to the consumption sector. Cement sector
has also emerged as a beneficiary after GST rates.
Overall, we expect GST regime to be positive in the long term for the country.
Though we do not deny supply disruption in the initial stages, a bumpier transition
is not expected.
Owing to this, we make few changes in our portfolio, we add Maruti Suzuki which
is expected to see strong volume growth owing to the price cuts after GST. We
continue to hold Asian Granito and Blue Star from consumption sector, Mahindra
Lifespace and Dewan Housing as housing theme. We also remain positive on
Karur Vysa Bank, Alkem laboratories, Navkar Corp, KEI Industries and Siyaram
Silk Mills.
Please refer to important disclosures at the end of this report
1
Top Picks Report | July 2017
Top Picks
July 6, 2017
2
Top Picks Report | July 2017
Stock Info
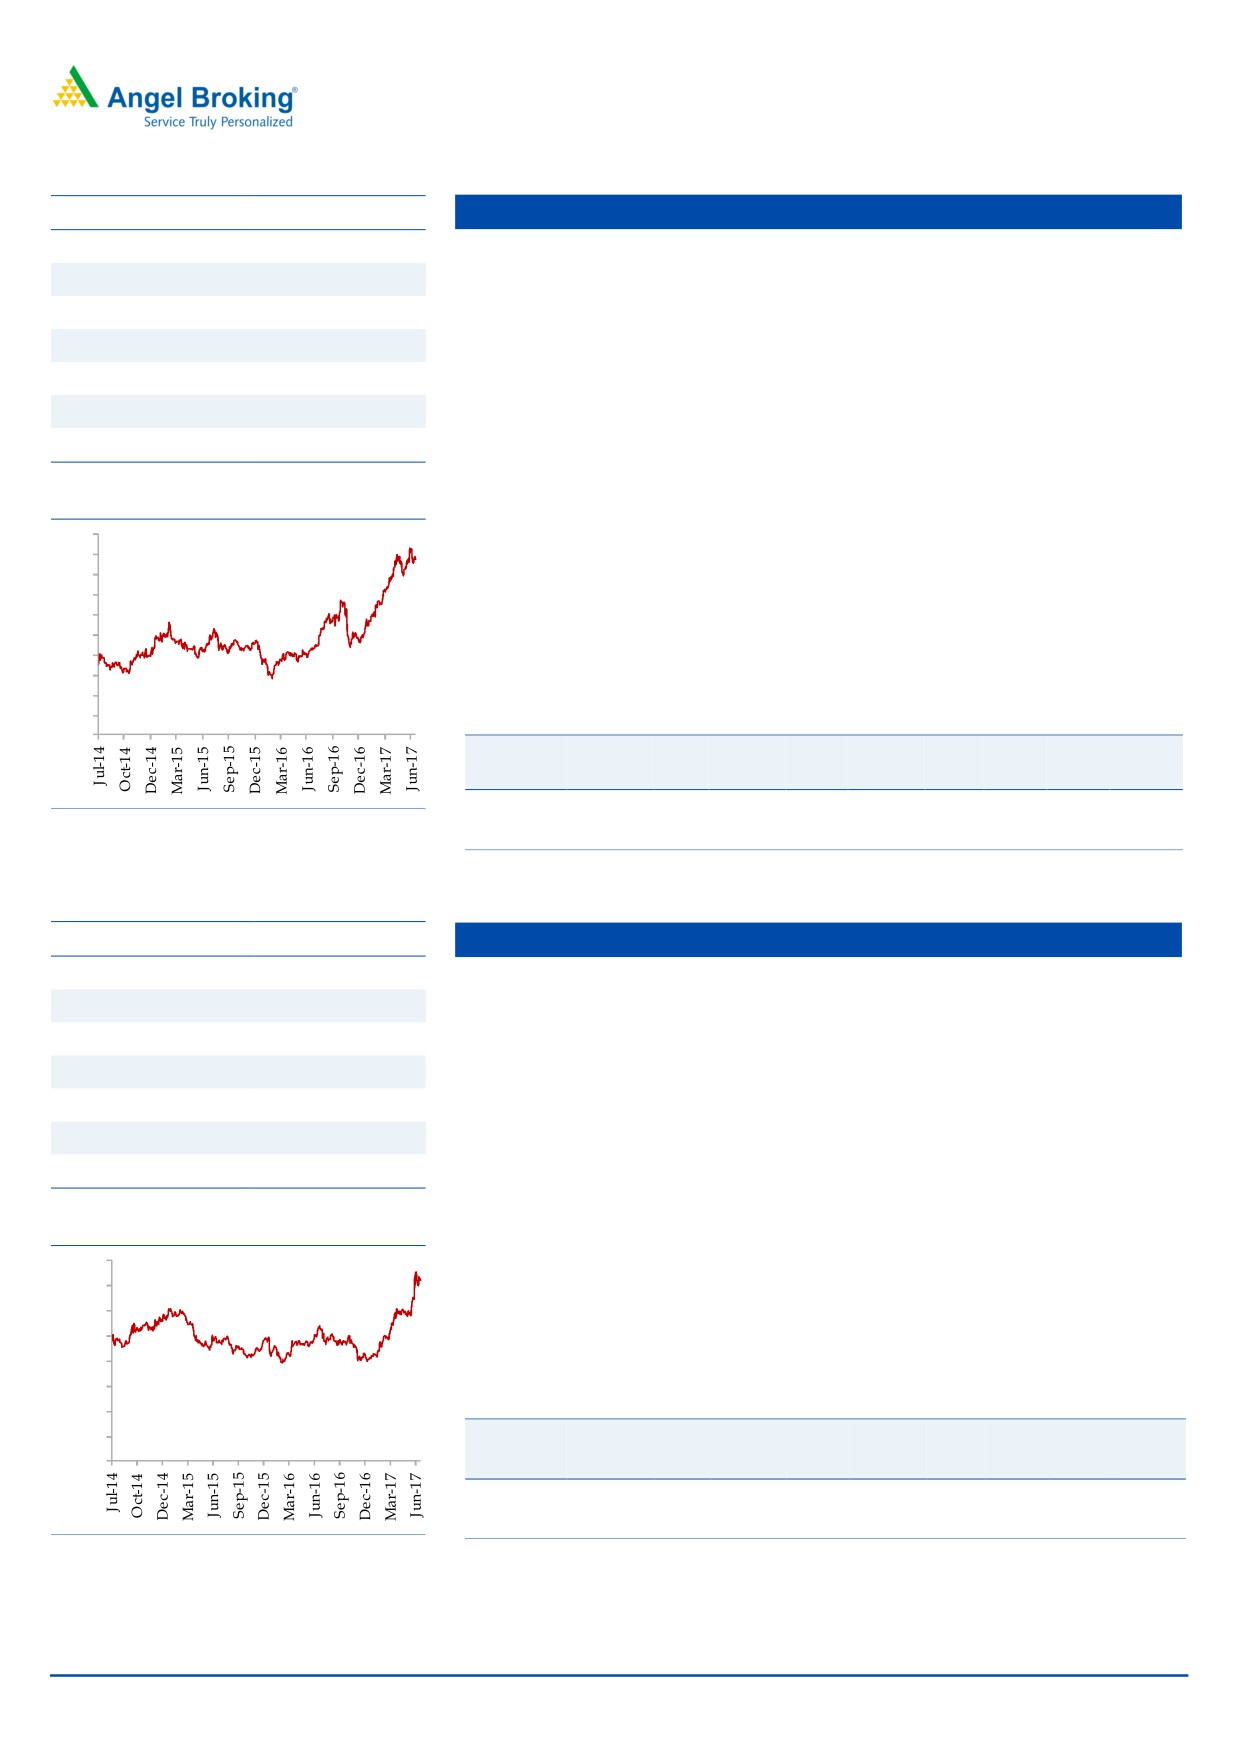
Dewan Housing
CMP
436
Loan growth to remain strong going ahead: Backed by healthy capital
TP
520
adequacy and increasing demand for home loans DHFL’s loan book is
Upside
19.3%
expected to report 20% loan growth over next two three years.
Sector
Financials
Strong Capital adequacy lends visibility for growth: DHFL sold 50% stake held
Market Cap (` cr)
13,814
by it in DFHFL Pramerica Life Insurance Co Ltd which added `1969 cr to its
Beta
1.9
net worth and increases its CAR by 400 bps, to 19.3% which should fuel
52 Week High / Low
468 / 207
growth for next 2-3 years.
Lower cost of funds will help maintain NIM: DHFL has replaced high cost bank
3 year-Chart
loans with the NCDs raised and it will continue to reduce its dependence on
500
banks as its source of funding. This should help it maintain its NIM of 2.9%-
450
3.0%. The recent capital received via stake sale should also aid to the NIM.
400
350
Outlook: We expect the company’s loan growth to remain 20% over next two
300
years and earnings growth also is likely to be more than 20%.The stock
250
currently trades at 1.6x FY2018E ABV. We maintain Buy on the stock, with a
200
150
target price of `520.
100
50
Key Financials
-
Y/E
Op. Inc NIM
PAT
EPS
ABV ROA ROE P/E P/ABV
March
(` cr)
(%)
(` cr)
(`)
(`)
(%)
(%)
(x)
(x)
FY2017
2,050
2.9
923
29.5
189
1.2
16.3
14.8
2.3
Source: Company, Angel Research
FY2018E
2,500
2.9
1,145
36.6
281
1.2
14.8
11.9
1.6
Source: Company, Angel Research
Stock Info
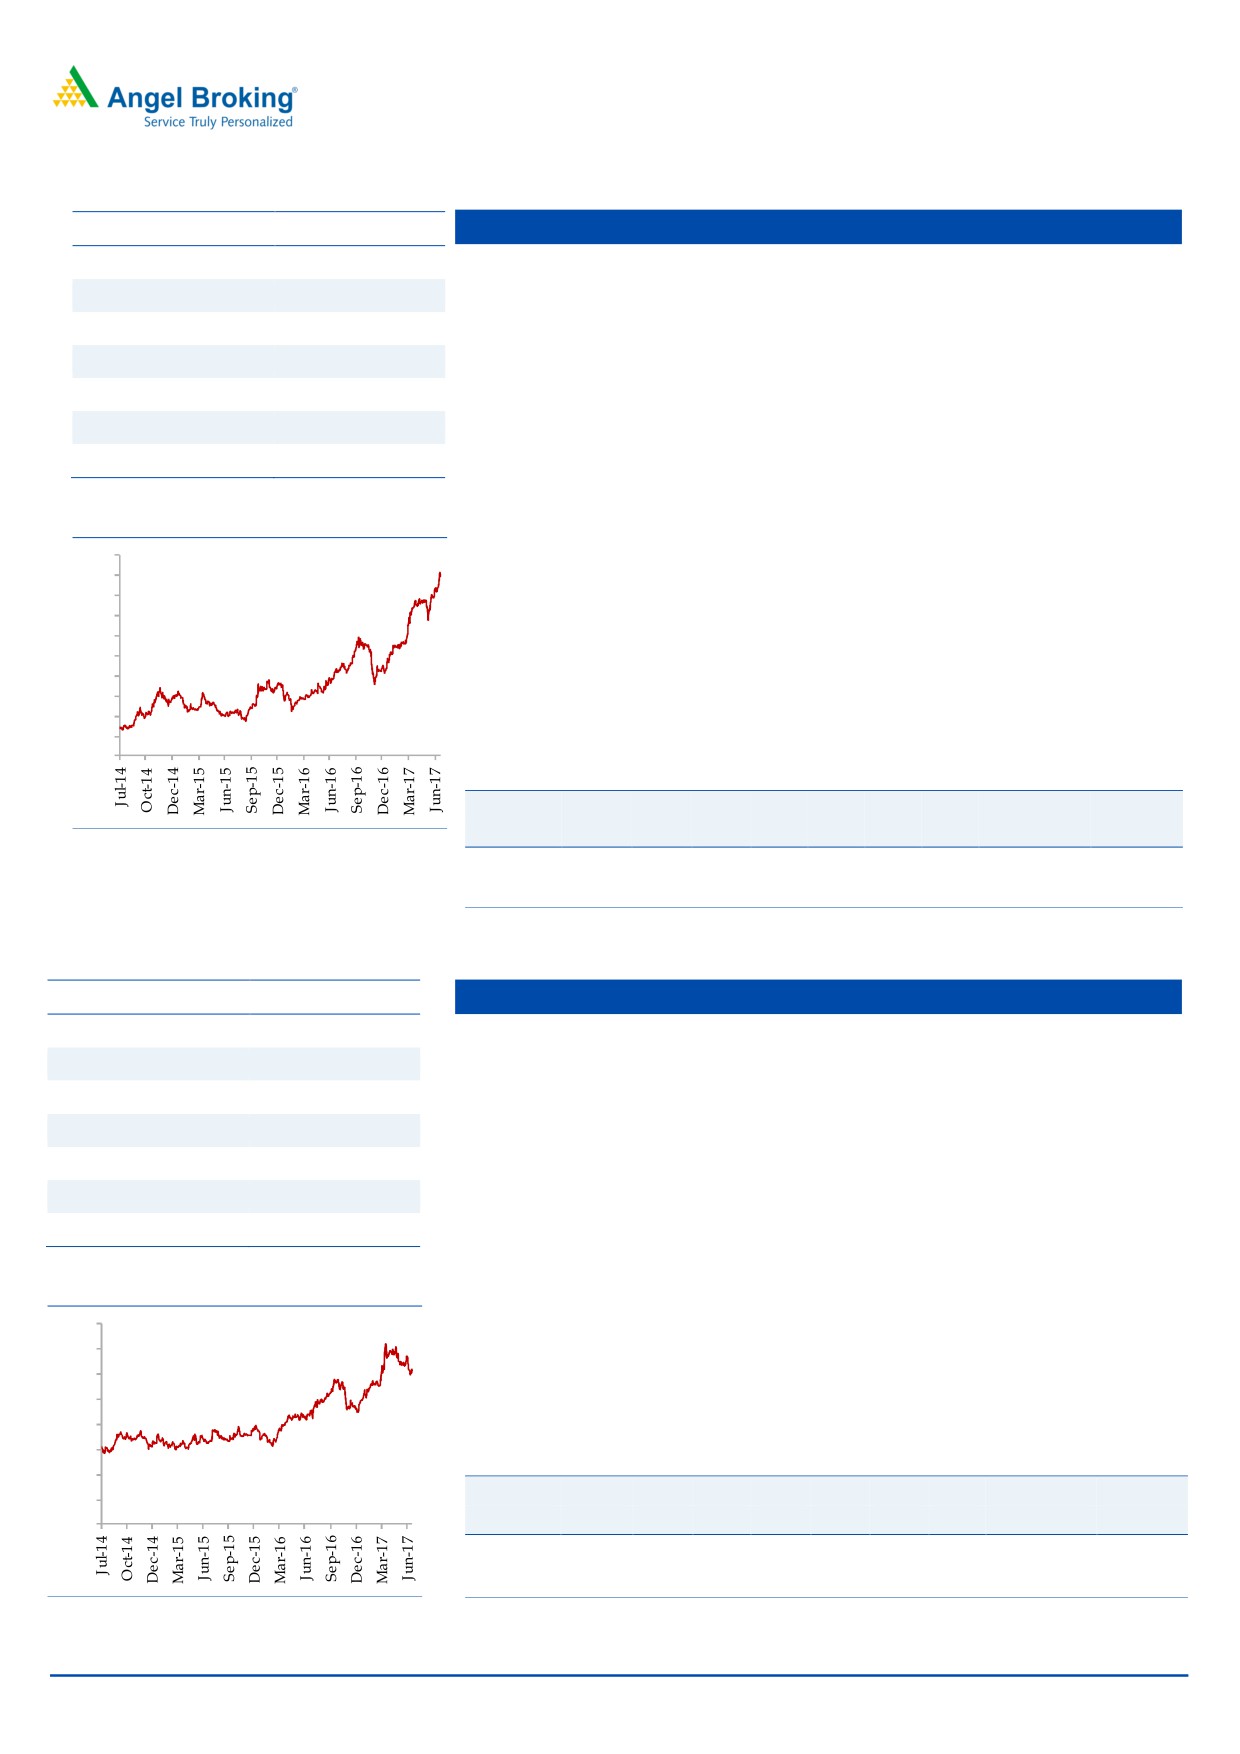
Karur Vysa Bank
CMP
144
Loan growth to pick up from FY18 onwards: KVB had a fairly strong loan
TP
160
CAGR of 14.9% over FY11-17.However, FY17 was year of consolidation and
Upside
11.1%
loan book grew by only 4.7%. We expect loan growth to pick up to 11% over
Sector
Banking
FY17-19. Deposit growth is expected at 9% during the period.
Market Cap (` cr)
8,847
Asset quality likely to stabilize going ahead: KVB’s slippages remained high
during FY17 and hence GNPAs % went up to 3.58% vs 1.3%. However, large
Beta
1.4
part of the troubled accounts has been classified as NPAs and hence gradually
52 Week High / Low
153 / 80
we expect the asset quality to improve.
NIM likely to see further improvement: There were 25 bps improvements in
3 year-Chart
NIM during FY17, with share of CASA growing and cost of fund coming down
160
NIM is expected to improve further going ahead.
140
Outlook: We expect KVB to post a strong loan book & earnings CAGR of 11%
120
100
& 22% over FY2017-19E. The stock currently trades at 1.6x FY2019E ABV. We
80
recommend Accumulate rating on the stock, with a target price of `160.
60
40
Key Financials
20
Y/E
Op. Inc NIM
PAT
EPS
ABV ROA ROE P/E P/ABV
-
March
(` cr)
(%)
(` cr)
(`)
(`)
(%)
(%)
(x)
(x)
FY2018E
3,169
3.7
769
12.6
78.2
1.2
14.4
11.4
1.8
FY2019E
3,598
3.9
907
14.9
89.3
1.3
15.2
9.6
1.6
Source: Company, Angel Research
Source: Company, Angel Research
July 6, 2017
3
Top Picks Report | July 2017
Stock Info
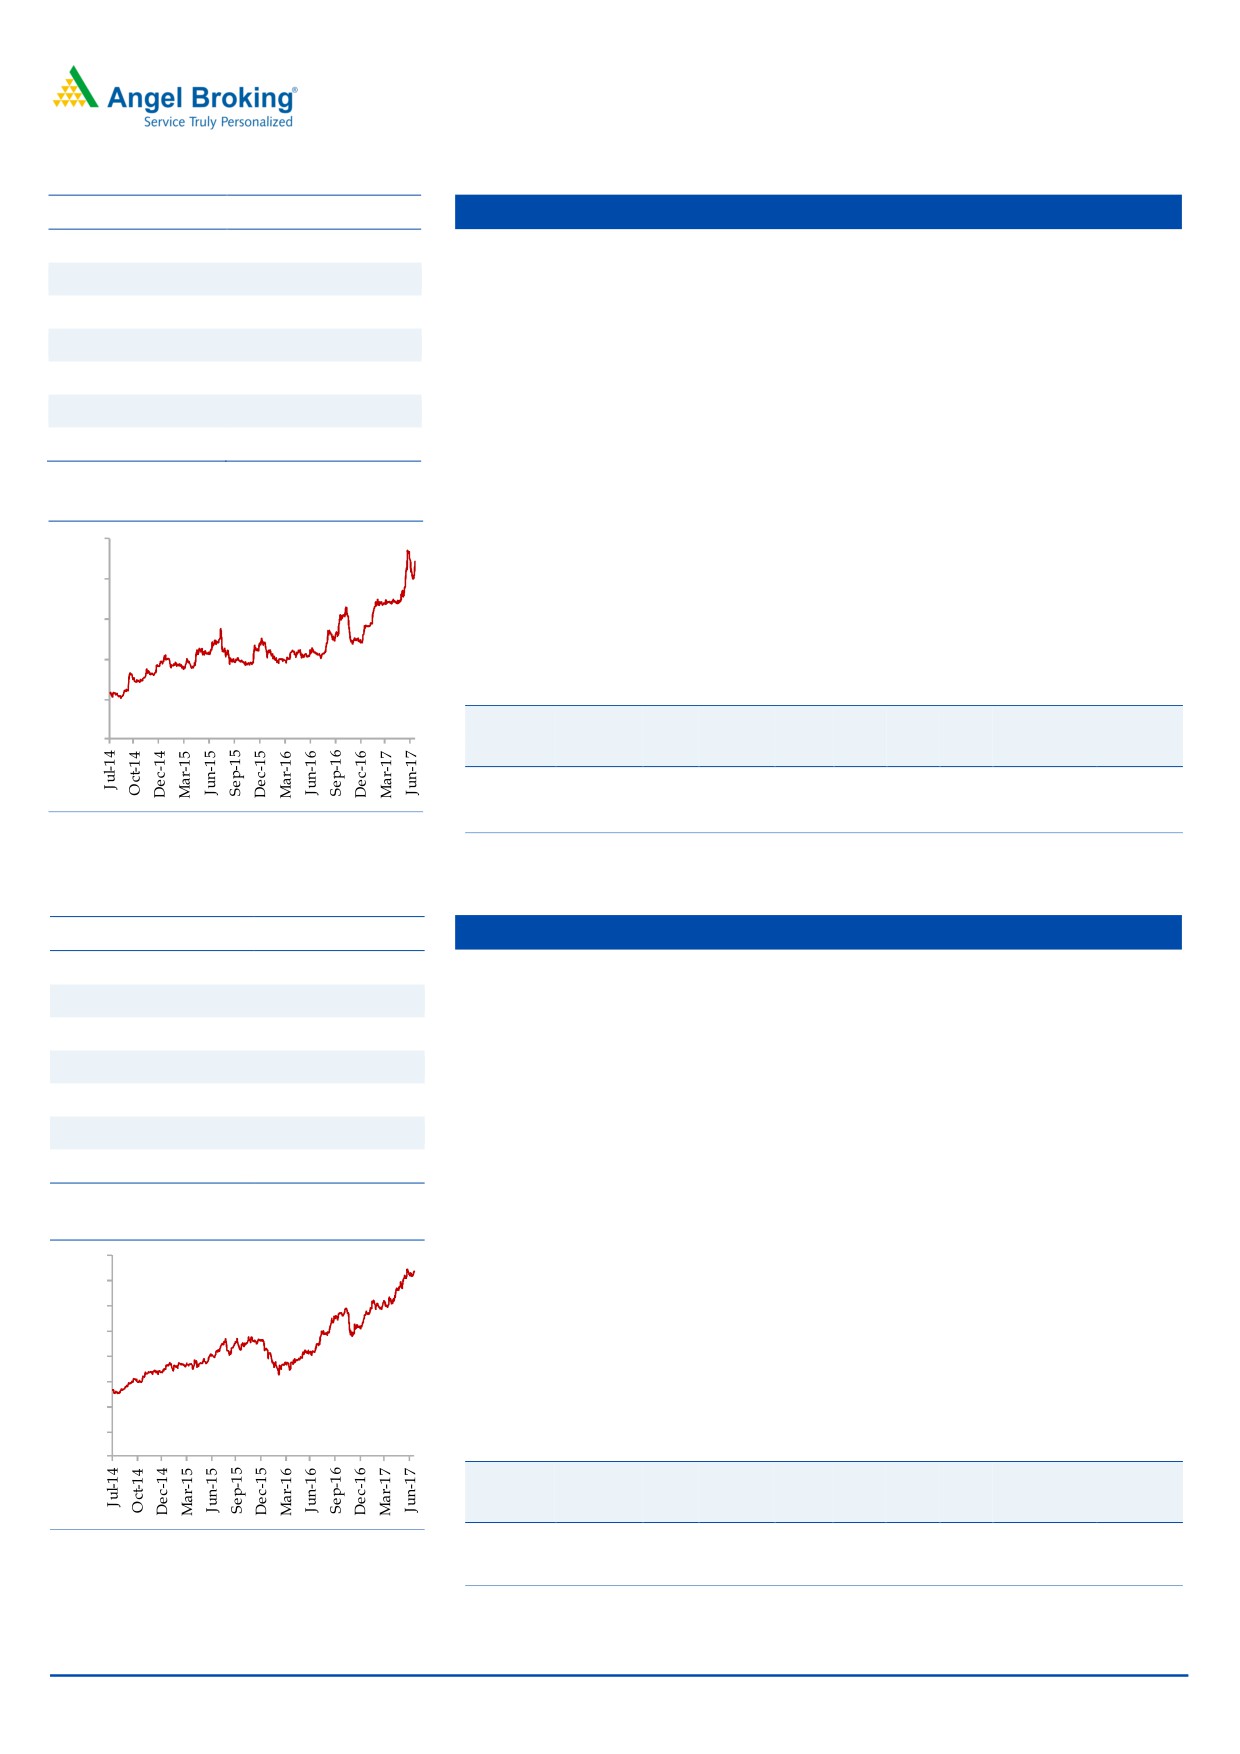
Asian Granito
CMP
446
AGIL’s current, vitrified sales (35%) are lower as compared to its peers like
TP
480
Somany Ceramics (47%) and Kajaria Ceramics (61%). Recently, AGIL has
Upside
7.6%
launched various products in premium segment. Going forward, we expect
AGIL’s profit margin to improve due to increase in focus for higher vitrified
Sector
Cons. Durable
product sales, which is a high margin business.
Market Cap (` cr)
1,341
AGIL is continuously putting efforts to increase the B2C sales from the current
Beta
1.9
level (35% in FY16). It is expected to reach up to 50% in next 2-3 years on the
52 Week High / Low
408 / 165
back of various initiatives taken by AGIL to increase direct interaction with customers
like strengthening distribution network, participation in key trade exhibition, etc.
3 year-Chart
In July FY2016, AGIL acquired Artistique Ceramic which has a better margin
500
profile. Going forward, we expect the company to improve its operating
450
margin from 7.5% in FY16 (excluding merger) to
12-12.5% in coming
400
financial year. Artisique Ceramics has a contract with RAS GAS to supply
350
300
quality natural gas at a discounted rate of 50% to current market rate, which
250
would reduce the overall power & fuel cost of the company.
200
We expect AGIL to report a net revenue CAGR of ~8.5% to ~`1,169cr and
150
100
net profit CAGR of ~39% to `48cr over FY2016-18E. We recommend an
50
Accumulate rating on the stock.
-
Key Financials
Y/E
Sales OPM PAT EPS ROE P/E P/BV EV/EBITDA EV/Sales
March
(` cr)
(%)
(` cr)
(`)
(%)
(x)
(x)
(x)
(x)
Source: Company, Angel Research
FY2017
1,060
11.6
39
13.0
9.7
34.3
3.3
13.7
1.6
FY2018E
1,169
12.5
48
16.0
10.7
27.9
3.0
10.7
1.4
Source: Company, Angel Research
Stock Info
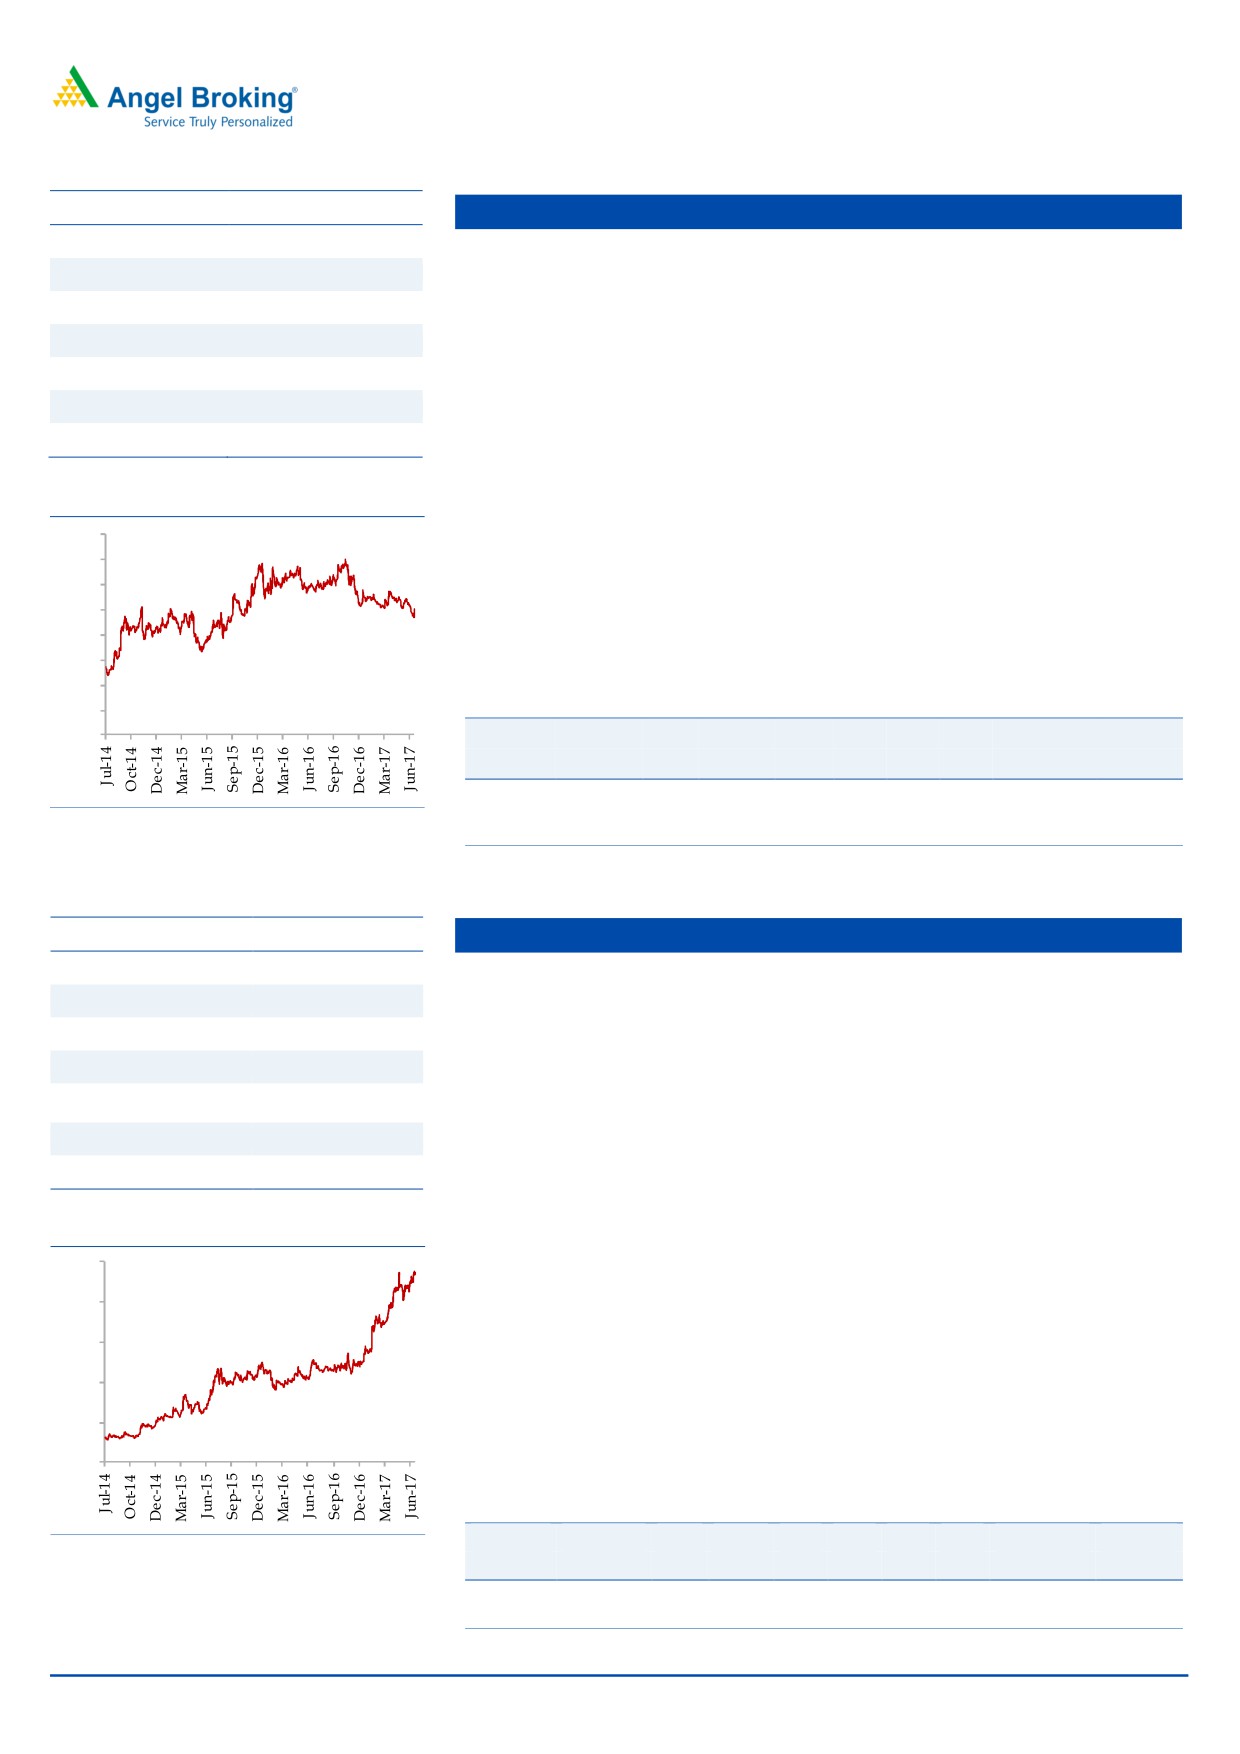
Blue Star
CMP
612
BSL is one of the largest air-conditioning companies in India. With a mere
TP
760
3% penetration level of ACs vs 25% in China, the overall outlook for the room
Upside
24.2%
air-conditioner (RAC) market in India is favourable.
Sector
Cons. Durable
BSL’s RAC business has been outgrowing the industry by ~10% points over the
last few quarters, resulting in the company consistently increasing its market
Market Cap (` cr)
5,849
share (~7% in FY2014 to 10.5% at present). This has resulted in the Cooling
Beta
0.8
Products Division (CPD)'s share in overall revenues increasing from~23% in
52 Week High / Low
725 / 403
FY2010 to ~42% in FY2016 (expected to improve to ~47% in FY2018E). With
strong brand equity and higher share in split ACs, we expect the CPD to
continue to drive growth.
3 year-Chart
Aided by increasing contribution from the CPD, we expect the overall top-line
800
to post a revenue CAGR of ~16% over FY2016-18E and margins to improve
700
from 5.3% in FY2015 to 7.3% in FY2018E. Moreover, the merger of Blue Star
600
Infotech has infused cash and strengthened the balance sheet. We
500
recommend a Buy rating on the stock.
400
300
Key Financials
200
Y/E
Sales OPM PAT EPS ROE P/E P/BV EV/EBITDA EV/Sales
100
-
March
(` cr)
(%)
(` cr)
(`)
(%)
(x)
(x)
(x)
(x)
FY2017
4,283
5.9
141
14.9
20.4
41
8
25
1.4
FY2018E
5,077
7.3
211
22.1
26.4
27.7
6.7
18.7
1.2
Source: Company, Angel Research
Source: Company, Angel Research
July 6, 2017
4
Top Picks Report | July 2017
Stock Info
Siyaram Silk Mills
CMP
2,200
SSML has strong brands which cater to premium as well as popular mass
TP
2,500
segments of the market. Further, SSML entered the ladies' salwar kameez and
Upside
13.6%
ethnic wear segment. Going forward, we believe that the company would be able to
Sector
Textile
leverage its brand equity and continue to post strong performance.
Market Cap (` cr)
2,062
The company has a nationwide network of about 1,600 dealers and business
partners. It has a retail network of 160 stores and plans to add another
Beta
0.9
300-350 stores going forward. Further, the company's brands are sold across
52 Week High / Low
2,150/994
3,00,000 multi brand outlets in the country.
Going forward, we expect SSML to report a net sales CAGR of ~4% to
3 year-Chart
~`1,948cr and adj.net profit CAGR of ~10% to `106cr over FY2016-18E on
2,500
back of market leadership in blended fabrics, strong brand building, wide
distribution channel, strong presence in tier II and tier III cities and emphasis
2,000
on latest designs and affordable pricing points. At the current market price,
1,500
SSML trades at an inexpensive valuation. We have an Accumulate
recommendation on the stock and target price of `2,376.
1,000
Key Financials
500
Y/E
Sales
OPM PAT EPS ROE P/E P/BV EV/EBITDA EV/Sales
-
March
(` cr)
(%)
(` cr)
(`)
(%)
(x)
(x)
(x)
(x)
FY2017
1,574
12.5
91
97.1
15.4
22.7
3.5
11.8
1.5
FY2018E
1,769
12.7
106
113.1
15.5
19.4
3.0
10.5
1.3
Source: Company, Angel Research
Source: Company, Angel Research
Stock Info
Maruti Suzuki
CMP
7,371
The Automobile sector is expected to benefit from the GST implementation.
TP
8,495
The sector has seen a pick up in the volumes in FY17 as there were several
Upside
15.2%
positive factors like normal monsoon and lower interest rates.
Sector
Automobiles
Maruti Suzuki continues to hold ~50% market share in the passenger vehicles.
Market Cap (` cr)
2,22,668
The launch of exciting models has helped the company to ride on the
premiumization wave that is happening in the country. In the last two years,
Beta
1.3
company has seen improvement in the business mix with the pie of the utility
52 Week High / Low
7,469/4,162
vehicles growing from ~4% to current 15%. With the 3-4 months of waiting
period on these models, strong demand and GST led price decrease; we
3 year-Chart
believe that this pie is expected to grow to ~20% in FY19E.
8,000
Due to the favorable business mix, company has also been seeing
7,000
improvement in the margins. Company has already moved from ~11-12%
6,000
EBITDA margin range to current ~14-15% margin ranges. Together with
5,000
higher operating leverage at Gujarat plant and improving business mix, we
4,000
believe that company has further room to improve its margins. We have a
3,000
buy rating on the stock with the price target of `8,495.
2,000
1,000
Key Financials
-
Y/E
Sales
OPM PAT EPS ROE P/E P/BV EV/EBITDA EV/Sales
March
(` cr)
(%)
(` cr)
(`)
(%)
(x)
(x)
(x)
(x)
FY2017
67,985
15.2
7,338
243.0
22.9
30.3
6.9
19.4
2.9
Source: Company, Angel Research
FY2018E
83,717
15.0
8,803
291.5
22.4
25.3
5.7
15.5
2.3
Source: Company, Angel Research
July 6, 2017
5
Top Picks Report | July 2017
Stock Info
TV Today Network
CMP
251
TTNL enjoys a strong viewership ranking in the Hindi and English news
TP
344
channel categories. The company’s Hindi news channel - Aaj Tak has
Upside
37.1%
maintained its market leadership position occupying the No.1 rank for several
Sector
Media
consecutive years in terms of viewership. Its English news channel - India
Today too has been continuously gaining viewership; it has now captured the
Market Cap (` cr)
1,497
No. 2 ranking from No. 4 earlier. Its other channels like Dilli Aaj Tak and Tez
Beta
0.7
are also popular among viewers.
52 Week High / Low
360 /248
Out of the 7 radio stations, TTNL has sold off 4 (Jodhpur, Amritsar, Patiala
and Shimla) for `4cr. The remaining 3 stations are in the process of getting
3 year-Chart
sold off to ENIL but the sale will have to wait until concerns raised by the MIB
400
are resolved. Going forward, we expect them to be sold off and this would
350
prop up the company’s profitability.
300
250
We expect TTNL to report a net revenue CAGR of ~10% to ~`667cr and net
200
profit CAGR of
~10% to
`115cr over FY2016-18E. We have a Buy
150
recommendation on the stock and target price of `344.
100
50
Key Financials
-
Y/E
Sales
OPM PAT EPS ROE P/E P/BV EV/EBITDA EV/Sales
March
(` cr)
(%)
(` cr)
(`)
(%)
(x)
(x)
(x)
(x)
FY2017
608
21.5
99
15.7
16.1
16
2.4
7.9
2.1
Source: Company, Angel Research
FY2018E
667
22.3
115
19.2
16.0
13
2.1
6.4
1.8
Source: Company, Angel Research
Stock Info
KEI Industries
CMP
234
Healthy order book indicates strong revenue visibility: KEI’s current order book
TP
258
(OB) stands at `3,233cr (segmental break-up: `2,154cr in EPC, `667cr in
Upside
10.2%
Cable, `200cr in EHV, `49cr in Substation, rest in EPC L1 business). Its OB
Sector
Cable
grew by ~28% in the last 3 years due to strong order inflows from State
Electricity Boards, Power grid, etc.
Market Cap (` cr)
1,822
Strengthening distribution network and higher ad Spend to increase B2C
Beta
1.3
business: KEI’s consistent effort to increase its retail business from 30% of
52 Week High / Low
238/ 94
revenue in FY16 to 40-45% of revenue in the next 2-3 years on the back of
strengthening distribution network (currently 926 which is expect to increase
3 year-Chart
`1,500 by FY19) and higher ad spend (increased from `2cr in FY13 to `7cr in
250
FY16 and expected to spend).
200
Exports to continue its growth momentum: KEI’s export (FY16 - 8% of revenue)
is expected to reach a level of ~14-15% in next two years with higher order
150
execution from current OB of
~`180cr and participation in various
100
international tenders worth `500cr. We expect a strong ~26% growth CAGR
over FY2016-19 in exports. We expect KEI to report net revenue CAGR of
50
~13% to ~`3,392cr and net profit CAGR of ~26% to `124cr over FY2016-
-
19E. Hence we have an accumulate rating on the stock.
Key Financials
Y/E
Sales
OPM PAT EPS ROE P/E P/BV EV/EBITDA EV/Sales
Source: Company, Angel Research
March
(` cr)
(%)
(` cr)
(`)
(%)
(x)
(x)
(x)
(x)
FY2017
2,633
10.4
98
12.7
21.4
18.4
3.9
9.2
0.9
FY2018E
3,001
10.0
100
13.0
18.2
18
3.3
8.5
0.8
Source: Company, Angel Research
July 6, 2017
6
Top Picks Report | July 2017
Stock Info
Mahindra Lifespace
CMP
439
MLF has 13 projects under implementation across cities. MLF has exhibited
TP
522
fast completion of projects compared to others. Sales cycle in ~65% of
Upside
18.9%
projects is faster than execution cycle, contrary to industry trends. This fast
Sector
Real Estate
execution and sales is optimal, as it helps MLF in revenue recognition,
inventory cycle (better than Oberoi, DLF), cash flows and profitability.
Market Cap (` cr)
2,251
MLF as of 4QFY2016 is pursuing ~4.0mn sq. ft. of sale of the total ~15.0mn
Beta
0.9
sq. ft. of saleable area. Having sold ~60% of ongoing projects, we expect MLF
52 Week High / Low
493 / 319
to launch ~2.8mn sq.ft. of saleable area in rational way during 4QFY2016-
2QFY2018E, across 6 cities. Maturity at existing projects, new launches give better
3 year-Chart
revenue visibility for medium-term. Further, MLF is sitting on land bank of 11.0mn
600
sq.ft across 4 cities, which allay any concern over long-term revenue growth.
500
With Real Estate Regulatory Bill closer to reality, MLF should be minimally
400
impacted, given their strong parentage and ethically implemented processes.
300
In the longer-term organized, professionally run, well funded players would
200
enjoy strong trust due to their reliable and fast execution strategies. With
100
improvement in company’s fundamentals, strong earnings growth visibility
-
and long-term growth outlook, at current valuations of 1.0x FY2017E P/BV,
MLF looks attractive. We maintain Buy on MLF with target price of `522.
Key Financials
Source: Company, Angel Research
Y/E
Sales
OPM PAT EPS ROE P/E P/BV EV/EBITDA EV/Sales
March
(` cr)
(%)
(` cr)
(`)
(%)
(x)
(x)
(x)
(x)
FY2017
1,152
22.7
75
29.9
7.6
14.7
1.1
12.1
2.3
FY2018E
1,300
24.6
138
35.8
8.6
12.3
1.0
8.9
1.9
Source: Company, Angel Research
Stock Info
Navkar
CMP
210
NCL is one of the largest and one of the three CFS at JNPT with rail
TP
265
connectivity, helping it garner high market share at the port. NCL is in a massive
Upside
26.3%
expansion mode where it is increasing its capacity by 234% to 1,036,889 TEUs
Sector
Logistics
at JNPT and coming up with an ICD at Vapi (with Logistics Park).
Market Cap (` cr)
2,993
The ICD with rail link should benefit from first mover advantage in a region
Beta
0.8
that has huge market potential and accounts for ~27% of volumes at JNPT.
52 Week High / Low
247 / 155
The ICD should be able to capture the EXIM volumes from the region through
rail link that till now was being custom cleared at JNPT (Import) or being
transported via road and consolidated at JNPT (Export). South Gujarat
3 year-Chart
volumes will now head straight to the Vapi ICD; thus the company can now
250
cater to bulk commodities and domestic traffic that it had been rejecting owing
200
to capacity constraints at CFS.
150
We expect NCL to successfully use its rail advantage and scale up its
100
utilizations at both JNPT and Vapi ICD. We have a Buy rating on the stock.
50
Key Financials
Y/E
Sales
OPM PAT EPS ROE P/E P/BV EV/EBITDA EV/Sales
-
March
(` cr)
(%)
(` cr)
(`)
(%)
(x)
(x)
(x)
(x)
FY2017
371
37.3
86
6.0
7.4
35
2.2
26.1
9.7
FY2018E
561
42.3
164
11.5
10.5
18.3
1.9
21.6
9.1
Source: Company, Angel Research
Source: Company, Angel Research
July 6, 2017
7
Top Picks Report | July 2017
Stock Info
Alkem Leboratories
CMP
1,832
Alkem is 5th largest pharma company is the domestic market and also has
TP
2,161
presence in US. It derives 73% of its revenues come from the Indian markets
Upside
17.7%
while rest come from the other countries. Alkem has leadership position in the
Sector
Pharma
domestic anti infective segment and it is ranked #3 in Gastro-Intestinal and
Pain/Analgesics segments. Company holds ~3.6% and ~7.9% market share
Market Cap (` cr)
21,907
in the formulations and overall prescriptions in the country.
Beta
0.3
In the domestic market, company operates in acute and chronic segments. It is
52 Week High / Low
2,238/ 1,342
a prominent player in acute segment has forayed in chronic segment from
which it expects faster growth. Alkem has been outperforming the domestic
3 year-Chart
industry growth which is likely to continue. Company is focusing on
2,000
monetization of its pipeline (91 ANDAs) in the US with annually ~7-8 ANDAs
1,800
1,600
launches growing the US revenues by ~26% growth rate from FY17-FY19E.
1,400
Overall outlook remains strong with 15.8% CAGR in the topline and 15.4%
1,200
1,000
CAGR in the bottom-line. We have Buy rating on the stock.
800
600
Key Financials
400
Y/E
Sales
OPM PAT EPS ROE P/E P/BV EV/EBITDA EV/Sales
200
-
March
(` cr)
(%)
(` cr)
(`)
(%)
(x)
(x)
(x)
(x)
FY2018E
6,901
18.4
1,016
85.0
20.2
21.6
4.4
17.2
3.2
FY2019E
7,850
19.1
1,202
100.5
20.1
18.2
3.7
14.5
2.8
Source: Company, Angel Research
Source: Company, Angel Research
July 6, 2017
8
Top Picks Report | July 2017
Macro watch
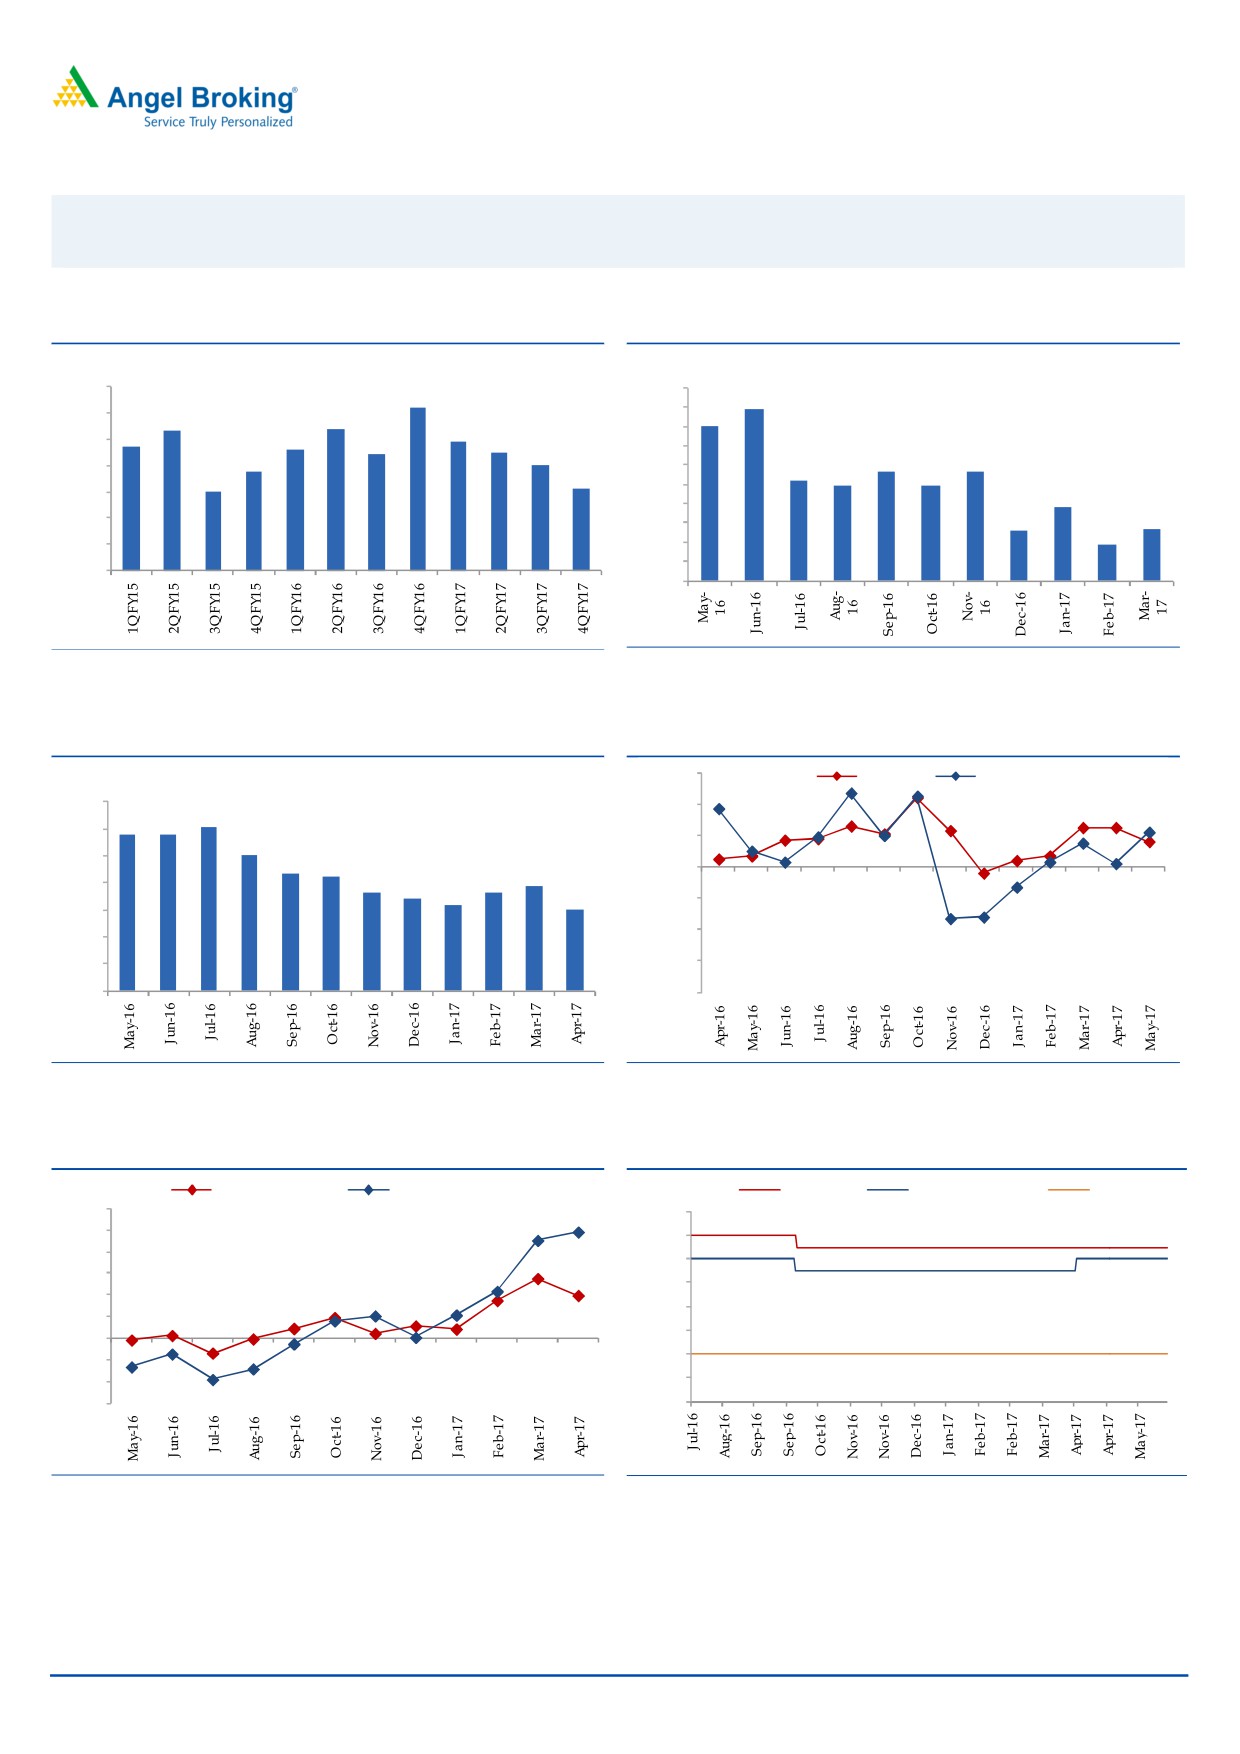
Exhibit 1: Quarterly GDP trends
Exhibit 2: IIP trends
(%)
(%)
10.0
9.2
10.0
8.9
9.0
8.3
8.4
9.0
8.0
7.7
7.9
8.0
7.6
7.5
8.0
7.4
7.0
7.0
6.8
5.7
5.7
6.0
5.2
7.0
4.9
4.9
6.0
6.1
6.0
5.0
3.8
4.0
2.6
2.7
5.0
3.0
1.9
4.0
2.0
1.0
3.0
-
Source: CSO, Angel Research
Source: MOSPI, Angel Research
Exhibit 3: Monthly CPI inflation trends
Exhibit 4: Manufacturing and services PMI
56.0
Mfg. PMI
Services PMI
(%)
7.0
54.0
6.1
5.8
5.8
6.0
5.1
52.0
5.0
4.3
4.2
3.9
50.0
3.6
3.7
4.0
3.4
3.2
3.0
48.0
3.0
46.0
2.0
1.0
44.0
-
42.0
Source: MOSPI, Angel Research
Source: Market, Angel Research; Note: Level above 50 indicates expansion
Exhibit 5: Exports and imports growth trends
Exhibit 6: Key policy rates
(%)
Exports yoy growth
Imports yoy growth
(%)
Repo rate
Reverse Repo rate
CRR
60.0
7.00
50.0
6.50
40.0
6.00
30.0
5.50
20.0
5.00
10.0
4.50
0.0
4.00
(10.0)
(20.0)
3.50
(30.0)
3.00
Source: Bloomberg, Angel Research
Source: RBI, Angel Research
July 6, 2017
9
Top Picks Report | July 2017
Global watch
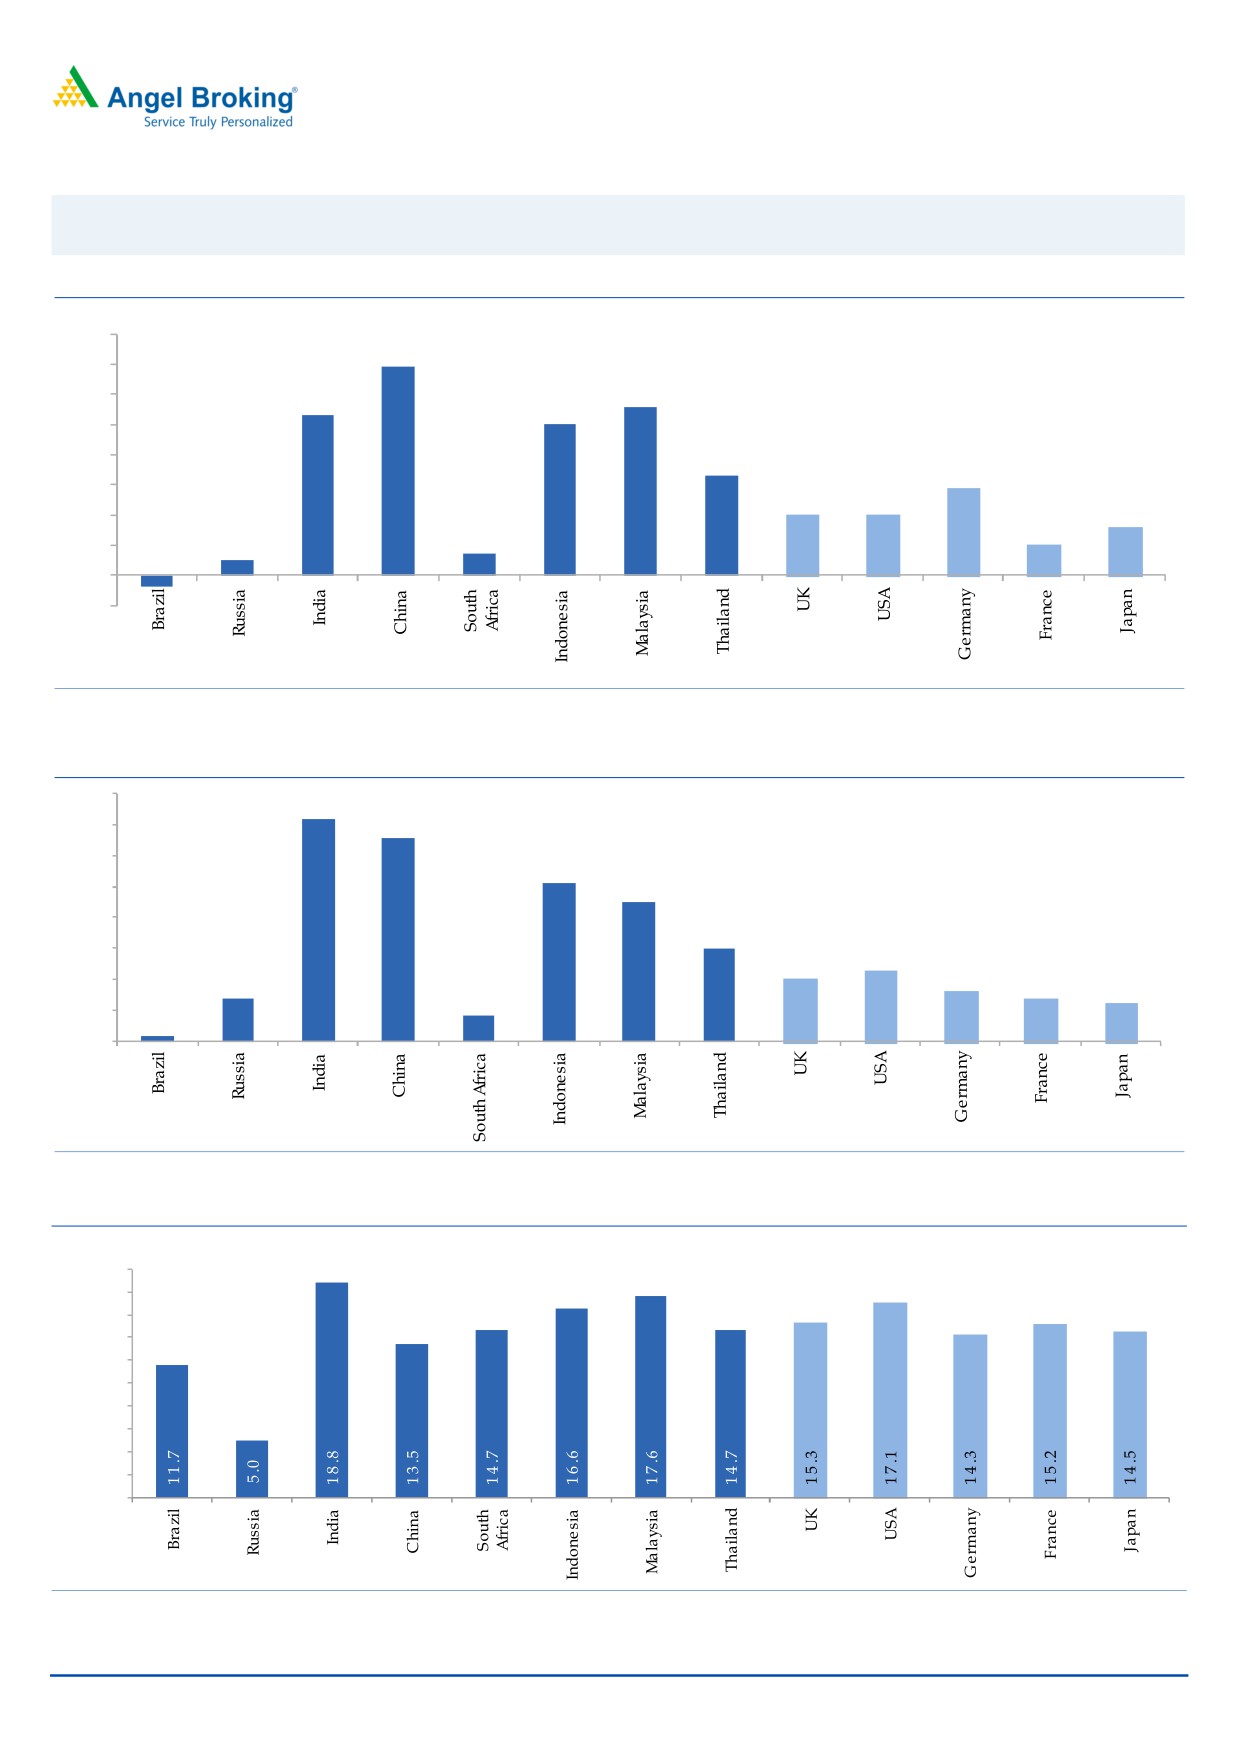
Exhibit 8: Latest quarterly GDP Growth (%, yoy) across select developing and developed countries
(%)
8.0
6.9
7.0
5.6
6.0
5.3
5.0
5.0
0.7
4.0
3.3
2.9
3.0
2.0
2.0
2.0
0.5
1.6
1.0
1.0
-
(1.0)
(0.4)
Source: Bloomberg, Angel Research
Exhibit 9: 2017 GDP Growth projection by IMF (%, yoy) across select developing and developed countries
(%)
7.2
6.6
7.0
6.0
5.1
5.0
4.5
4.0
3.0
3.0
2.3
2.0
1.4
1.6
2.0
1.4
1.2
0.2
0.8
1.0
-
Source: IMF, Angel Research
Exhibit 10: One year forward P-E ratio across select developing and developed countries
(x)
20.0
18.0
16.0
14.0
12.0
10.0
8.0
6.0
4.0
2.0
-
Source: IMF, Angel Research
July 6, 2017
10
Top Picks Report | July 2017
Exhibit 11: Relative performance of indices across globe
Returns (%)
Country
Name of index
Closing price
1M
3M
1YR
Brazil
Bovespa
62,511
(5.4)
(6.7)
27.5
Russia
Micex
1,882
(6.7)
(7.6)
(1.8)
India
Nifty
9,654
3.7
8.7
18.0
China
Shanghai Composite
3,106
(1.6)
(3.8)
10.6
South Africa
Top 40
46,523
(0.8)
4.6
(3.0)
Mexico
Mexbol
49,317
0.4
5.3
7.4
Indonesia
LQ45
961
1.6
7.8
19.4
Malaysia
KLCI
1,777
(0.1)
3.6
8.9
Thailand
SET 50
990
(0.3)
1.5
10.8
USA
Dow Jones
21,206
1.2
1.0
19.1
UK
FTSE
7,548
4.1
3.9
20.3
Japan
Nikkei
20,177
5.1
5.5
20.3
Germany
DAX
12,823
2.4
6.3
27.1
France
CAC
5,343
0.8
7.7
24.1
Source: Bloomberg, Angel Research
July 6, 2017
11
Top Picks Report | July 2017
Stock Watch
July 6, 2017
12
Top Picks Report
July 06, 2017
Company Name
Reco
CMP
Target
Mkt Cap
Sales ( Čcr )
OPM(%)
EPS (Č)
PER(x)
P/BV(x)
RoE(%)
EV/Sales(x)
(Č)
Price ( Č)
( Č cr )
FY17E FY18E
FY17E
FY18E
FY17E
FY18E
FY17E
FY18E
FY17E
FY18E
FY17E
FY18E
FY17E
FY18E
Agri / Agri Chemical
Rallis
Reduce
244
209
4,752
1,937
2,164
13.3
14.3
9.0
11.0
27.2
22.2
4.7
4.1
18.4
19.8
2.5
2.2
United Phosphorus
Neutral
853
-
43,338
15,176
17,604
18.5
18.5
37.4
44.6
22.8
19.1
4.5
3.7
21.4
21.2
3.0
2.5
Auto & Auto Ancillary
Ashok Leyland
Accumulate
102
116
29,748
20,019
22,789
11.1
11.7
4.3
5.5
23.7
18.6
4.6
4.1
19.4
22.0
1.4
1.2
Bajaj Auto
Neutral
2,772
-
80,207
25,093
27,891
19.5
19.2
143.9
162.5
19.3
17.1
5.4
4.6
30.3
29.4
2.9
2.6
Bharat Forge
Neutral
1,111
-
25,869
7,726
8,713
20.5
21.2
35.3
42.7
31.5
26.0
5.8
5.3
18.9
20.1
3.4
3.0
Eicher Motors
Neutral
28,067
-
76,404
16,583
20,447
17.5
18.0
598.0
745.2
46.9
37.7
16.0
12.2
41.2
38.3
4.4
3.5
Gabriel India
Neutral
149
-
2,142
1,544
1,715
9.0
9.3
5.4
6.3
27.6
23.7
5.2
4.6
18.9
19.5
1.3
1.2
Hero Motocorp
Neutral
3,707
-
74,029
28,120
30,753
15.2
15.6
169.1
189.2
21.9
19.6
7.6
6.3
30.8
28.2
2.5
2.2
Jamna Auto Industries Neutral
267
-
2,130
1,486
1,620
9.8
9.9
15.0
17.2
17.8
15.5
3.9
3.3
21.8
21.3
1.5
1.4
L G Balakrishnan & Bros Neutral
772
-
1,212
1,302
1,432
11.6
11.9
43.7
53.0
17.7
14.6
2.5
2.3
13.8
14.2
1.0
0.9
Mahindra and Mahindra Neutral
1,385
-
86,024
46,534
53,077
11.6
11.7
67.3
78.1
20.6
17.7
3.3
2.9
15.4
15.8
1.8
1.6
Maruti
Buy
7,371
8,495
222,668
67,822
83,717
15.2
15.0
243.0
291.5
30.3
25.3
6.9
5.7
22.9
22.4
3.0
2.3
Minda Industries
Neutral
672
-
5,806
2,728
3,042
9.0
9.1
68.2
86.2
9.9
7.8
2.2
1.8
23.8
24.3
2.2
1.9
Motherson Sumi
Neutral
306
-
64,353
45,896
53,687
7.8
8.3
13.0
16.1
23.4
19.0
7.6
6.0
34.7
35.4
1.5
1.2
Rane Brake Lining
Neutral
1,342
-
1,062
511
562
11.3
11.5
28.1
30.9
47.8
43.4
7.3
6.6
15.3
15.0
2.2
2.0
Setco Automotive
Neutral
40
-
536
741
837
13.0
13.0
15.2
17.0
2.6
2.4
0.4
0.4
15.8
16.3
1.1
1.0
Tata Motors
Neutral
432
-
124,748
300,209
338,549
8.9
8.4
42.7
54.3
10.1
8.0
1.6
1.4
15.6
17.2
0.5
0.5
TVS Motor
Neutral
547
-
26,004
13,390
15,948
6.9
7.1
12.8
16.5
42.9
33.1
10.7
8.5
26.3
27.2
2.0
1.6
Amara Raja Batteries
Accumulate
848
962
14,480
5,339
6,220
15.9
15.3
28.0
32.3
30.3
26.2
5.8
4.9
19.1
18.5
2.7
2.3
Exide Industries
Neutral
228
-
19,389
7,439
8,307
15.0
15.0
8.1
9.3
28.2
24.5
3.9
3.5
14.3
16.7
2.2
2.0
Apollo Tyres
Neutral
255
-
12,967
12,877
14,504
14.3
13.9
21.4
23.0
11.9
11.1
1.9
1.6
16.4
15.2
1.2
1.1
Ceat
Neutral
1,865
-
7,545
7,524
8,624
13.0
12.7
131.1
144.3
14.2
12.9
2.6
2.2
19.8
18.6
1.1
0.9
JK Tyres
Neutral
170
-
3,852
7,455
8,056
15.0
15.0
21.8
24.5
7.8
6.9
1.6
1.3
22.8
21.3
0.6
0.6
Swaraj Engines
Neutral
2,348
-
2,916
660
810
15.2
16.4
54.5
72.8
43.1
32.3
13.4
12.2
31.5
39.2
4.2
3.4
Subros
Neutral
253
-
1,519
1,488
1,681
11.7
11.9
6.4
7.2
39.6
35.3
4.2
3.8
10.8
11.4
1.3
1.1
Indag Rubber
Neutral
210
-
551
286
326
19.8
16.8
11.7
13.3
17.9
15.7
3.0
2.8
17.8
17.1
1.6
1.4
Capital Goods
ACE
Neutral
73
-
723
709
814
4.1
4.6
1.4
2.1
52.2
34.8
2.2
2.0
4.4
6.0
1.2
1.0
BEML
Neutral
1,568
-
6,530
3,451
4,055
6.3
9.2
31.4
57.9
49.9
27.1
3.0
2.7
6.3
10.9
2.0
1.7
Bharat Electronics
Neutral
170
-
37,882
8,137
9,169
16.8
17.2
58.7
62.5
2.9
2.7
0.5
0.4
44.6
46.3
3.6
3.3
Top Picks Report
July 06, 2017
Company Name
Reco
CMP
Target
Mkt Cap
Sales ( Čcr )
OPM(%)
EPS (Č)
PER(x)
P/BV(x)
RoE(%)
EV/Sales(x)
(Č)
Price ( Č)
( Č cr )
FY17E
FY18E
FY17E
FY18E
FY17E
FY18E
FY17E
FY18E
FY17E
FY18E
FY17E
FY18E
FY17E
FY18E
Capital Goods
Voltas
Neutral
475
-
15,725
6,511
7,514
7.9
8.7
12.9
16.3
36.8
29.2
6.6
5.8
16.7
18.5
2.2
1.8
BGR Energy
Neutral
154
-
1,109
16,567
33,848
6.0
5.6
7.8
5.9
19.7
26.1
1.1
1.1
4.7
4.2
0.2
0.1
BHEL
Neutral
134
-
32,859
28,797
34,742
-
2.8
2.3
6.9
58.4
19.5
1.0
1.0
1.3
4.8
0.8
0.6
Blue Star
Buy
612
760
5,849
4,283
5,077
5.9
7.3
14.9
22.1
41.1
27.6
8.0
6.7
20.4
26.4
1.4
1.2
CG Power and Industrial
Neutral
83
-
5,202
5,777
6,120
5.9
7.0
3.3
4.5
25.2
18.4
1.1
1.1
4.4
5.9
0.9
0.7
Solutions
Greaves Cotton
Neutral
160
-
3,916
1,755
1,881
16.8
16.9
7.8
8.5
20.6
18.9
4.1
3.8
20.6
20.9
1.9
1.8
Inox Wind
Neutral
146
-
3,239
5,605
6,267
15.7
16.4
24.8
30.0
5.9
4.9
1.6
1.2
25.9
24.4
0.6
0.5
KEC International
Neutral
257
-
6,608
9,294
10,186
7.9
8.1
9.9
11.9
26.0
21.6
3.8
3.3
15.6
16.3
0.9
0.9
KEI Industries
Accumulate
234
258
1,822
2,633
3,001
10.4
10.0
12.7
13.0
18.4
18.0
3.9
3.3
21.4
18.2
0.9
0.8
Thermax
Neutral
935
-
11,138
5,421
5,940
7.3
7.3
25.7
30.2
36.4
31.0
4.4
4.0
12.2
13.1
1.9
1.8
VATech Wabag
Neutral
680
-
3,712
3,136
3,845
8.9
9.1
26.0
35.9
26.2
18.9
3.3
2.8
13.4
15.9
1.1
0.9
Cement
ACC
Neutral
1,596
-
29,977
11,225
13,172
13.2
16.9
44.5
75.5
35.9
21.1
3.4
3.1
11.2
14.2
2.7
2.3
Ambuja Cements
Neutral
252
-
50,118
9,350
10,979
18.2
22.5
5.8
9.5
43.5
26.6
3.7
3.3
10.2
12.5
5.4
4.6
India Cements
Neutral
205
-
6,331
4,364
4,997
18.5
19.2
7.9
11.3
26.0
18.2
1.9
1.8
8.0
8.5
2.2
1.9
JK Cement
Neutral
980
-
6,851
4,398
5,173
15.5
17.5
31.2
55.5
31.4
17.7
3.8
3.3
12.0
15.5
2.1
1.8
J K Lakshmi Cement
Neutral
475
-
5,586
2,913
3,412
14.5
19.5
7.5
22.5
63.3
21.1
3.9
3.3
12.5
18.0
2.5
2.1
Orient Cement
Neutral
152
-
3,121
2,114
2,558
18.5
20.5
8.1
11.3
18.8
13.5
2.8
2.3
9.0
14.0
2.1
1.6
UltraTech Cement
Neutral
4,080
-
112,001
25,768
30,385
21.0
23.5
111.0
160.0
36.8
25.5
4.7
4.1
13.5
15.8
4.4
3.7
Construction
ITNL
Neutral
98
-
3,230
8,946
10,017
31.0
31.6
8.1
9.1
12.1
10.8
0.5
0.5
4.2
5.0
3.7
3.4
KNR Constructions
Neutral
207
-
2,911
1,385
1,673
14.7
14.0
41.2
48.5
5.0
4.3
0.9
0.8
14.9
15.2
2.2
1.8
Larsen & Toubro
Neutral
1,696
-
158,265
111,017
124,908
11.0
11.0
61.1
66.7
27.8
25.4
3.3
3.1
13.1
12.9
2.5
2.3
Gujarat Pipavav Port
Neutral
150
-
7,252
705
788
52.2
51.7
5.0
5.6
30.0
26.8
3.0
2.7
11.2
11.2
9.9
8.4
Nagarjuna Const.
Neutral
91
-
5,034
8,842
9,775
9.1
8.8
5.3
6.4
17.1
14.2
1.4
1.2
8.2
9.1
0.7
0.6
PNC Infratech
Neutral
144
-
3,695
2,350
2,904
13.1
13.2
9.0
8.8
16.0
16.4
0.6
0.5
15.9
13.9
1.7
1.4
Simplex Infra
Neutral
556
-
2,751
6,829
7,954
10.5
10.5
31.4
37.4
17.7
14.9
1.8
1.7
9.9
13.4
0.8
0.7
Power Mech Projects
Neutral
589
-
867
1,801
2,219
12.7
14.6
72.1
113.9
8.2
5.2
1.5
1.3
16.8
11.9
0.5
0.4
Sadbhav Engineering
Neutral
305
-
5,228
3,598
4,140
10.3
10.6
9.0
11.9
33.9
25.6
3.5
3.1
9.9
11.9
1.7
1.5
NBCC
Neutral
206
-
18,549
7,428
9,549
7.9
8.6
8.2
11.0
25.1
18.7
1.3
1.0
28.2
28.7
2.2
1.7
MEP Infra
Neutral
126
-
2,051
1,877
1,943
30.6
29.8
3.0
4.2
42.1
30.0
20.4
13.7
0.6
0.6
2.5
2.3
Top Picks Report
July 06, 2017
Company Name
Reco
CMP
Target
Mkt Cap
Sales ( Čcr )
OPM(%)
EPS (Č)
PER(x)
P/BV(x)
RoE(%)
EV/Sales(x)
(Č)
Price ( Č)
( Č cr )
FY17E
FY18E
FY17E
FY18E
FY17E
FY18E
FY17E
FY18E
FY17E
FY18E
FY17E
FY18E
FY17E
FY18E
Construction
SIPL
Neutral
110
-
3,874
1,036
1,252
65.5
66.2
(8.4)
(5.6)
4.1
4.7
(22.8)
(15.9)
12.0
9.9
Engineers India
Neutral
157
-
10,570
1,725
1,935
16.0
19.1
11.4
13.9
13.8
11.3
1.9
1.8
13.4
15.3
5.1
4.5
Financials
Axis Bank
Accumulate
514
580
123,154
46,932
53,575
3.5
3.4
32.4
44.6
15.9
11.5
2.0
1.8
13.6
16.5
-
-
Bank of Baroda
Neutral
161
-
37,062
19,980
23,178
1.8
1.8
11.5
17.3
14.0
9.3
1.6
1.3
8.3
10.1
-
-
Canara Bank
Neutral
333
-
19,866
15,225
16,836
1.8
1.8
14.5
28.0
22.9
11.9
1.6
1.3
5.8
8.5
-
-
Can Fin Homes
Neutral
3,231
-
8,600
420
526
3.5
3.5
86.5
107.8
37.4
30.0
8.0
6.6
23.6
24.1
-
-
Cholamandalam Inv. &
Accumulate
1,117
1,230
17,459
2,012
2,317
6.3
6.3
42.7
53.6
26.2
20.8
4.1
3.6
16.9
18.3
-
-
Fin. Co.
Dewan Housing Finance Buy
436
520
13,665
2,225
2,688
2.9
2.9
29.7
34.6
14.7
12.6
2.4
1.6
16.1
14.8
-
-
Equitas Holdings
Buy
159
235
5,368
939
1,281
11.7
11.5
5.8
8.2
27.4
19.4
2.4
2.1
10.9
11.5
-
-
Federal Bank
Accumulate
115
125
22,286
8,259
8,995
3.0
3.0
4.3
5.6
26.7
20.5
2.3
2.1
8.5
10.1
-
-
HDFC
Neutral
1,629
-
259,546
11,475
13,450
3.4
3.4
45.3
52.5
36.0
31.0
6.9
6.1
20.2
20.5
-
-
HDFC Bank
Neutral
1,651
-
424,845
46,097
55,433
4.5
4.5
58.4
68.0
28.3
24.3
5.0
4.1
18.8
18.6
-
-
ICICI Bank
Accumulate
293
315
187,639
42,800
44,686
3.1
3.3
18.0
21.9
16.3
13.4
2.2
2.0
11.1
12.3
-
-
Karur Vysya Bank
Accumulate
144
160
8,684
5,640
6,030
3.3
3.2
8.9
10.0
16.2
14.4
1.7
1.6
11.2
11.4
-
-
Lakshmi Vilas Bank
Neutral
208
-
3,981
3,339
3,799
2.7
2.8
11.0
14.0
18.9
14.8
2.0
1.8
11.2
12.7
-
-
LIC Housing Finance
Neutral
752
-
37,943
3,712
4,293
2.6
2.5
39.0
46.0
19.3
16.3
3.6
3.1
19.9
20.1
-
-
Punjab Natl.Bank
Neutral
137
-
29,164
23,532
23,595
2.3
2.4
6.8
12.6
20.2
10.9
3.1
2.2
3.3
6.5
-
-
RBL Bank
Neutral
524
-
19,744
1,783
2,309
2.6
2.6
12.7
16.4
41.3
32.0
4.5
4.0
12.8
13.3
-
-
Repco Home Finance
Neutral
811
-
5,074
388
457
4.5
4.2
30.0
38.0
27.0
21.3
4.5
3.8
18.0
19.2
-
-
South Ind.Bank
Neutral
28
-
5,004
6,435
7,578
2.5
2.5
2.7
3.1
10.3
9.0
1.3
1.1
10.1
11.2
-
-
St Bk of India
Neutral
275
-
237,381
88,650
98,335
2.6
2.6
13.5
18.8
20.4
14.6
1.9
1.7
7.0
8.5
-
-
Union Bank
Neutral
149
-
10,267
13,450
14,925
2.3
2.3
25.5
34.5
5.9
4.3
0.9
0.7
7.5
10.2
-
-
Yes Bank
Neutral
1,504
-
68,818
8,978
11,281
3.3
3.4
74.0
90.0
20.3
16.7
3.9
3.3
17.0
17.2
-
-
FMCG
Akzo Nobel India
Neutral
1,833
-
8,791
2,955
3,309
13.3
13.7
57.2
69.3
32.1
26.4
10.5
8.8
32.7
33.3
2.8
2.4
Asian Paints
Neutral
1,126
-
108,034
17,128
18,978
16.8
16.4
19.1
20.7
59.0
54.4
20.5
19.4
34.8
35.5
6.2
5.6
Britannia
Neutral
3,733
-
44,800
9,594
11,011
14.6
14.9
80.3
94.0
46.5
39.7
19.1
14.8
41.2
-
4.5
3.9
Colgate
Neutral
1,114
-
30,306
4,605
5,149
23.4
23.4
23.8
26.9
46.8
41.4
25.9
20.3
64.8
66.8
6.5
5.8
Dabur India
Neutral
298
-
52,449
8,315
9,405
19.8
20.7
8.1
9.2
36.8
32.4
10.2
8.5
31.6
31.0
6.0
5.2
GlaxoSmith Con*
Neutral
5,504
-
23,146
4,350
4,823
21.2
21.4
179.2
196.5
30.7
28.0
8.2
6.9
27.1
26.8
4.7
4.2
Top Picks Report
July 06, 2017
Company Name
Reco
CMP
Target
Mkt Cap
Sales ( Čcr )
OPM(%)
EPS (Č)
PER(x)
P/BV(x)
RoE(%)
EV/Sales(x)
(Č)
Price ( Č)
( Č cr )
FY17E FY18E
FY17E
FY18E
FY17E
FY18E
FY17E
FY18E
FY17E
FY18E
FY17E
FY18E
FY17E
FY18E
FMCG
Godrej Consumer
Neutral
983
-
66,928
10,235
11,428
18.4
18.6
41.1
44.2
23.9
22.2
5.3
4.5
24.9
24.8
6.6
5.9
HUL
Neutral
1,097
-
237,507
35,252
38,495
17.8
17.8
20.7
22.4
53.2
49.0
50.8
43.6
95.6
88.9
6.6
6.0
ITC
Neutral
331
-
402,139
40,059
44,439
38.3
39.2
9.0
10.1
36.9
32.7
10.3
9.0
27.8
27.5
9.5
8.6
Marico
Neutral
325
-
41,934
6,430
7,349
18.8
19.5
6.4
7.7
50.8
42.2
15.3
12.9
33.2
32.5
6.3
5.5
Nestle*
Neutral
6,908
-
66,606
10,073
11,807
20.7
21.5
124.8
154.2
55.4
44.8
22.7
20.4
34.8
36.7
6.4
5.5
Tata Global
Neutral
156
-
9,855
8,675
9,088
9.8
9.8
7.4
8.2
21.1
19.0
1.7
1.6
7.9
8.1
1.1
1.0
Procter & Gamble
Neutral
8,050
-
26,131
2,939
3,342
23.2
23.0
146.2
163.7
55.1
49.2
13.9
11.6
25.3
23.5
8.4
7.3
Hygiene
IT
HCL Tech^
Buy
836
1,014
119,261
46,723
52,342
22.1
20.9
60.0
62.8
13.9
13.3
3.5
3.0
25.3
22.4
2.3
1.9
Infosys
Buy
951
1,179
218,451
68,484
73,963
26.0
26.0
63.0
64.0
15.1
14.9
3.2
2.9
20.8
19.7
2.9
2.5
TCS
Accumulate
2,358
2,651
464,578
117,966
127,403
27.5
27.6
134.3
144.5
17.6
16.3
5.2
4.9
29.8
29.7
3.6
3.3
Tech Mahindra
Buy
378
533
36,872
29,141
31,051
14.4
15.0
32.3
35.6
11.7
10.6
2.0
1.8
17.1
17.0
1.1
1.0
Wipro
Accumulate
258
280
125,328
55,421
58,536
20.3
20.3
35.1
36.5
7.3
7.1
1.3
1.1
19.2
14.6
1.7
1.4
Media
D B Corp
Neutral
382
-
7,026
2,297
2,590
27.4
28.2
21.0
23.4
18.2
16.3
4.2
3.7
23.7
23.1
2.9
2.5
HT Media
Neutral
82
-
1,904
2,693
2,991
12.6
12.9
7.9
9.0
10.4
9.1
0.9
0.8
7.8
8.3
0.3
0.2
Jagran Prakashan
Buy
184
225
6,017
2,283
2,555
28.0
28.0
10.6
12.3
17.3
15.0
3.7
3.2
21.4
21.4
2.6
2.3
Sun TV Network
Neutral
824
-
32,465
2,850
3,265
70.1
71.0
26.2
30.4
31.4
27.1
8.0
7.1
24.3
25.6
11.0
9.5
Hindustan Media
Neutral
274
-
2,012
1,016
1,138
24.3
25.2
27.3
30.1
10.0
9.1
1.9
1.7
16.2
15.8
1.3
1.1
Ventures
TV Today Network
Buy
251
344
1,497
608
667
21.5
22.3
15.7
19.2
16.0
13.0
2.4
2.1
16.1
16.0
2.1
1.8
Metals & Mining
Coal India
Neutral
248
-
153,633
84,638
94,297
21.4
22.3
24.5
27.1
10.1
9.1
4.2
4.0
42.6
46.0
1.3
1.2
Hind. Zinc
Neutral
269
-
113,809
14,252
18,465
55.9
48.3
15.8
21.5
17.1
12.5
2.8
2.4
17.0
20.7
8.0
6.2
Hindalco
Neutral
199
-
44,587
107,899
112,095
7.4
8.2
9.2
13.0
21.6
15.3
1.0
1.0
4.8
6.6
0.9
0.9
JSW Steel
Neutral
212
-
51,318
53,201
58,779
16.1
16.2
130.6
153.7
1.6
1.4
0.2
0.2
14.0
14.4
1.7
1.5
NMDC
Neutral
111
-
35,167
6,643
7,284
44.4
47.7
7.1
7.7
15.7
14.4
1.4
1.3
8.8
9.2
3.1
2.7
SAIL
Neutral
60
-
24,615
47,528
53,738
(0.7)
2.1
(1.9)
2.6
22.9
0.7
0.6
(1.6)
3.9
1.4
1.2
Vedanta
Neutral
261
-
97,167
71,744
81,944
19.2
21.7
13.4
20.1
19.5
13.0
1.7
1.5
8.4
11.3
1.7
1.4
Tata Steel
Neutral
550
-
53,393
121,374
121,856
7.2
8.4
18.6
34.3
29.6
16.0
1.8
1.7
6.1
10.1
1.1
1.1
Oil & Gas
GAIL
Neutral
363
-
61,386
56,220
65,198
9.3
10.1
27.1
33.3
13.4
10.9
1.2
1.1
9.3
10.7
1.3
1.1
ONGC
Neutral
163
-
208,733
137,222
152,563
15.0
21.8
19.5
24.1
8.3
6.8
0.7
0.7
8.5
10.1
1.8
1.6
Indian Oil Corp
Neutral
386
-
187,292
373,359
428,656
5.9
5.5
54.0
59.3
7.1
6.5
1.1
1.0
16.0
15.6
0.7
0.6
Top Picks Report
July 06, 2017
Company Name
Reco
CMP
Target
Mkt Cap
Sales ( Čcr )
OPM(%)
EPS (Č)
PER(x)
P/BV(x)
RoE(%)
EV/Sales(x)
(Č)
Price ( Č)
( Č cr )
FY17E FY18E
FY17E
FY18E
FY17E
FY18E
FY17E
FY18E
FY17E
FY18E
FY17E
FY18E
FY17E
FY18E
Oil & Gas
Reliance Industries
Neutral
1,440
-
468,160
301,963
358,039
12.1
12.6
87.7
101.7
16.4
14.2
1.7
1.5
10.7
11.3
2.0
1.7
Pharmaceuticals
Alembic Pharma
Buy
519
648
9,787
3,101
3,966
19.7
20.5
21.4
25.5
24.3
20.4
5.2
4.2
23.0
22.8
3.1
2.3
Alkem Laboratories Ltd
Buy
1,836
2,161
21,950
5,853
6,901
17.1
18.4
74.6
85.0
24.6
21.6
5.2
4.4
21.1
20.2
3.7
3.2
Aurobindo Pharma
Buy
679
823
39,770
14,845
17,086
21.5
22.1
39.4
44.7
17.2
15.2
4.2
3.4
27.6
24.7
2.8
2.4
Aventis*
Neutral
4,190
-
9,649
2,206
2,508
16.6
16.8
128.9
139.9
32.5
30.0
5.6
4.4
21.6
23.5
4.1
3.5
Cadila Healthcare
Reduce
516
450
52,871
9,220
11,584
18.4
20.3
14.5
18.7
35.6
27.6
7.6
6.2
23.5
24.6
6.1
4.6
Cipla
Sell
546
461
43,905
14,281
16,619
15.4
16.2
12.5
19.7
43.7
27.7
3.5
3.2
8.4
12.0
3.2
2.8
Dr Reddy's
Neutral
2,658
-
44,056
14,081
15,937
16.1
18.6
72.6
105.9
36.6
25.1
3.6
3.2
9.6
13.6
3.4
3.0
Dishman Pharma
Sell
143
1,718
1,890
22.7
22.8
9.5
11.3
10.1
10.9
3.3
2.9
GSK Pharma*
Neutral
2,566
-
21,736
2,927
3,290
11.8
16.2
34.4
49.6
74.6
51.7
10.8
11.3
13.9
21.3
7.2
6.5
Indoco Remedies
Sell
202
153
1,862
1,067
1,154
12.1
14.9
8.4
11.3
24.1
17.9
2.9
2.5
12.6
15.0
1.9
1.8
Ipca labs
Buy
481
620
6,063
3,211
3,593
13.9
14.5
15.4
19.4
31.2
24.8
2.5
2.3
8.2
9.5
2.0
1.8
Lupin
Buy
1,084
1,526
48,969
17,120
18,657
24.1
24.1
56.9
61.1
19.1
17.7
3.6
3.0
20.7
18.6
3.2
2.6
Natco Pharma
Accumulate
984
1,060
17,152
2,065
1,988
33.1
33.7
27.9
25.7
35.3
38.3
10.3
8.8
29.2
22.9
8.4
8.5
Sun Pharma
Buy
551
712
132,102
30,264
32,899
29.0
26.9
32.7
31.6
16.8
17.4
3.6
3.1
22.2
18.7
4.1
3.7
Power
Tata Power
Neutral
82
-
22,112
36,916
39,557
17.4
27.1
5.1
6.3
16.0
13.0
1.4
1.3
9.0
10.3
1.6
1.5
NTPC
Neutral
159
-
130,938
86,605
95,545
17.5
20.8
11.8
13.4
13.5
11.9
1.4
1.3
10.5
11.1
2.9
2.8
Power Grid
Accumulate
210
223
109,968
25,315
29,193
88.2
88.7
14.2
17.2
14.9
12.3
2.3
2.0
15.2
16.1
9.0
8.1
Real Estate
Prestige Estate
Neutral
250
-
9,368
4,707
5,105
25.2
26.0
10.3
13.0
24.3
19.2
1.9
1.8
10.3
10.2
3.2
2.8
MLIFE
Buy
439
522
2,251
1,152
1,300
22.7
24.6
29.9
35.8
14.7
12.3
1.1
1.0
7.6
8.6
2.7
2.3
Telecom
Bharti Airtel
Neutral
376
-
150,422
105,086
114,808
34.5
34.7
12.2
16.4
30.8
23.0
2.1
2.0
6.8
8.4
2.3
2.0
Idea Cellular
Neutral
84
-
30,129
40,133
43,731
37.2
37.1
6.4
6.5
13.1
12.9
1.1
1.0
8.2
7.6
1.8
1.5
zOthers
Abbott India
Neutral
4,226
-
8,980
3,153
3,583
14.1
14.4
152.2
182.7
27.8
23.1
136.3
116.4
25.6
26.1
2.6
2.2
Asian Granito
Accumulate
446
480
1,341
1,066
1,169
11.6
12.5
13.0
16.0
34.3
27.9
3.3
3.0
9.5
10.7
1.6
1.4
Bajaj Electricals
Buy
323
395
3,271
4,801
5,351
5.7
6.2
10.4
13.7
31.0
23.6
3.8
3.4
12.4
14.5
0.7
0.6
Banco Products (India)
Neutral
219
-
1,564
1,353
1,471
12.3
12.4
14.5
16.3
15.1
13.4
20.8
18.8
14.5
14.6
1.1
117.8
Coffee Day Enterprises
Neutral
248
-
5,113
2,964
3,260
20.5
21.2
4.7
8.0
-
31.0
2.9
2.6
5.5
8.5
2.1
1.9
Ltd
Competent Automobiles Neutral
191
-
122
1,137
1,256
3.1
2.7
28.0
23.6
6.8
8.1
36.7
33.2
14.3
11.5
0.1
0.1
Elecon Engineering
Neutral
60
-
675
1,482
1,660
13.7
14.5
3.9
5.8
15.4
10.4
3.6
3.3
7.8
10.9
0.8
0.7
Top Picks Report
July 06, 2017
Company Name
Reco
CMP
Target
Mkt Cap
Sales ( Čcr )
OPM(%)
EPS (Č)
PER(x)
P/BV(x)
RoE(%)
EV/Sales(x)
(Č)
Price ( Č)
( Č cr )
FY17E
FY18E
FY17E
FY18E
FY17E
FY18E
FY17E
FY18E
FY17E
FY18E
FY17E
FY18E
FY17E
FY18E
zOthers
Finolex Cables
Neutral
485
-
7,420
2,883
3,115
12.0
12.1
14.2
18.6
34.2
26.1
18.2
15.9
15.8
14.6
2.3
2.1
Garware Wall Ropes
Neutral
878
-
1,920
863
928
15.1
15.2
36.4
39.4
24.1
22.3
4.4
3.7
17.5
15.9
2.1
2.0
Goodyear India*
Neutral
910
-
2,100
1,598
1,704
10.4
10.2
49.4
52.6
18.4
17.3
85.1
74.6
18.2
17.0
1.0
142.9
Hitachi
Neutral
1,954
-
5,313
2,081
2,433
8.8
8.9
33.4
39.9
58.5
49.0
47.2
39.3
22.1
21.4
2.6
2.2
HSIL
Neutral
404
-
2,922
2,384
2,515
15.8
16.3
15.3
19.4
26.4
20.8
26.2
22.6
7.8
9.3
1.4
1.3
Interglobe Aviation
Neutral
1,216
-
43,985
21,122
26,005
14.5
27.6
110.7
132.1
11.0
9.2
65.8
47.0
168.5
201.1
2.1
1.6
Jyothy Laboratories
Neutral
361
-
6,562
1,440
2,052
11.5
13.0
8.5
10.0
42.5
36.1
10.3
9.5
18.6
19.3
4.8
3.4
Kirloskar Engines India
Neutral
393
-
5,680
2,554
2,800
9.9
10.0
10.5
12.1
37.4
32.5
15.7
14.8
10.7
11.7
1.9
1.7
Ltd
Linc Pen & Plastics
Neutral
280
-
414
382
420
9.3
9.5
13.5
15.7
20.8
17.8
3.6
3.1
17.1
17.3
1.2
1.0
M M Forgings
Neutral
635
-
766
546
608
20.4
20.7
41.3
48.7
15.4
13.0
87.0
77.0
16.6
17.0
1.2
1.1
Manpasand Bever.
Neutral
771
-
4,409
836
1,087
19.6
19.4
16.9
23.8
45.6
32.4
5.5
4.8
12.0
14.8
5.0
3.8
Mirza International
Neutral
165
-
1,986
963
1,069
17.2
18.0
6.1
7.5
26.9
22.0
4.1
3.5
15.0
15.7
2.3
2.0
MT Educare
Neutral
64
-
254
366
417
17.7
18.2
9.4
10.8
6.8
5.9
1.5
1.3
22.2
22.3
0.6
0.5
Narayana Hrudaya
Neutral
316
-
6,465
1,873
2,166
11.5
11.7
2.6
4.0
119.6
79.8
7.3
6.6
6.1
8.3
3.6
3.1
Navkar Corporation
Buy
210
265
2,993
347
371
43.2
37.3
6.7
6.0
31.5
35.0
2.2
1.9
6.2
10.6
9.7
9.1
Navneet Education
Neutral
177
-
4,134
1,062
1,147
24.0
24.0
6.1
6.6
29.1
26.7
6.0
5.3
20.6
19.8
4.0
3.7
Nilkamal
Neutral
1,932
-
2,884
1,995
2,165
10.7
10.4
69.8
80.6
27.7
24.0
110.4
95.9
16.6
16.5
1.4
1.3
Page Industries
Neutral
17,956
-
20,028
2,450
3,124
20.1
17.6
299.0
310.0
60.1
57.9
399.9
305.3
47.1
87.5
8.2
6.5
Parag Milk Foods
Neutral
225
-
1,896
1,919
2,231
9.3
9.6
9.5
12.9
23.9
17.4
3.7
3.1
15.5
17.5
1.1
1.0
Quick Heal
Neutral
203
-
1,422
408
495
27.3
27.0
7.7
8.8
26.2
23.0
2.4
2.4
9.3
10.6
2.6
2.2
Radico Khaitan
Accumulate
134
147
1,784
1,667
1,824
13.0
13.2
6.7
8.2
20.2
16.4
1.8
1.7
9.0
10.2
1.5
1.3
Relaxo Footwears
Neutral
518
-
6,226
2,085
2,469
9.2
8.2
7.6
8.0
68.6
65.2
26.6
22.7
17.9
18.8
3.1
2.6
S H Kelkar & Co.
Neutral
260
-
3,754
1,036
1,160
15.1
15.0
6.1
7.2
42.5
36.2
4.5
4.2
10.7
11.5
3.5
3.1
Siyaram Silk Mills
Accumulate
2,200
2,500
2,062
1,574
1,769
12.5
12.7
97.1
113.1
22.7
19.5
3.5
3.0
15.4
15.5
1.5
1.3
Styrolution ABS India*
Neutral
916
-
1,610
1,440
1,537
9.2
9.0
40.6
42.6
22.6
21.5
57.6
52.3
12.3
11.6
1.1
1.0
Surya Roshni
Neutral
293
-
1,286
3,342
3,625
7.8
7.5
17.3
19.8
17.0
14.9
32.2
25.9
10.5
10.8
0.6
0.6
Team Lease Serv.
Neutral
1,436
-
2,455
3,229
4,001
1.5
1.8
22.8
32.8
63.1
43.7
6.8
5.9
10.7
13.4
0.7
0.5
The Byke Hospitality
Neutral
189
-
759
287
384
20.5
20.5
7.6
10.7
24.9
17.7
5.2
4.2
20.7
23.5
2.7
2.0
Transport Corporation of
Neutral
341
-
2,609
2,671
2,911
8.5
8.8
13.9
15.7
24.6
21.8
3.4
3.0
13.7
13.8
1.1
1.0
India
Top Picks Report
July 06, 2017
Company Name
Reco
CMP
Target Mkt Cap
Sales ( Čcr )
OPM(%)
EPS (Č)
PER(x)
P/BV(x)
RoE(%)
EV/Sales(x)
(Č)
Price ( Č)
( Č cr )
FY17E FY18E FY17E FY18E FY17E FY18E FY17E FY18E FY17E FY18E FY17E FY18E FY17E FY18E
zOthers
TVS Srichakra
Neutral
3,849
-
2,947
2,304
2,614
13.7
13.8
231.1
266.6
16.7
14.4
432.5
340.5
33.9
29.3
1.3
1.1
UFO Moviez
Neutral
387
-
1,068
619
685
33.2
33.4
30.0
34.9
12.9
11.1
1.8
1.5
13.8
13.9
1.4
1.1
Visaka Industries
Neutral
510
-
810
1,051
1,138
10.3
10.4
21.0
23.1
24.3
22.0
65.4
61.2
9.0
9.2
1.0
1.0
VRL Logistics
Neutral
336
-
3,069
1,902
2,119
16.7
16.6
14.6
16.8
23.1
20.0
5.1
4.4
21.9
22.2
1.7
1.5
VIP Industries
Accumulate
193
218
2,722
1,270
1,450
10.4
10.4
5.6
6.5
34.4
29.6
7.1
6.2
20.7
21.1
2.1
1.9
Navin Fluorine
Buy
3,032
3,650
2,984
789
945
21.1
22.4
120.1
143.4
25.2
21.1
4.1
3.5
17.8
18.5
3.7
3.0
Source: Company, Angel Research; Note: *December year end; #September year end; &October year end; Price as on July 05, 2017
Top Picks Report | July 2017
Research Team Tel: 022 - 39357800
DISCLAIMER
Angel Broking Private Limited (hereinafter referred to as “Angel”) is a registered Member of National Stock Exchange of India Limited,
Bombay Stock Exchange Limited and Metropolitan Stock Exchange Limited. It is also registered as a Depository Participant with CDSL
and Portfolio Manager with SEBI. It also has registration with AMFI as a Mutual Fund Distributor. Angel Broking Private Limited is a
registered entity with SEBI for Research Analyst in terms of SEBI (Research Analyst) Regulations, 2014 vide registration number
INH000000164. Angel or its associates has not been debarred/ suspended by SEBI or any other regulatory authority for accessing
/dealing in securities Market. Angel or its associates/analyst has not received any compensation / managed or co-managed public
offering of securities of the company covered by Analyst during the past twelve months.
This document is solely for the personal information of the recipient, and must not be singularly used as the basis of any investment
decision. Nothing in this document should be construed as investment or financial advice. Each recipient of this document should
make such investigations as they deem necessary to arrive at an independent evaluation of an investment in the securities of the
companies referred to in this document (including the merits and risks involved), and should consult their own advisors to determine
the merits and risks of such an investment.
Reports based on technical and derivative analysis center on studying charts of a stock's price movement, outstanding positions and
trading volume, as opposed to focusing on a company's fundamentals and, as such, may not match with a report on a company's
fundamentals. Investors are advised to refer the Fundamental and Technical Research Reports available on our website to evaluate the
contrary view, if any.
The information in this document has been printed on the basis of publicly available information, internal data and other reliable
sources believed to be true, but we do not represent that it is accurate or complete and it should not be relied on as such, as this
document is for general guidance only. Angel Broking Pvt. Limited or any of its affiliates/ group companies shall not be in any way
responsible for any loss or damage that may arise to any person from any inadvertent error in the information contained in this report.
Angel Broking Pvt. Limited has not independently verified all the information contained within this document. Accordingly, we cannot
testify, nor make any representation or warranty, express or implied, to the accuracy, contents or data contained within this document.
While Angel Broking Pvt. Limited endeavors to update on a reasonable basis the information discussed in this material, there may be
regulatory, compliance, or other reasons that prevent us from doing so.
This document is being supplied to you solely for your information, and its contents, information or data may not be reproduced,
redistributed or passed on, directly or indirectly.
Neither Angel Broking Pvt. Limited, nor its directors, employees or affiliates shall be liable for any loss or damage that may arise from
or in connection with the use of this information.
Ratings (Based on expected returns
Buy (> 15%)
Accumulate (5% to 15%)
Neutral (-5 to 5%)
over 12 months investment period):
Reduce (-5% to -15%)
Sell (< -15)