
1
Please refer to important disclosures at the end of this report
1
1
Angel Top Picks – December 2020
Indian markets rally to new highs on back of record FII flows in November – Indian
equities closed in the green for a second month in a row up by 11.4% to 12,969
on the back of record FII flows. FII inflows for the month stood at a record
`60,358 crore as compared to `19,541 crore in October 2020. Positive news
flow on vaccine front and US elections also provided support to the markets.
Domestic economy continued to improve in November– The economy continued to
improve in November which was reflected in the PMI numbers. The manufacturing
PMI for November at 56.3 points to continued strong rebound in manufacturing.
Though this is lower than the reading of 58.9 in October, the last three month PMI
numbers point to a very strong acceleration in the manufacturing sector. Services
PMI at 53.7 for the month of November also point to solid pace of expansion
despite falling from 54.1 in October.
Positive news flow on vaccine front led to sharp rally in global markets -
During the month Pfizer and Moderna announced the result of the phase 3
trials of their Covid-19 vaccines which were extremely positive. Both the
companies’ vaccines have demonstrated efficacy more than 90% of the
volunteers in the phase 3 trails. The outcome of the phase 3 results were
cheered by the markets and led to a major risk on rally globally.
Expectations of second US stimulus package to provide support - In the US
elections the Democratic Party candidate Joe Biden has won the presidential
elections while democrats have managed to retain retained the House of
Representatives which were along expected lines. Post the US elections focus has
now shifted to the progress on the second US stimulus package and talks are
currently underway between the republicans and the democrats on the package.
RBI’s accommodative stance despite high inflation is positive for markets – The
Reserve bank of India (RBI) in its bimonthly MPC meeting maintained status quo
with the benchmark repo and reverse repo rates being left unchanged at 4.0% and
3.35% respectively. The RBI has guided that they will maintain their
accommodative stance for FY2021 and into FY2022 despite high inflation which
should help the current economic recovery and is positive for the markets.
We expect broad based rally to continue for now – The rally in the past few months
have become broader with more sectors participating in the rally. We expect that
the rally in cyclical and beaten down sectors will continue for now given the risk on
environment globally. We believe that auto, chemicals, select private BFSI names,
consumer durables and cement should continue to do well. We also expect the
rural, essential and digital theme to continue playing out over the next few quarters
given revenue visibility and strong growth prospects. We therefore continue to
maintain our positive outlook on sectors like IT, Pharma, Two wheelers and
tractors.
Top Picks Performance
Return Since Inception (30th Oct, 2015)
Top Picks Return
87.9%
BSE 100
61.9%
Outperformance
26.0%
Source: Company, Angel Research
Top Picks
Company
CMP (`)
TP (`)
Healthcare & Pharma
Metropolis Healthcare
1,989
2,593
IT
Persistent System
1,212
1,531
Media & Entertainment
Inox Leisure
281
350
Banking
Cholamand. Inv. Fin. Comp.
370
453
Bandhan Bank
393
450
IDFC First Bank
37
44
Chemicals
Atul
6,152
7,339
Galaxy Surfact.
1,920
2,284
Others
JK Lakshmi Cement
363
422
Gujarat Gas
348
397
Swaraj Engines
1,414
1,892
Hawkins Cooker
5,135
5,992
Source: Company, Angel Research
Note: Closing price as on 4
st
December,2020

2
Error!
Refer
ence
sourc
Angel Top Picks | December 2020
December 5, 2020
2
Top Picks
3
Error!
Refer
ence
sourc
Angel Top Picks | December 2020
December 5, 2020
3
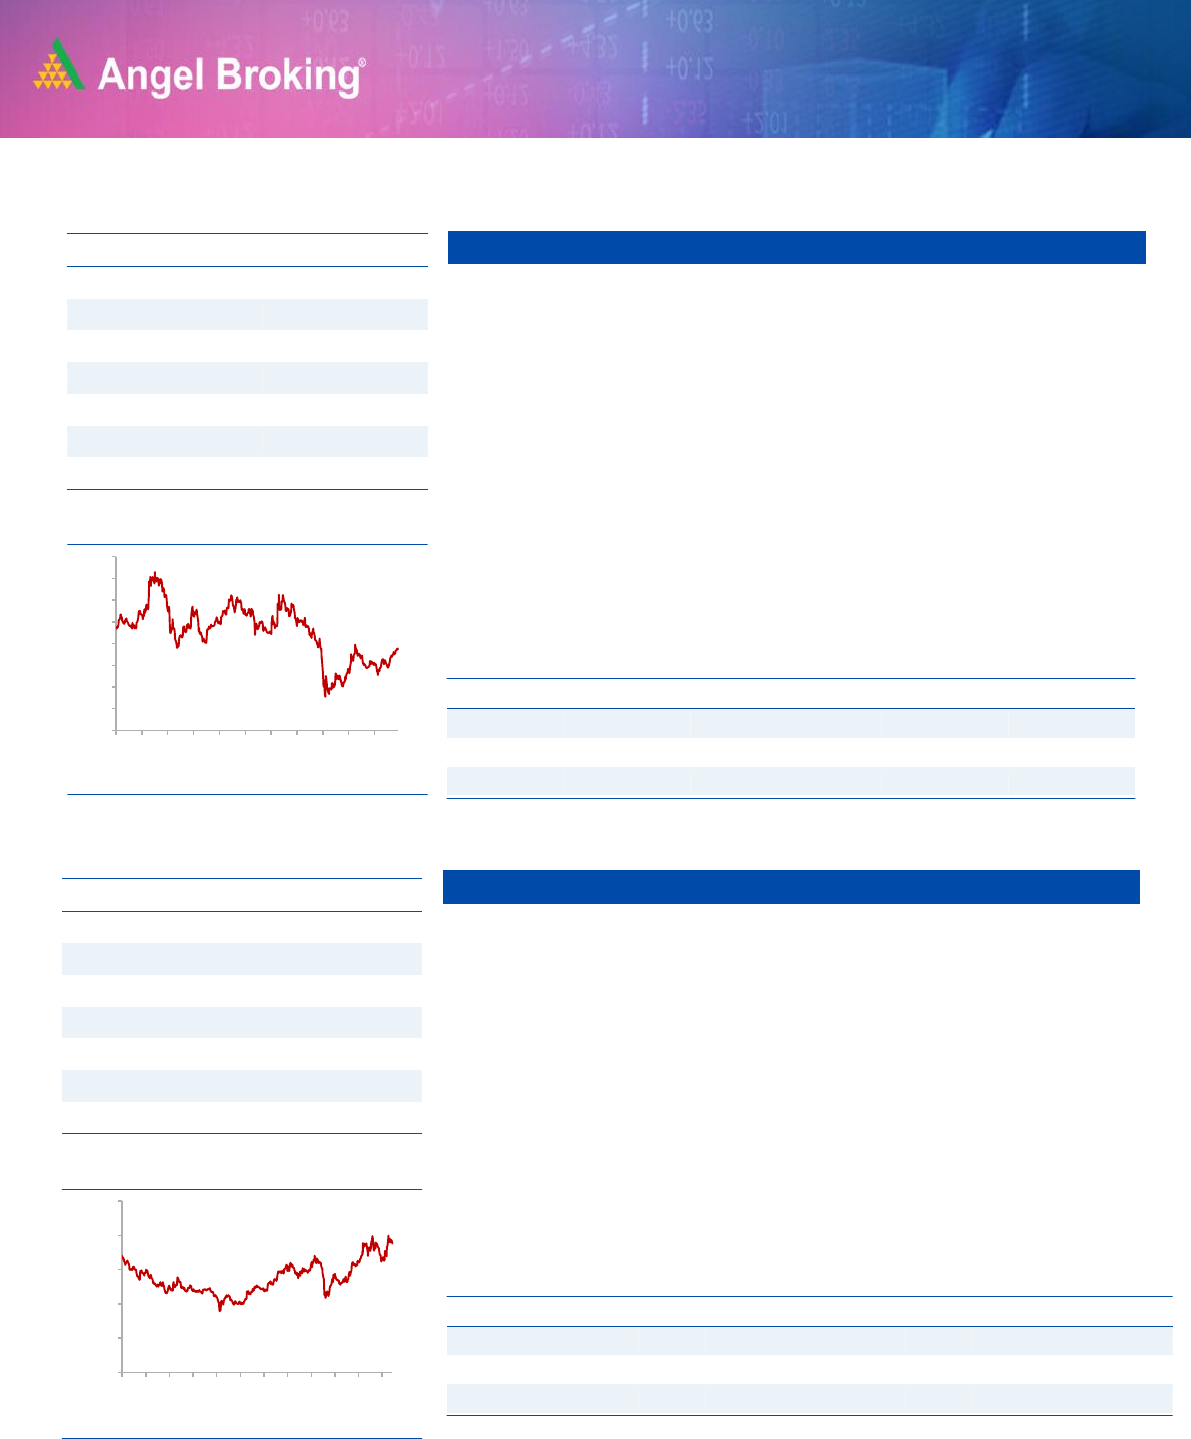
Swaraj Engines
Swaraj Engines is engaged in the business of manufacturing diesel engines
and hi-tech engine components. Diesel Engines are specifically designed for
tractor application.
Going forward, we expect recovery in tractor industry (due to robust Rabi crop
production, hike in MSP & the forecast of a normal monsoon) will benefit
player like Swaraj Engines
The company has healthy balance sheet along with free cash flow and higher
profitability. The company is trading at reasonably lower valuations.
Hawkins Cooker
HCL operates in two segments i.e. Pressure Cookers and Cookware. Over the
FY17-20, the company has outperformed TTK Prestige (market leader) in
terms of sales growth ~9.6% vs. ~0.4% in Cookers & Cookware segment.
Cooking gas (LPG) penetration has increased from 56% in FY2014 to 95% in
FY2020, which would drive higher growth for Cookers & Cookware compared
to past.
Increase demand for Kitchen product post Covid-19.
Strong balance sheet along with free cash flow and higher profitability.
Stock Info
CMP
1,414
TP
1,892
Upside
33.8%
Sector
Engines
Market Cap (` cr)
1,722
Beta
0.5
52 Week High / Low
1,708 /807
3 year-Chart
Source: Company, Angel Research
Key Financials
Y/E
Sales
OPM
PAT
EPS
ROE
P/E
P/BV
EV/Sales
March
(` cr)
(%)
(` cr)
(`)
(%)
(x)
(x)
(x)
FY2021E
774
16.7
66
54.6
16.7
25.9
4.3
2.2
FY2022E
899
17.0
86
71.2
17.1
19.9
3.4
1.9
Source: Company, Angel Research
Key Financials
Y/E
Sales
OPM
PAT
EPS
ROE
P/E
P/BV
EV/Sales
March
(` cr)
(%)
(` cr)
(`)
(%)
(x)
(x)
(x)
FY2021E
658
13.0
59
111.9
35.7
45.9
16.4
4.1
FY2022E
750
15.1
80
150.4
41.4
34.1
14.1
3.5
Source: Company, Angel Research
-
500
1,000
1,500
2,000
2,500
Dec-17
Mar-18
Jun-18
Aug-18
Nov-18
Feb-19
May-19
Aug-19
Nov-19
Feb-20
May-20
Aug-20
Nov-20
Stock Info
CMP
5,135
TP
5,992
Upside
16.7%
Sector
Durable
Market Cap (` cr)
2,715
Beta
0.6
52 Week High / Low
5,539 /3,111
3 year-Chart
Source: Company, Angel Research
-
1,000
2,000
3,000
4,000
5,000
6,000
Dec-17
Mar-18
Jun-18
Aug-18
Nov-18
Feb-19
May-19
Aug-19
Nov-19
Feb-20
May-20
Aug-20
Nov-20
4
Error!
Refer
ence
sourc
Angel Top Picks | December 2020
December 5, 2020
4
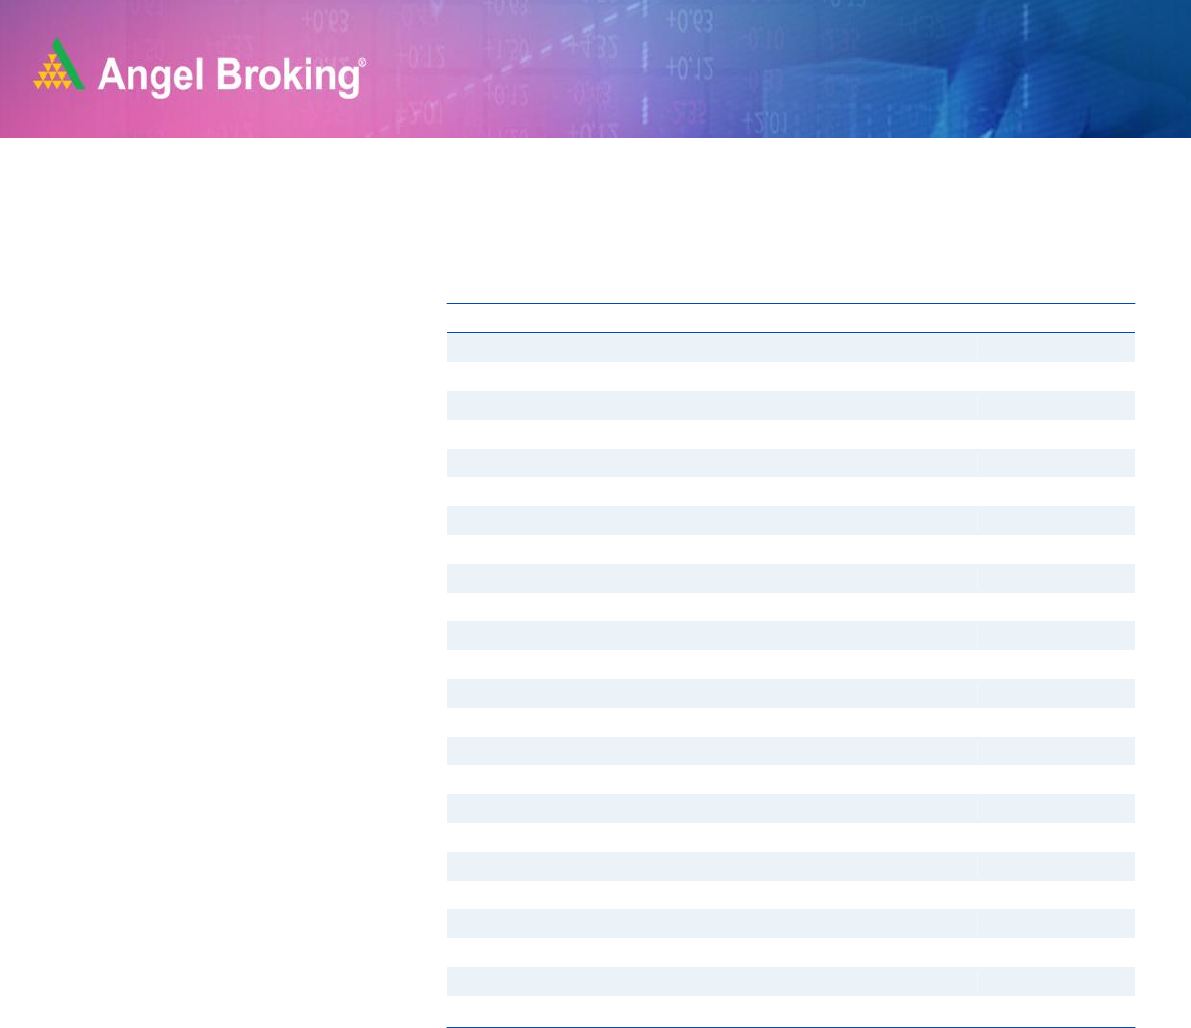
Gujarat Gas
Strong Volume Growth – In Q2FY21 Volume stood at 9.85 MMSCMD, which
is the highest volume by company in any quarter, Volumes are even better
than pre Covid levels. In last 2 years strong volume CAGR of 20%..
Industrial Growth in Gujarat – 80% of overall volumes comes from Industrial
sector. Industrial demand is very strong in Morbi. Morbi ceramic to get further
boost as strong demand from USA as they have imposed 200%-300% of
import duty on Chinese ceramic. Company also ramping up its capacity at
Morbi to enable it to handle 8 MMSCMD against current capacity of 5.9
MMSCMD.
Gujarat gas margins are highest in Q2FY21 at 29%. Margin has increased
due to low imported LNG prices and decrease in other expenses.
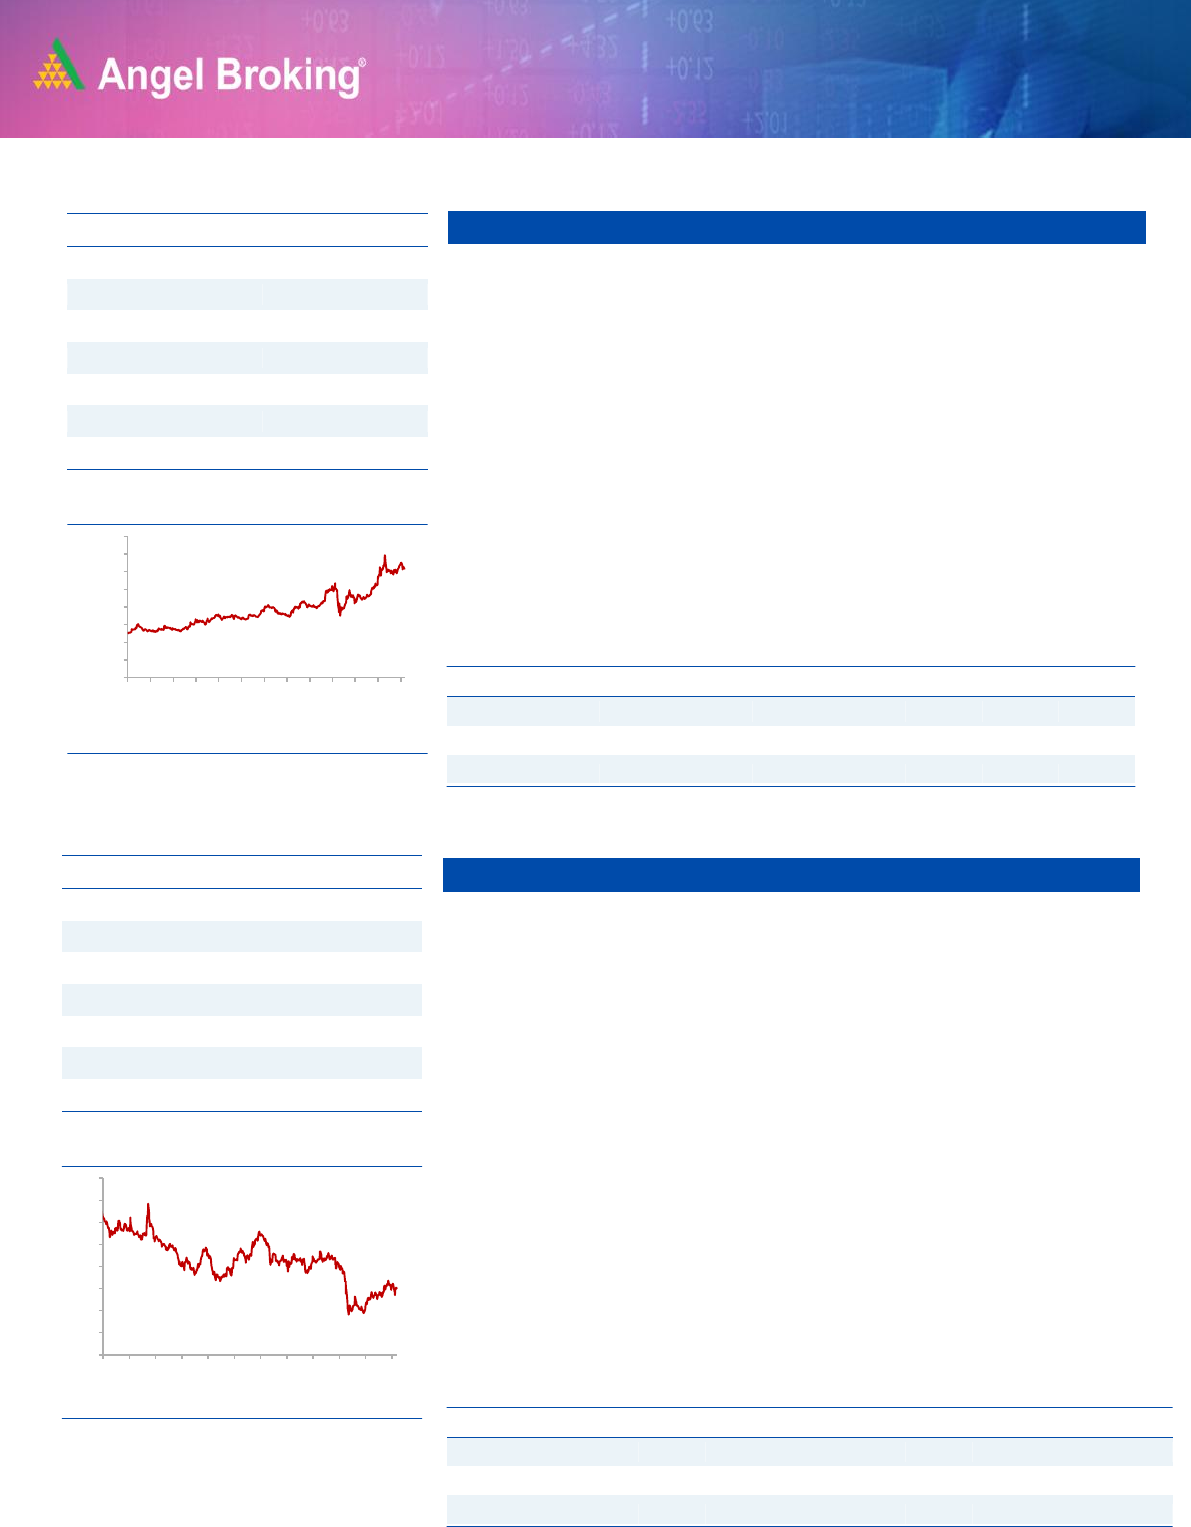
Persistent System
Persistent Systems has a very strong presence in Hi tech, manufacturing and
life science segments which ware amongst the least impacted sectors due to
Covid-19.
Company has posted a very strong set of numbers for Q2FY21 along with
strong desl wins. Company has also reported improvement in margins due to
tight cost control. Company has won a large deal during the quarter which will
ramp up over the next few quarters. The new management focus on annuity
deals are expected to lead to stable growth going forward.
We expect the company to post revenue/EBITDA/PAT growth of
11.6%/21.4%/19.7% between FY20-FY22 given negligible impact of Covid-
19 on FY21 numbers, strong deal wins, ramp up of existing projects along
with margin expansion.
Key Financials
Y/E
Sales
OPM
PAT
EPS
ROE
P/E
P/BV
EV/Sales
March
(` cr)
(%)
(` cr)
(`)
(%)
(x)
(x)
(x)
FY2021E
9428
33.0%
1442
21
32.9
16.6
5.5
2.6
FY2022E
12522
27%
1517
22
26.3
15.8
5.5
1.9
Source: Company, Angel Research
Key Financials
Y/E
Sales
OPM
PAT
EPS
ROE
P/E
P/BV
EV/Sales
March
(` cr)
(%)
(` cr)
(`)
(x)
(%)
(%)
(x)
FY2021E
4,077
15.7
408
53.4
15.2
21.5
3.3
1.7
FY2022E
4,645
16.4
513
67.1
16.7
17.1
2.8
1.5
Source: Company, Angel Research
Stock Info
CMP
1,212
TP
1,531
Upside
33.5%
Sector
IT
Market Cap (` cr)
9,409
Beta
0.5
52 Week High / Low
1,390/420
3 year-Chart
Source: Company, Angel Research
-
200
400
600
800
1,000
1,200
1,400
1,600
Dec-17
Mar-18
Jun-18
Aug-18
Nov-18
Feb-19
May-19
Aug-19
Nov-19
Feb-20
May-20
Aug-20
Nov-20
Stock Info
CMP
348
TP
397
Upside
14.2%
Sector
Gas Distribution
Market Cap (` cr)
23,750
Beta
0.65
52 Week High / Low
411 /191
3 year-Chart
Source: Company, Angel Research
-
50
100
150
200
250
300
350
400
Dec-17
Mar-18
Jun-18
Aug-18
Nov-18
Feb-19
May-19
Aug-19
Nov-19
Feb-20
May-20
Aug-20
Nov-20
5
Error!
Refer
ence
sourc
Angel Top Picks | December 2020
December 5, 2020
5
Inox Leisure
Inox Leisure is the second largest multiplex company in India after PVR and
operates more than 600 screens across India.
Multiplex screens are gaining ground in India at the expense of single screens.
According to FICCI, multiplex screens share have increased from ~26% in
CY16 to ~33.5% in CY19, which will continue to increase.
Share prices have corrected ~40% as all theatres are closed down due to
covid-19 issue. Although, long term fundamentals are intact. Covid-19 can
lead to further consolidation in the industry.
We are positive on the prospects of the company given that has strong
balance sheet, increasing market share of multiplexes and also increasing
appetite for Hollywood and smaller budget movies which is expected to reduce
volatility in earnings due to lower dependency on big Bollywood movies
Key Financials:
Y/E
Sales
OPM
PAT
EPS
ROE
P/E
P/BV
EV/Sales
March
(` cr)
(%)
(` cr)
(`)
(%)
(x)
(x)
(x)
FY2021E
628
-8.6
-146
-14.2
NA
NA
4.6
4.6
FY2022E
2153
17.0
162
15.8
14.5
17.8
2.6
1.4
Source: Company, Angel Research (Above table is ex Ind AS 116).
Metropolis Healthcare
Metropolis is a leading Pathology centre in India. Company has an asset light
model with a strong Balance sheet having cash and cash equivalents to the
tune of ₹235cr as on 30st June, 2020.
Currently, the diagnostic industry is dominated by standalone centers (~48%)
followed by hospital based labs (~37%) and diagnostic chains (~15%)
From 62.6% revenue de-growth (including covid testing) YoY in April'20, the
Company has registered mid double digit revenue growth in July'20 as covid
revenue is making up for the losses in non-covid revenue. We expect non-
covid business to be back to normal from Q3FY21 onwards.
We are positive on the long term prospects of the Company given expected
long term growth rates of ~15% CAGR, stable margins profile and
moderating competitive intensity.
Key Financials
Y/E
Sales
OPM
PAT
EPS
ROE
P/E
P/BV
EV/Sales
March
(` cr)
(%)
(` cr)
(`)
(x)
(%)
(%)
(x)
FY2021E
1025
28.2
189
37.4
28.2
53.1
15.0
9.5
FY2022E
1242
28.3
239
47.3
27.8
42.0
11.7
7.8
Source: Company, Angel Research
Stock Info
CMP
1,989
TP
2,593
Upside
30.4%
Sector
Healthcare
Market Cap (` cr)
10,448
Beta
0.8
52 Week High / Low
2,321 /993
3 year-Chart
Source: Company, Angel Research
-
500
1,000
1,500
2,000
2,500
Apr-19
Jun-19
Aug-19
Oct-19
Dec-19
Feb-20
Apr-20
Jun-20
Aug-20
Oct-20
Stock Info
CMP
1,989
TP
2,593
Upside
30.4%
Sector
Healthcare
Market Cap (` cr)
10,448
Beta
0.8
52 Week High / Low
2,321/994
3 year-Chart
Source: Company, Angel Research
-
500
1,000
1,500
2,000
2,500
Apr-19
Jun-19
Aug-19
Oct-19
Dec-19
Feb-20
Apr-20
Jun-20
Aug-20
Oct-20
Stock Info
CMP
281
TP
350
Upside
24.6%
Sector
Media & Entertainment
Market Cap (` cr)
3,169
Beta
0.79
52 Week High / Low
511 /158
3 year-Chart
Source: Company, Angel Research
-
100
200
300
400
500
600
Dec-17
Mar-18
Jun-18
Aug-18
Nov-18
Feb-19
May-19
Aug-19
Nov-19
Feb-20
May-20
Aug-20
Nov-20
6
Error!
Refer
ence
sourc
Angel Top Picks | December 2020
December 5, 2020
6
Cholamandalam Inv. Fin. Com.
The CIFC has one of the most diversified AUMs in terms of product mix and
geographical presence. None of its product segments account for over 26% of
overall AUM. The maximum geographic zonal exposure in terms of AUM is
27% (south).
Management has a stress-tested book and guided for lower incremental
provision requirement. The final provision for FY21 would be similar to FY20.
Hence, we believe existing COVID provision is adequate.
A diversified product mix will help capture growth in the LCV, tractor, and 2W
segment. Adequate capital adequacy (20%+) and declined trend in The cost
of funds and strong parentage provide comfort. The company will benefit
significantly from stabilization in the operating environment.
J.K. Lakshmi Cement
JK Lakshmi promoted by Singhania group is a predominantly north India
cement company with capacity of 13.3 Mn Mt.
Currently, north India is favorable location for the cement industry as it is
consolidated to a large extent as well as demand and supply outlook is better
compared to other locations. Q1FY21 numbers of the Company were better
compared to its peers due to favorable regional presence.
Freight and power & fuel are important line items of cost for cement
companies. Fall in crude prices will help to reduce cost/tonne for the
company.
It is also trading at a significant discount compared to other north based
cement company such as JK Cement as well as historical valuation.
Stock Info
CMP
370
TP
453
Upside
22.5%
Sector
Banking
Market Cap (` cr)
30,385
Beta
1.6
52 Week High / Low
394 /117
3 year-Chart
Source: Company, Angel Research
Key Financials
Y/E
NII
NIM
PAT
EPS
ABV
ROA
ROE
P/E
P/ABV
March
(` cr)
(%)
(` cr)
(`)
(`)
(%)
(%)
(x)
(x)
FY2021E
4,126
6.0
1,164
14.2
102
1.7
13.4
22
3.1
FY2022E
4,941
6.3
1,860
22.7
121
2.4
18.6
14
2.6
Source: Company, Angel Research
Key Financials
Y/E
Sales
OPM
PAT
EPS
ROE
P/E
P/BV
EV/Sales
March
(` cr)
(%)
(` cr)
(`)
(%)
(x)
(x)
(x)
FY2021E
4151
18.7
315
26.7
17.0
13.6
2.1
1.2
FY2022E
4427
17.4
333
28.3
15.5
12.8
1.9
1.0
Source: Company, Angel Research (Standalone nos.)
-
50
100
150
200
250
300
350
400
Dec-17
Mar-18
Jun-18
Aug-18
Nov-18
Feb-19
May-19
Aug-19
Nov-19
Feb-20
May-20
Aug-20
Nov-20
Stock info
CMP
363
TP
422
Upside
16.3%
Sector
Cement
Market Cap (` cr)
4,220
Beta
0.7
52 Week High / Low
390 /180
3 year-Chart
Source: Company, Angel Research
-
50
100
150
200
250
300
350
400
450
500
Dec-17
Mar-18
Jun-18
Aug-18
Nov-18
Feb-19
May-19
Aug-19
Nov-19
Feb-20
May-20
Aug-20
Nov-20
7
Error!
Refer
ence
sourc
Angel Top Picks | December 2020
December 5, 2020
7
Bandhan Bank
Bandhan bank is one of India’s leading east based micro finance lending led
bank. This places the bank at a significant advantage other others MFIs in the
form of very low cost of funds.
While Bandhan Bank started off as a MFI it is diversifying its loan book. With
the takeover of Gruh Finance mortgages account for ~ 26% of the banks
lending books while commercial banking accounts for ~6.5% of the
company's loan book. The company is looking to diversify its loan book and
geographical spread over the next 5 years.
The company has posted better than expected set of numbers for Q2FY21 with
and has posted NII growth of 25.8% YoY while operating profit has registered
a growth of 24.5% YoY.
Galaxy Surfact.
Galaxy Surfactants is a market leader in oleochemical-based surfactants,
which is used in personal and home care products including skin care, oral
care, hair care, cosmetics, toiletries and detergent products.
The company has been increasing its share of high margin specialty care
products in its portfolio which now accounts for ~ 40% of its revenues while
the balance is accounted for by the performance surfactant business.
Company has very strong relationship with MNC clients like Unilever, P&G,
Henkel, Colgate-Palmolive and supplies raw materials to them not only in
India but also in US, EU and MENA region.
Stock Info
CMP
393.2
TP
450
Upside
14.4%
Sector
Financials
Market Cap (` cr)
60,606
Beta
1.59
52 Week High / Low
584 /152
3 year-Chart
Source: Company, Angel Research
Key Financials
Y/E
NII
NIM
PAT
EPS
ABV
ROA
ROE
P/E
P/ABV
March
(` cr)
(%)
(` cr)
(`)
(`)
(%)
(%)
(x)
(x)
FY2021E
13,019
7.8
3,425
21.3
108
3.4
21
18
3.6
FY2022E
15,179
7.8
4,725
29.3
131
3.9
24
13
3.0
Source: Company, Angel Research
Stock Info
CMP
1,920
TP
2,284
Upside
19.0%
Sector
Chemicals
Market Cap (` cr)
6,670
Beta
0.6
52 Week High / Low
2,035 /975
3 year-Chart
Source: Company, Angel Research
Key Financials
Y/E
NII
NIM
PAT
EPS
ABV
ROA
ROE
P/E
P/ABV
March
(` cr)
(%)
(` cr)
(`)
(`)
(%)
(%)
(x)
(x)
FY2021E
6,939
4.8
90
0.2
29
0.1
1
191
1.1
FY2022E
8,121
5.3
1,530
2.7
31
0.9
8
11
1.0
Source: Company, Angel Research
-
100
200
300
400
500
600
700
800
Mar-18
Jun-18
Sep-18
Dec-18
Mar-19
Jun-19
Sep-19
Dec-19
Mar-20
Jun-20
Sep-20
-
500
1,000
1,500
2,000
2,500
Feb-18
May-18
Aug-18
Nov-18
Feb-19
May-19
Aug-19
Oct-19
Jan-20
Apr-20
Jul-20
Oct-20
8
Error!
Refer
ence
sourc
Angel Top Picks | December 2020
December 5, 2020
8
Atul
Atul Ltd is one of India’s oldest and largest specialty chemical companies with
diversified presence across various industries like Agrochemicals,
Pharmaceuticals, dyes & pigments etc.
The company has got one of the strongest chemistry skillets in the Indian
chemical space and has got very strong relationship with global chemical
companies with exports accounting for 55-60% of the company’s revenues.
The company's business has almost normalized in Q2FY2021 with the
company posting 4.2% degrowth in revenues to Rs. 1,002 crore as compared
to our expectation of a 10% degrowth. The life science division which accounts
for ~35% of the company’s revenue has reported a 5.3% YoY growth in sales
to 347.5 crore for the quarter.
IDFC First Bank
The Ability to raise sufficient liquidity at Low cost would be The Key criteria for
banks to navigate the current situation, as asset side inflow would be limited.
IDFC Fist Bank, Post management change has clearly outperformed in
building liability franchise and retail lending.
Since new management took charge, every qtr. liability franchise has been
strengthened. CASA ratio improved from 10.4% in Q3FY19 to 33.7% In
Q1FY21. NIM has improved to 4.53% in Q1FY21 as compared to 4.24% in
Q4 FY20 and 2.89% in Q3FY19. Retail advance mix is continuously
improving.
The Bank had raised Rs. 2,000 crores of fresh equity capital during Q1FY21.
Post the capital raise, the Capital Adequacy Ratio will be 15.03% with CET-1
Ratio of 14.58%.
We believe efforts to build a liability franchise, fresh capital infusion, and
provision taken on the wholesale books will help to tide over this difficult time.
Stock Info
CMP
6,152
TP
7,339
Upside
20.3%
Sector
Chemicals
Market Cap (` cr)
18,335
Beta
0.8
52 Week High / Low
7,021 /3,256
3 year-Chart
Source: Company, Angel Research
Key Financials
Y/E
Sales
OPM
PAT
EPS
ROE
P/E
P/BV
EV/Sales
March
(` cr)
(%)
(` cr)
(`)
(x)
(%)
(%)
(x)
FY2021E
3,946
25.4
697
235.1
0.2
25.9
4.6
4.2
FY2022E
4,981
23.9
837
282.3
0.2
21.6
3.9
3.3
Source: Company, Angel Research
Stock Info
CMP
37
TP
44
Upside
18.6%
Sector
Banking
Market Cap (` cr)
20,960
Beta
1.3
52 Week High / Low
47 /18
3 year-Chart
Source: Company, Angel Research
Key Financials
Y/E
NII
NIM
PAT
EPS
ABV
ROA
ROE
P/E
P/ABV
March
(` cr)
(%)
(` cr)
(`)
(`)
(%)
(%)
(x)
(x)
FY2021E
7,138
4.9
76
0.1
31
0.0
0.1
268
1.2
FY2022E
9,139
5.7
1,793
3.2
34
1.0
1.0
12
1.1
Source: Company, Angel Research
-
1,000
2,000
3,000
4,000
5,000
6,000
7,000
8,000
Dec-17
Mar-18
Jun-18
Aug-18
Nov-18
Feb-19
May-19
Aug-19
Nov-19
Feb-20
May-20
Aug-20
Nov-20
-
10
20
30
40
50
60
70
80
Jul-17
Oct-17
Feb-18
May-18
Sep-18
Dec-18
Apr-19
Jul-19
Nov-19
Feb-20
May-20
Sep-20
9
Error!
Refer
ence
sourc
Angel Top Picks | December 2020
December 5, 2020
9
Changes in Recommendation
Exhibit 1: Stock bought in last 6 months
Stock Name
Buy Call Date
Buy Price
H D F C
01-06-2020
1,740
Larsen & Toubro
01-06-2020
951
Escorts
01-06-2020
970
ICICI Bank
01-06-2020
345
Axis Bank
03-06-2020
424
Bajaj Fin.
03-06-2020
2,477
Can Fin Homes
03-06-2020
316
Endurance Tech.
08-06-2020
838
Swaraj Engines
08-06-2020
1,290
Persistent Sys
29-07-2020
885
Zensar Tech.
29-07-2020
155
Alembic Pharma
04-08-2020
1,023
J.K. Lakshmi Cement
24-08-2020
287
Cholamandalam Inv & Fin Comp
24-08-2020
232
VIP Industries
27-08-2020
303
Hawkins Cookers
27-08-2020
4,918
Inox Leisure
28-08-2020
304
Chalet Hotel
28-08-2020
165
Metropolis Healthcare
28-08-2020
1,832
Hindustan Aeronautics
03-09-2020
926
Atul
28-10-2020
6,072
Galaxy Surfactants
04-11-2020
1,664
Gujarat Gas
24-11-2020
329.70
Bandhan Bank
25-11-2020
365.500
Source: Company, Angel Research

10
Error!
Refer
ence
sourc
Angel Top Picks | December 2020
December 5, 2020
10
Exhibit 2: Stock sold in last 6 months
Stock Name
Sell Date
Sell Price
Nestle India
08-06-2020
17,160
P & G Hygiene
08-06-2020
10,150
Infosys
08-06-2020
708
Hind. Unilever
08-07-2020
2,161
Avenue Suparmart
13-07-2020
2,210
Axis Bank
14-07-2020
423
Bajaj Finance
21-07-2020
3,255
Larsen & Toubro
28-07-2020
913
Colgate-Palmolive
29-07-2020
1,413
Escorts
03-08-2020
1,110
Ipca Lab
11-08-2020
2,037
Aarti Industries
13-08-2020
1,012
Galaxy Surfactants
13-08-2020
1,751
L&T Infotech
13-08-2020
2,504
HDFC Ltd.
14-08-2020
1,813
ICICI Bank
17-08-2020
359
Dr. Reddy Lab
20-08-2020
4,481
Jindal Steel
24-08-2020
224
Bharti Airtel
24-08-2020
520
PI Industries
31-08-2020
1,920
Alembic Pharma
02-09-2020
921
Britannia Industries
14-09-2020
3,786
Chalet Hotels
28-09-2020
142
Zensar Technologies
30-10-2020
179
Reliance Industries
02-11-2020
1,912
Hindustan Aeronautics
03-11-2020
681
V I P Inds.
17-11-2020
311
Endurance Tech.
19-11-2020
1,036
Source: Company, Angel Research

11
Error!
Refer
ence
sourc
Angel Top Picks | December 2020
December 5, 2020
11
Research Team Tel: 022 - 39357800 E-mail: [email protected] Website: www.angelbroking.com
DISCLAIMER
Angel Broking Limited (hereinafter referred to as “Angel”) is a registered Member of National Stock Exchange of India Limited, Bombay
Stock Exchange Limited, Metropolitan Stock Exchange Limited, Multi Commodity Exchange of India Ltd and National Commodity &
Derivatives Exchange Ltd It is also registered as a Depository Participant with CDSL and Portfolio Manager and Investment Adviser with
SEBI. It also has registration with AMFI as a Mutual Fund Distributor. Angel Broking Limited is a registered entity with SEBI for Research
Analyst in terms of SEBI (Research Analyst) Regulations, 2014 vide registration number INH000000164. Angel or its associates has not
been debarred/ suspended by SEBI or any other regulatory authority for accessing /dealing in securities Market. Angel or its
associates/analyst has not received any compensation / managed or co-managed public offering of securities of the company covered
by Analyst during the past twelve months.
This document is solely for the personal information of the recipient, and must not be singularly used as the basis of any investment
decision. Nothing in this document should be construed as investment or financial advice. Each recipient of this document should
make such investigations as they deem necessary to arrive at an independent evaluation of an investment in the securities of the
companies referred to in this document (including the merits and risks involved), and should consult their own advisors to determine
the merits and risks of such an investment.
Reports based on technical and derivative analysis center on studying charts of a stock's price movement, outstanding positions and
trading volume, as opposed to focusing on a company's fundamentals and, as such, may not match with a report on a company's
fundamentals. Investors are advised to refer the Fundamental and Technical Research Reports available on our website to evaluate the
contrary view, if any
The information in this document has been printed on the basis of publicly available information, internal data and other reliable
sources believed to be true, but we do not represent that it is accurate or complete and it should not be relied on as such, as this
document is for general guidance only. Angel Broking Limited or any of its affiliates/ group companies shall not be in any way
responsible for any loss or damage that may arise to any person from any inadvertent error in the information contained in this report.
Angel Broking Limited has not independently verified all the information contained within this document. Accordingly, we cannot testify,
nor make any representation or warranty, express or implied, to the accuracy, contents or data contained within this document. While
Angel Broking Limited endeavors to update on a reasonable basis the information discussed in this material, there may be regulatory,
compliance, or other reasons that prevent us from doing so.
This document is being supplied to you solely for your information, and its contents, information or data may not be reproduced,
redistributed or passed on, directly or indirectly.
Neither Angel Broking Limited, nor its directors, employees or affiliates shall be liable for any loss or damage that may arise from or in
connection with the use of this information.
Disclosure of Interest Statement
Top Picks
1. Financial interest of research analyst or Angel or his Associate or his relative
No
2. Ownership of 1% or more of the stock by research analyst or Angel or associates or
relatives
No
3. Served as an officer, director or employee of the company covered under Research
No
4. Broking relationship with company covered under Research
No
Ratings (Based on Expected Returns: Buy (> 15%) Accumulate (5% to 15%) Neutral (-5 to 5%)
Over 12 months investment period) Reduce (-5% to -15%) Sell (< -15%)
Hold (Fresh purchase not recommended)
