4QFY2016 Result Update | IT
May 11, 2016
Wipro
BUY
CMP
`539
Performance Highlights
Target Price
`680
(` cr)
4QFY16 3QFY16
% chg (qoq)
4QFY15
% chg (yoy)
Investment Period
12 Months
Net revenue
13,742
12,861
6.9
12,142
13.2
EBITDA
2,914
2,648
10.0
2,791
4.4
Stock Info
EBITDA margin (%)
21.2
20.6
61bps
23.0
(178)bps
Sector
IT
PAT
2,235
2,234
0.0
2,272
(1.6)
Source: Company, Angel Research
Market Cap (` cr)
1,33,147
Net Debt (` cr)
(20,014)
Wipro’s 4QFY2016 results have come in below our expectations. The company’s
IT services posted a revenue of US$1,882mn (V/s US$1,902mn expected) up
Beta
0.7
2.4% qoq. This is against a revenue guidance of US$1,875mn to US$1,912mn
52 Week High / Low
613/509
for the quarter. In constant currency (CC) terms, the company posted a qoq
Avg. Daily Volume
1,11,313
revenue growth of 2.7%. On the operating front, IT Services’ EBIT margin stood at
Face Value (`)
2
20.1% while the overall EBIT margin came in at 18.2% (V/s 18.7% expected), ie
BSE Sensex
25,690
an expansion by
34bp qoq. The net profit for the quarter came in flat on a qoq
Nifty
7,866
basis at `2,235cr (V/s `2,237cr expected). The company gave a guidance of IT
Reuters Code
WIPR.BO
services revenues being in the range of US$1,901mn-US$1,939mn for
Bloomberg Code
WPRO@IN
1QFY2017, posting a qoq growth of
1.0-3.0%. We maintain our buy
recommendation on the stock with a price target of `680.
Shareholding Pattern (%)
Quarterly highlights: The company’s IT services posted a revenue of US$1,882mn
Promoters
73.3
(V/s US$1,902mn expected) up 2.4% qoq. This is against a revenue guidance of
MF / Banks / Indian Fls
7.6
US$1,875mn to US$1,912mn for the quarter. In CC terms, the company posted
FII / NRIs / OCBs
13.4
a qoq revenue growth of 2.7%. On the operating front, IT Services’ EBIT margin
Indian Public / Others
5.7
stood at 20.1% while the overall EBIT margin came in at 18.2% (V/s 18.7%
expected), ie an expansion by
34bp qoq. The net profit for the quarter came in
flat on a qoq basis at `2,235cr (V/s `2,237cr expected). On the operating front,
Abs.(%)
3m 1yr
3yr
the quarterly annualized voluntary attrition dropped from 16.3% in 3QFY2016 to
Sensex
6.9
(5.2)
28.8
14.9% in 4QFY2016.
Wipro
0.5
(0.4)
51.8
Outlook and valuation: The Management remains confident of the business
environment and has set a revenue target of US$15bn by 2020, implying a CAGR
of 20% over the next four years. However the near term guidance implies a moderate
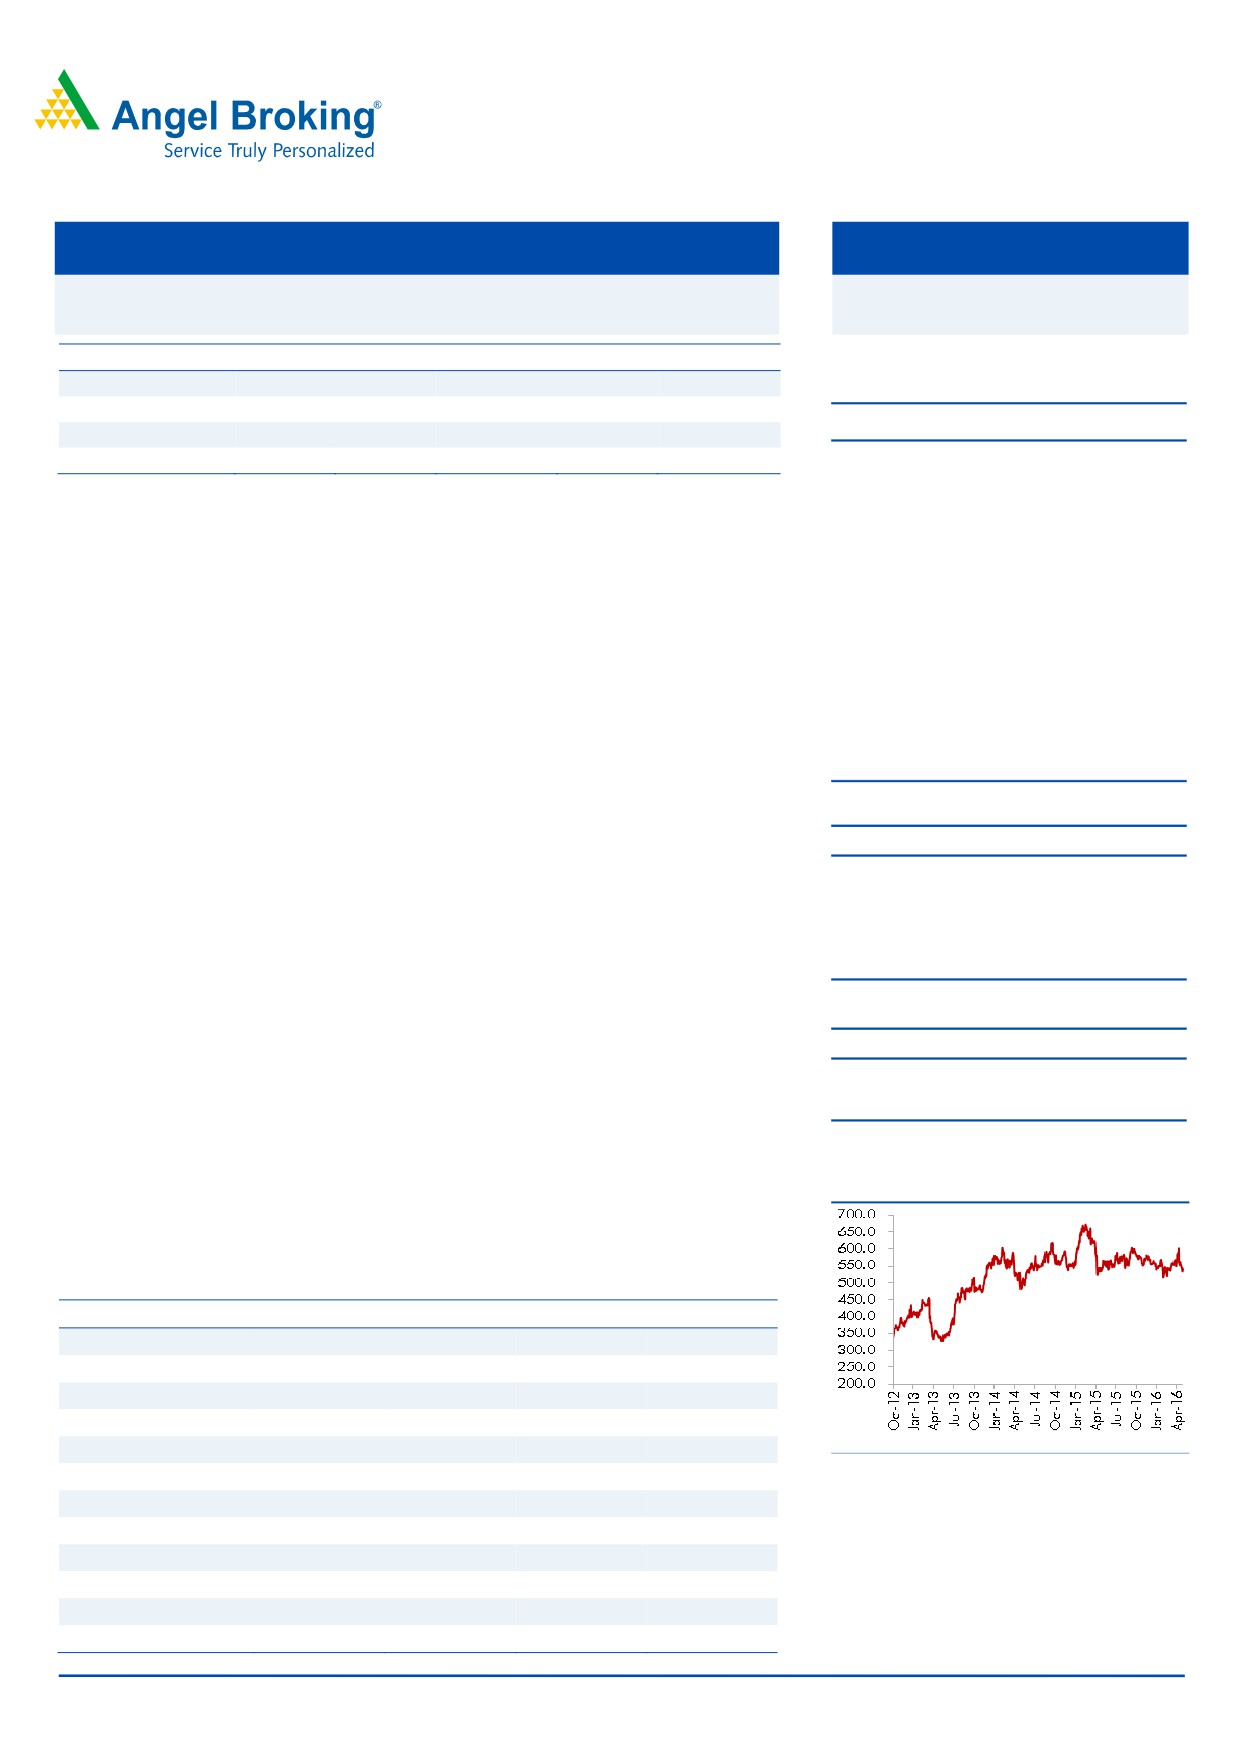
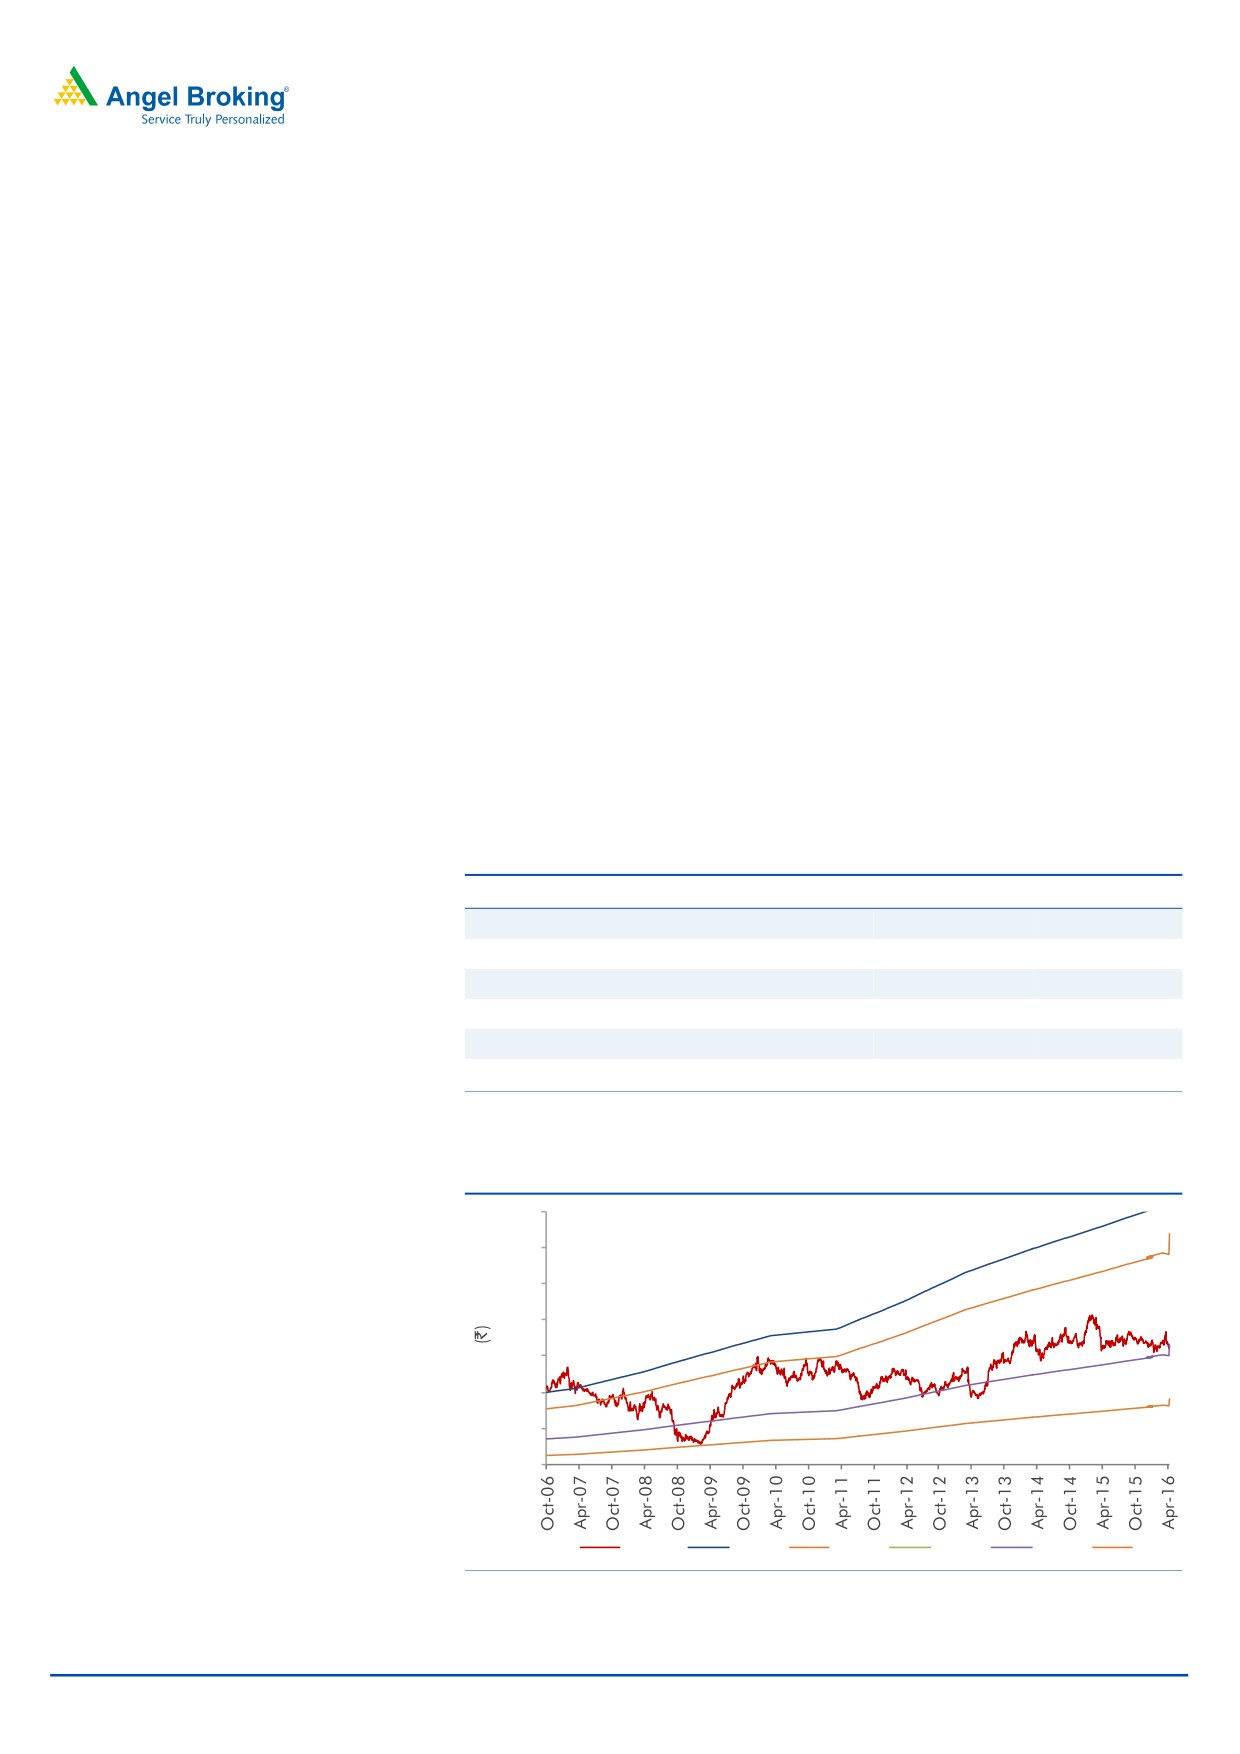
3-year price chart
organic growth. We expect USD and INR revenue CAGR for IT services to be at 12.1%
and 11.6%, respectively, over FY2016-18E. We recommend a Buy on the stock.
Key financials (Consolidated, IFRS)
Y/E March (` cr)
FY2015
FY2016
FY2017E
FY2018E
Net sales
46,955
51,631
58,473
64,320
% chg
8.1
10.0
13.3
10.0
Net profit
8,653
9,361
10,413
11,311
% chg
11.0
8.2
11.2
8.6
EBITDA margin (%)
23.1
23.7
23.8
23.5
Source: Company, Angel Research
EPS (`)
35.1
37.9
42.1
45.8
P/E (x)
15.3
14.2
12.8
11.8
P/BV (x)
3.2
2.8
2.8
2.5
RoE (%)
21.1
20.0
20.0
19.6
RoCE (%)
15.3
14.2
14.7
14.9
Sarabjit kour Nangra
EV/Sales (x)
2.4
2.2
1.8
1.5
+91 22-39357800 Ext: 6806
EV/EBITDA (x)
10.9
9.7
7.8
6.8
Source: Company, Angel Research; Note: CMP as of May 9, 2016
Please refer to important disclosures at the end of this report
1
Wipro | 4QFY2016 Result Update
Exhibit 1: 4QFY2016 performance (Consolidated, IFRS)
Y/E March (` cr)
4QFY16
3QFY16
% chg (qoq)
4QFY15
% chg (yoy)
FY2016
FY2015
% chg (yoy)
Net revenue
13,742
12,861
6.9
12,142
13.2
51,631
47,315
9.1
Cost of revenue
8,879
8,675
2.4
7,896
12.5
34,325
30,846
11.3
Gross profit
4,863
4,186
16.2
4,246
14.5
17,306
16,469
5.1
SGA expense
1,949
1,537
26.8
1,455
33.9
6,107
5,643
8.2
EBITDA
2,914
2,648
10.0
2,791
4.4
11,199
10,826
3.4
Dep. and amortisation
430
352
22.2
365
17.9
1,497
1,282
16.7
EBIT
2,484
2,296
8.2
2,426
2.4
9,702
9,544
1.7
Other income
433
572
(24.2)
486
1,770
1,626
8.8
PBT
2,917
2,868
1.7
2,912
0.2
11,472
11,170
2.7
Income tax
663
625
6.1
626
5.8
2,531
2,462
2.8
PAT
2,254
2,243
0.5
2,286
(1.4)
8,941
8,706
2.7
Minority interest
19
9
15
49
53
Adj. PAT
2,235
2,234
0.0
2,272
(1.6)
8,892
8,653
2.8
Diluted EPS
9.1
9.1
(0.1)
9.2
(1.3)
27.1
35.1
(22.8)
Gross margin (%)
35.4
32.5
284bps
35.0
42bps
33.5
34.8
(129)bps
EBITDA margin (%)
21.2
20.6
61bps
23.0
(178)bps
21.7
22.9
(119)bps
EBIT margin (%)
18.2
17.9
34bps
20.0
(178)bps
18.8
20.2
(138)bps
PAT margin(%)
16.3
17.4
(111)bps
18.7
(245)bps
17.2
18.3
(107)bps
Source: Company, Angel Research
Exhibit 2: 4QFY2016 - Actual vs Angel estimates
(` cr)
Actual
Estimate
Variation (%)
Net revenue
13,742
13,735
0.0
EBIT margin (%)
18.2
18.7
(50)bps
PAT
2,235
2,237
(0.1)
Source: Company, Angel Research
Just in line results
The company’s IT services posted a revenue of US$1,882mn (V/s US$1,902mn
expected) up 2.4% qoq. In CC terms, the company posted a qoq revenue growth
of 2.7%. This is against a revenue guidance of US$1,875mn to US$1,912mn for
the quarter. Overall, in rupee terms, revenues grew by 6.9% qoq to `13,742cr
(V/s `13,735cr expected), led by rupee deprecation.
In terms of geographies, Americas grew 1.8% qoq in CC terms, India and Middle
East grew 3.0% qoq in CC terms, Europe grew 3.0% qoq in CC terms and APAC
and Other Emerging Markets de-grew 2.1% qoq in CC terms.
In terms of business units, Healthcare, Life Sciences & Services grew 13.1% qoq
(CC), Retail, Consumer Goods and Transportation grew 1.8% qoq (CC), while
Manufacturing grew 4.0% qoq (CC). Its key verticals, Global Media & Telecom and
Finance Solutions posted a growth of 0.1% qoq (CC) and -0.3% qoq (CC),
respectively. Energy, Natural Resources & Utilities on the other hand posted a CC
growth of 1.0% qoq while Retail & Transportation posted a 1.8% qoq growth in CC
terms.
May 11, 2016
2
Wipro | 4QFY2016 Result Update
During the quarter, Wipro completed the acquisition of Health Plan Services, a
BPaaS company in the US.
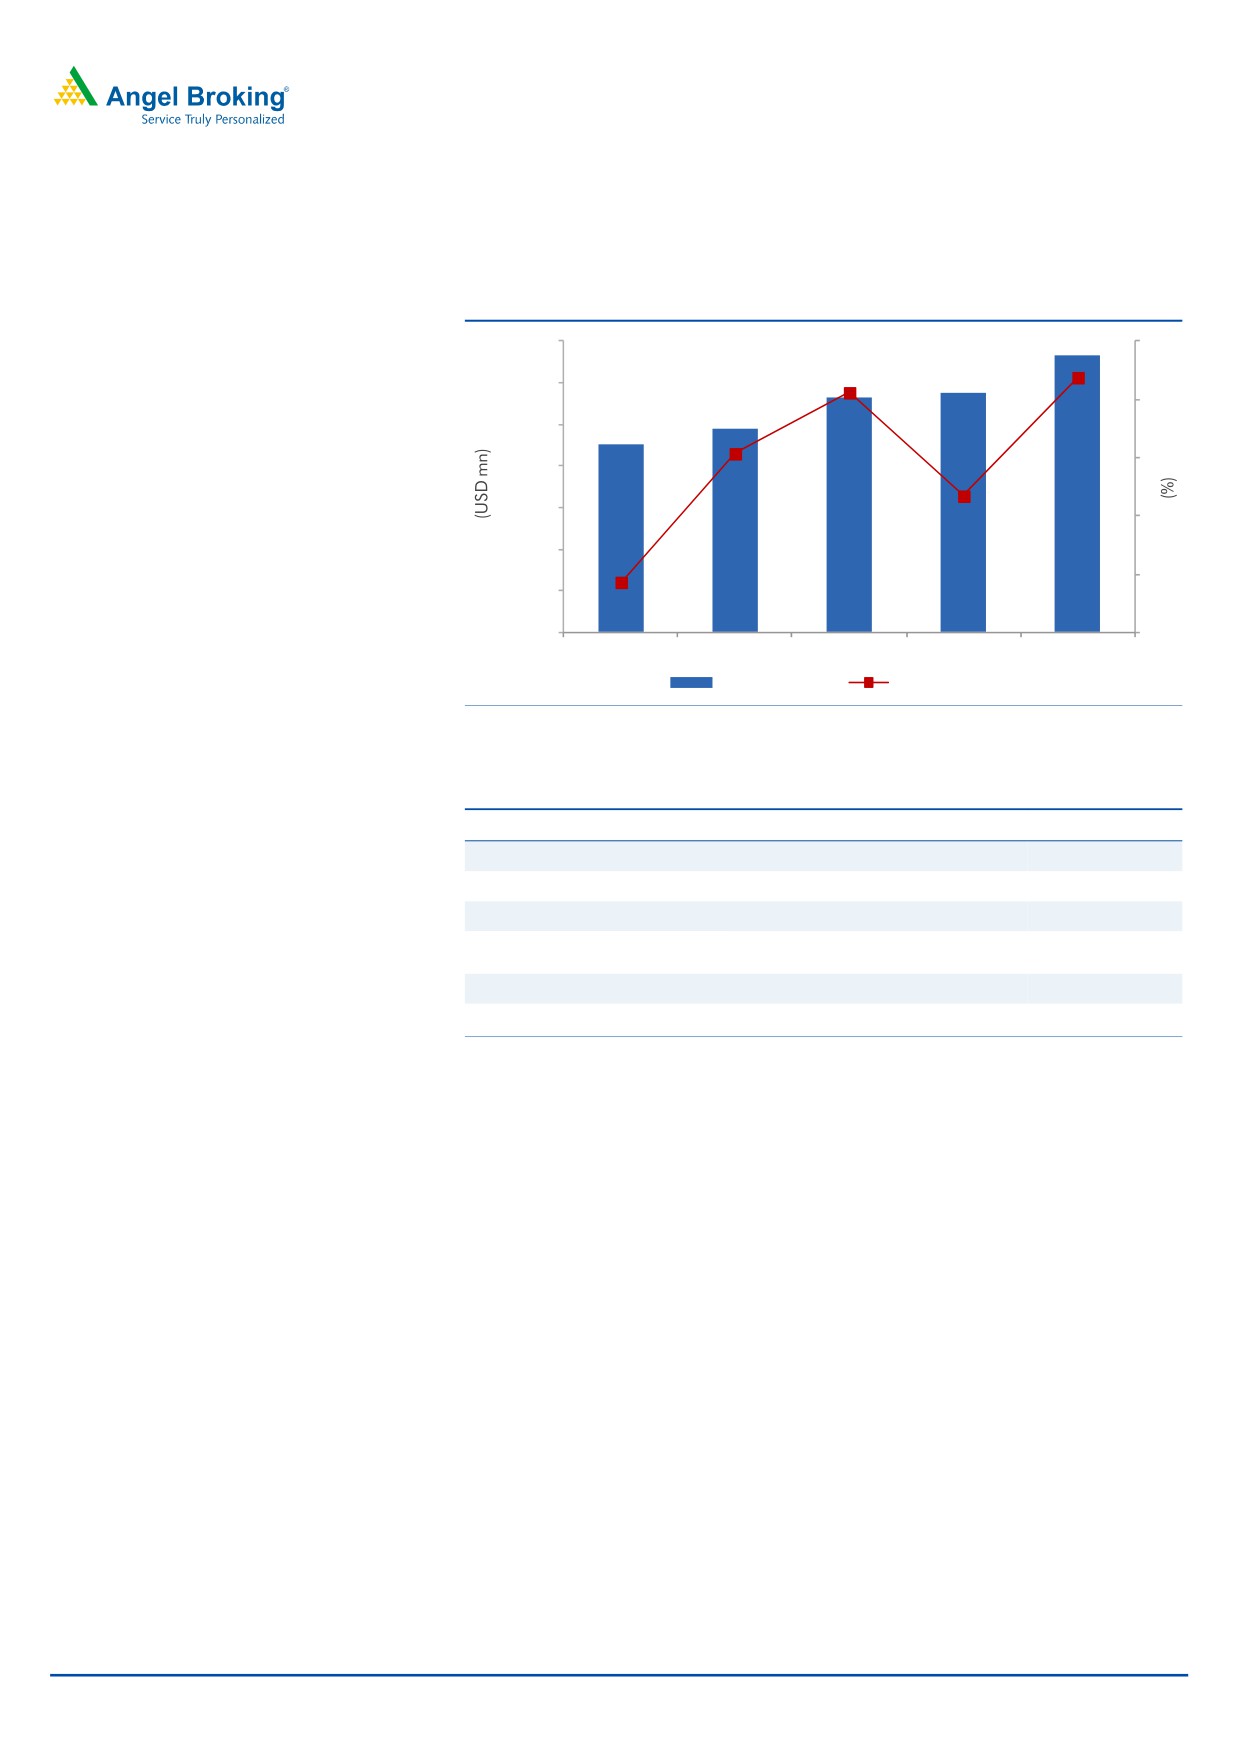
Exhibit 3: Trend in IT Services revenue
1,900
1,882
3
1,832
1,838
2.4
1,850
2.1
2
1,794
1,800
1,775
1.1
1
1,750
1,700
0.3
0
1,650
-1
(1.1)
1,600
1,550
-2
4QFY15
1QFY16
2QFY16
3QFY16
4QFY16
IT services
qoq growth (%)
Source: Company, Angel Research
Exhibit 4: Revenue growth (Industry wise - CC basis)
% to revenue
% growth (QoQ)
% growth (yoy)
Global media and telecom
13.1
0.1
6.2
Financial solutions
25.4
(0.3)
3.6
Manufacturing and hi-tech
18.8
4.0
9.1
Healthcare, life sciences and
13.3
13.1
20.1
services
Retail and transportation
15.4
1.8
15.2
Energy and utilities
14.0
1.0
(1.8)
Source: Company, Angel Research
Services wise, Wipro’s anchor service lines ADM (contributed 45.3% to revenue)
and Technology Infrastructure Services (contributed 28.9% to revenue) registered a
dip of 0.6% and growth of 5.5% qoq, respectively. Analytics and Information
Management (which contributed 7.2% of sales) de-grew by 1.0% qoq. Product
Engineering and Mobility (which contributed 8.0% of sales) grew by 1.8% qoq.
Consulting, R&D and BPO posted a qoq growth of -8.2%, 1.1% and 10.6%,
respectively.
May 11, 2016
3
Wipro | 4QFY2016 Result Update
Exhibit 5: Revenue growth (Service wise)
Service verticals
% to revenue
% growth (QoQ)
% growth (yoy)
Technology infrastructure services
28.9
5.5
9.9
Analytics and information management
7.2
(1.0)
6.7
BPO
10.6
10.6
19.9
Product engineering and mobility
8.0
1.8
11.5
ADM
45.3
(0.6)
0.2
R&D business
10.4
1.1
7.1
Consulting
1.4
(8.2)
(15.4)
Source: Company, Angel Research
Geography wise, the developed economies America and Europe grew by 1.8%
and 6.6% qoq in CC terms, respectively. India posted a 3.0% qoq CC growth
during the period. However, APAC and other emerging markets posted a 2.1% qoq de-
growth for the quarter.
Exhibit 6: Revenue growth (Geography wise, CC basis)
% to revenue
% growth (QoQ)
% growth (yoy)
America
52.5
1.8
8.5
Europe
25.6
6.6
3.8
India and Middle East
11.0
3.0
14.0
APAC and other emerging markets
10.9
(2.1)
7.8
Source: Company, Angel Research
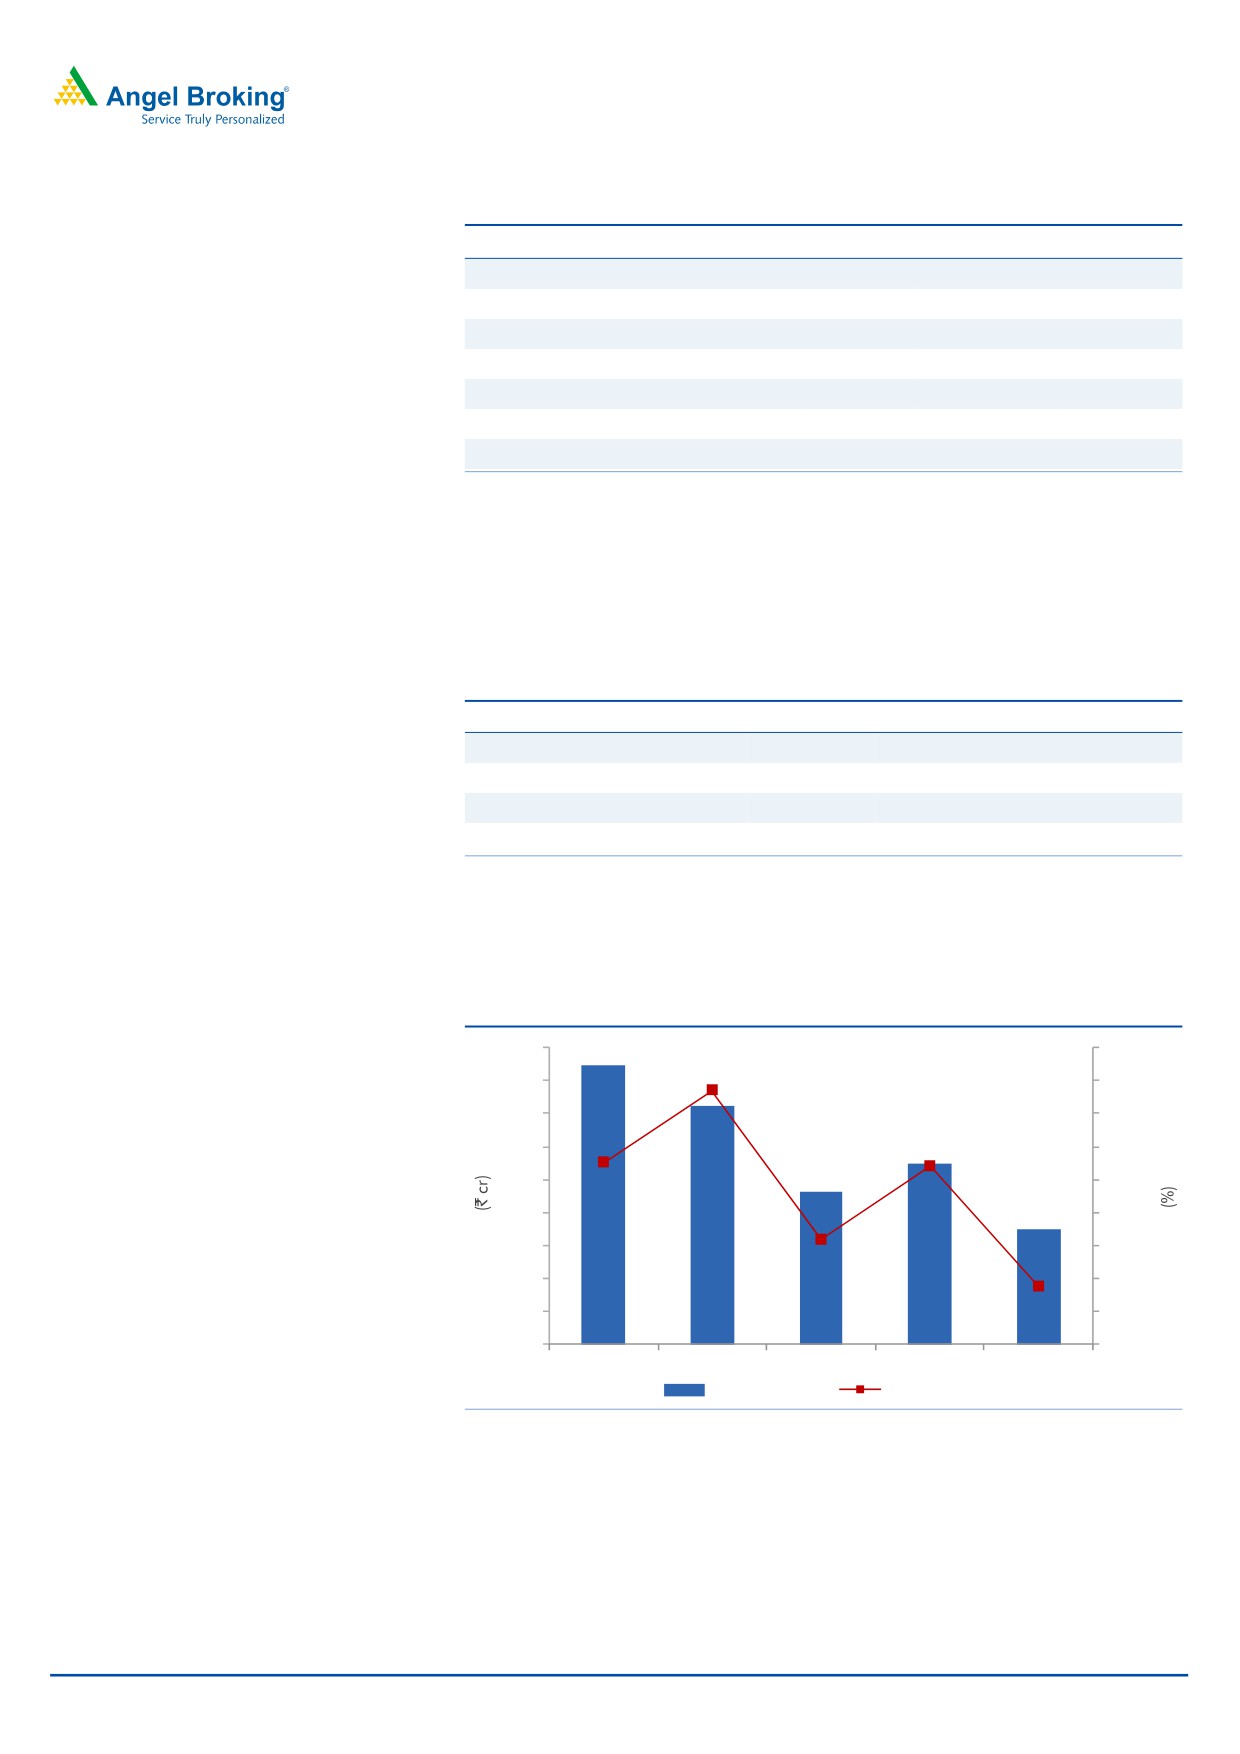
The IT Products segment reported a 52.5% yoy dip in revenue to `449cr, during
the quarter.
Exhibit 7: IT Products - Revenue growth (yoy)
1,000
20.0
900
7.0
10.0
800
-
700
(10.0)
(16.0)
(14.9)
600
(20.0)
500
(30.0)
400
(38.3)
(40.0)
300
(50.0)
(52.5)
200
(60.0)
944
821
565
650
449
100
(70.0)
4QFY15
1QFY16
2QFY16
3QFY16
4QFY16
IT products
yoy growth (%)
Source: Company, Angel Research
May 11, 2016
4
Wipro | 4QFY2016 Result Update
Hiring and utilization
Wipro reported a net addition of 2,248 employees in its IT Services’ employee
base, which now stands at 172,912. Voluntary attritions (annualized) in the global
IT business increased considerably, but remained stagnant on a net basis at
16.1%. The utilization rate of the global IT business moved up by 170bp
sequentially to 68.1%. Going ahead, an improvement in utilization level will be an
important margin lever.
Exhibit 8: Employee pyramid
Employee pyramid
4QFY15 1QFY16 2QFY16 3QFY16 4QFY16
Utilization - Global IT (%)
70.5
71.3
69.5
66.4
68.1
Attrition (%)
Global IT
16.5
16.4
16.4
16.3
16.1
BPO
13.3
12.0
10.2
9.9
11.1
Net additions
1,351
3,572
6,607
2,268
2,248
Source: Company, Angel Research
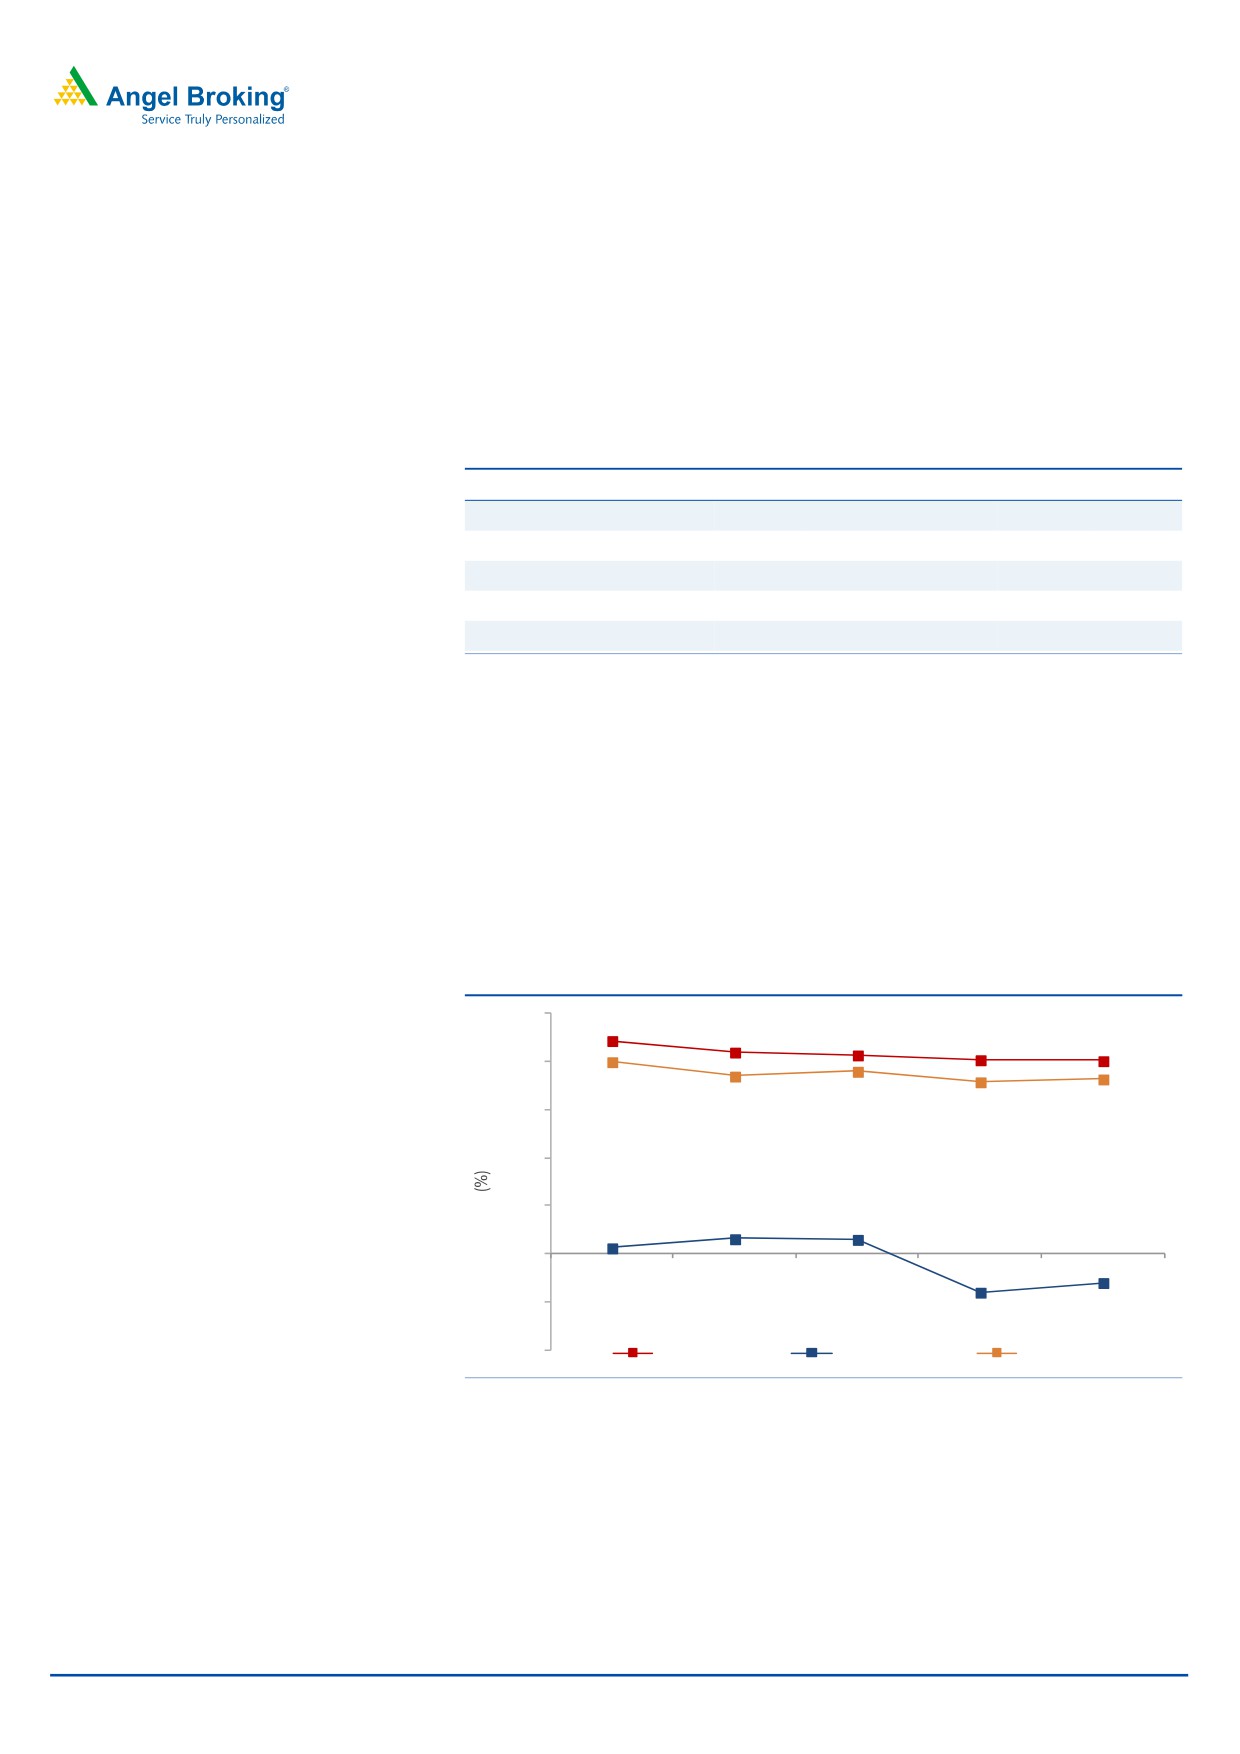
Margins dip
On the operating front, the EBIT margin for the IT services business came in at
20.1% V/s 20.2% in 3QFY2016, a downtick of 10bp qoq; while the consolidated
EBIT margin came in 18.2% V/s 17.9% in 3QFY2016. The miss in terms of overall
EBIT margins was largely on account of operating losses in the hardware business
to the tune of `29cr (-3.0% EBIT margin). This marks the third consecutive quarter
of losses in the product business.
Exhibit 9: Segment-wise EBIT margin trend
25.0
22.2
21.0
20.7
20.2
20.1
20.0
20.0
18.5
19.0
18.2
15.0
17.9
10.0
5.0
1.5
1.6
0.6
-
4QFY15
1QFY16
2QFY16
3QFY16
4QFY16
(5.0)
(3.0)
(4.0)
(10.0)
IT services
IT products
Consolidated
Source: Company, Angel Research
May 11, 2016
5
Wipro | 4QFY2016 Result Update
Client pyramid
Wipro added 119 new clients during the quarter (including customers of Cellent
and HealthPlan Services) with its active client base now standing at
1,223.
Amongst these, 1 has been in the US$75mn+ bracket, 3 in US$20mn+ bracket
and 5 in the US$3mn+ bracket. Wipro cited that there has been increasing pricing
pressure in large deals, led by growing competitive pressures. Both, deal sizes as
well as value of deals are under pressure. In such an environment, Wipro has been
trying to offset pressure by increasing the use of automation.
Exhibit 10: Client metrics
Particulars
4QFY15
1QFY16
2QFY16
3QFY16
4QFY16
US$100mn plus
11
10
10
9
9
US$75mn-$100mn
4
4
7
8
9
US$50mn-$75mn
16
15
14
15
15
US$20mn-$50mn
55
55
54
53
56
US$10mn-$20mn
64
59
69
69
71
US$5mn-$10mn
81
81
90
93
88
US$3mn-$5mn
80
69
77
78
83
US$1mn-$3mn
231
218
212
211
219
New client addition
65
36
67
39
119
Active customers
1,054
1071
1100
1105
1223
Source: Company, Angel Research
Investment highlights
Moderate outlook on organic growth: For 1QFY2017, the company has given a
revenue guidance of US$1,901-1,939mn, implying a US$ qoq growth of 1.0-
3.0%. The guidance includes the full integration of HPS (Health Plan Services), but
doesn’t include the acquisition of Viteos, as the same is still to get approval. Given
HPS’ quarterly revenue run-rate of US$57mn, this would imply contribution of 2%
from the acquisition, hence suggesting organic revenue growth of -1% to 1%. We
expect US$ and INR revenue CAGR to be at 10.6% and 10.2%, respectively, over
FY2016-18E.
Target CAGR of 20%: The company as part of its vision for 2020 is targeting to
reach US$15bn revenues with 23% EBIT margin, implying revenue CAGR of ~20%
over the next four years. If the margins expand by 300bp, then it would imply an
even higher CAGR for earnings. The company sees itself better placed than this
time last year to latch on to opportunities in the market though the same
aggression and optimism is yet to reflect in its performance. Going by the
guidance, the company’s organic growth outlook is not even closer to its peers.
However, on the acquisition front, the company has been very aggressive in
comparison to the peers.
During the quarter, the company acquired HealthPlan Services from Water Street
Healthcare Partners. Since partnering with Water Street in 2008, HealthPlan
Services has grown to become the leading independent technology and Business
Process as a Service (BPaaS) provider in the US health insurance market. As part of
the agreement, Wipro will acquire 100% of HealthPlan Services' shares for a
purchase consideration of US$460mn. Headquartered in Tampa, Florida,
May 11, 2016
6
Wipro | 4QFY2016 Result Update
HealthPlan Services employs over 2,000 associates. HealthPlan Services offers
market-leading technology platforms and a fully integrated Business Process as a
Service (BPaaS) solution to health insurance companies in the individual, group
and ancillary markets. HealthPlan Services’ BPaaS solutions are ideal for payers
who want to operate in the private and public exchanges and the off-exchange
individual market in the US.
Outlook and valuation
The new CEO of the company has put in place an aggressive target for itself of
20% revenue CAGR over the next four years, with much improved profitability
(where the company has significant levers in the form of automation and
improving utilization levels). Also, the company announced a total of `6/share in
Dividends and up to `2,500cr through the buyback. Thus the total payout in
FY2016 implies a payout of ~45%, compared to 34% in FY2015. The company
guided at sustaining ~40% payout going forward, which will improve the overall
returns of the shareholders. On the valuation front, the stock is currently
trading at 14.3x FY2017E and 13.1x FY2018E EPS, ie at a discount to its
peers, while we expect the same to improve once the company’s performance
comes in line with the peers in terms of growth and profitability. We
recommend a Buy rating on the stock with a target price of `680.
Exhibit 11: Key assumptions
FY2017E
FY2018E
Revenue growth - IT services (USD)
14.2
10.0
USD-INR rate (realized)
65.7
65.7
Revenue growth - Consolidated (`)
13.3
10.0
EBITDA margin (%)
23.8
23.5
Tax rate (%)
22.0
22.0
EPS growth (%)
11.2
8.6
Source: Company, Angel Research
Exhibit 12: One-year forward PE chart
1100
950
800
650
500
350
200
50
Price
27x
22x
17x
12x
7x
Source: Company, Angel Research
May 11, 2016
7
Wipro | 4QFY2016 Result Update
Exhibit 13: Recommendation summary
Company
Reco
CMP Tgt. price Upside
FY2017E FY2017E
FY2015-17E
FY2017E FY2017E
(`)
(`)
(%)
EBITDA (%)
P/E (x)
EPS CAGR (%) EV/Sales (x)
RoE (%)
HCL Tech
Buy
723
1,038
43.6
21.5
12.5
10.6
1.6
18.8
Infosys
Accumulate
1,199
1,374
14.6
27.5
18.4
8.9
3.3
22.4
TCS
Buy
2,515
3,004
19.4
28.3
17.8
12.8
3.5
34.6
Tech Mahindra
Accumulate
478
530
10.8
17.0
14.2
8.0
1.3
19.1
Wipro
Buy
539
680
26.2
23.8
14.2
9.9
1.8
20.0
Source: Company, Angel Research
Company background
Wipro is among the leading Indian companies, majorly offering IT services. The
company is also engaged in the IT hardware (10% of sales) business. Wipro's IT
arm is India's fourth largest IT firm, employing more than 1,68,000 professionals,
offering a wide portfolio of services such as ADM, consulting and package
implementation, and servicing more than 1,000 clients.
May 11, 2016
8
Wipro | 4QFY2016 Result Update
Profit & Loss account (Consolidated, IFRS)
Y/E March (` cr)
FY2014 FY2015 FY2016 FY2017E FY2018E
Net revenue
43,427
46,955
51,631
58,473
64,320
Cost of revenues
29,549
30,846
35,109
39,762
43,738
Gross profit
13,878
16,108
16,522
18,711
20,582
% of net sales
32.0
34.3
32.0
32.0
32.0
Selling and mktg exp.
2,925
3,063
3,459
3,918
4,309
% of net sales
6.7
6.5
6.7
6.7
6.7
General and admin exp.
2,354
2,585
2,788
3,158
3,473
% of net sales
5.4
5.5
5.4
5.4
5.4
Depreciation and amortization
1,111
1,282
1,342
1,520
1,672
% of net sales
2.6
2.7
2.6
2.6
2.6
EBIT
8,600
9,179
10,275
11,636
12,800
% of net sales
19.8
19.5
19.9
19.9
19.9
Other income, net
1,501
1,990
1,808
1,808
1,808
Share in profits of eq. acc. ass.
0
0
0
0
0
Profit before tax
10,101
11,168
12,082
13,444
14,608
Provision for tax
2,260
2,462
2,658
2,958
3,214
% of PBT
22.4
22.0
22.0
22.0
22.0
PAT
7,840
8,706
9,424
10,486
11,394
Share in earnings of associate
-
-
-
-
1
Minority interest
44
53
63
73
83
Adj. PAT
7,797
8,653
9,361
10,413
11,311
Diluted EPS (`)
31.5
35.1
37.9
42.1
45.8
May 11, 2016
9
Wipro | 4QFY2016 Result Update
Balance sheet (Consolidated, IFRS)
Y/E March (` cr)
FY2014
FY2015
FY2016
FY2017E
FY2018E
Assets
Goodwill
6,342
6,808
10,199
6,316
6,317
Intangible assets
194
793
1,584
1,584
1,584
Property, plant & equipment
5,145
5,421
6,495
6,795
7,095
Investment in equ. acc. investees
268
387
491
491
491
Derivative assets
29
74
26
26
26
Non-current tax assets
1,019
1,141
1,175
1,175
1,175
Deferred tax assets
336
295
380
380
380
Other non-current assets
1,430
1,437
1,583
1,583
1,583
Total non-current assets
14,762
16,354
21,933
18,350
18,651
Inventories
229
485
539
539
539
Trade receivables
8,539
9,153
10,238
11,396
12,536
Other current assets
3,947
7,336
10,407
10,407
10,407
Unbilled revenues
3,933
4,234
4,827
4,827
4,827
Available for sale investments
6,056
5,391
13,294
13,294
13,294
Current tax assets
977
649
781
781
781
Derivative assets
366
508
568
568
568
Cash and cash equivalents
11,420
15,894
9906
18976
24128
Total current assets
35,469
43,649
50,559
60,788
67,079
Total assets
50,230
60,003
72,492
79,137
85,730
Equity
Share capital
493
493
494
493
494
Share premium
1,266
1,403
1,462
1,462
1,462
Retained earnings
31,495
37,225
42,574
47,898
53,613
Share based payment reserve
102
131
223
102
103
Other components of equity
1,047
1,545
1,853
1,853
1,853
Shares held by controlled trust
(54)
-
-
-
1
Equity attrib. to shareholders of Co.
34,350
40,789
46,608
51,808
57,525
Minority interest
139
165
222
222
222
Total equity
34,489
40,954
46,830
52,031
57,747
Liabilities
Long term loans and borrowings
1,091
1,271
1,736
1,736
1,736
Deferred tax liability
180
324
511
511
511
Derivative liabilities
63
16
12
12
12
Non-current tax liability
345
670
823
823
823
Other non-current liabilities
417
366
723
723
723
Provisions
1
1
1
1
2
Total non-current liabilities
2096
2647
3806
3805
3806
Loans and bank overdraft
4,068
6,621
10,786
10,786
10,786
Trade payables
5,226
5,875
6,819
7,714
8,485
Unearned revenues
1,277
1,655
1,808
1,877
1,878
Current tax liabilities
1,248
804
702
1,183
1,285
Derivative liabilities
250
75
234
234
234
Other current liabilities
1,439
1,222
1,382
1,382
1,382
Provisions
137
152
126
126
126
Total current liabilities
13,646
16,403
21,856
23,302
24,177
Total liabilities
15,742
19,050
25,662
27,107
27,983
Total equity and liabilities
50,230
60,003
72,492
79,137
85,730
May 11, 2016
10
Wipro | 4QFY2016 Result Update
Cash flow statement (Consolidated, IFRS)
Y/E March (` cr)
FY2014
FY2015
FY2016
FY2017E
FY2018E
Pre tax profit from operations
8,935
11,168
12,082
13,444
14,608
Depreciation
1,111
1,282
1,342
1,520
1,672
Expenses (deferred)/written off
(13)
(13)
(13)
(13)
(13)
Pre tax cash from operations
10,033
12,438
13,412
14,952
16,267
Other income/prior period ad
1,165
1,990
1,808
1,808
1,808
Net cash from operations
11,198
14,428
15,220
16,760
18,075
Tax
(2,260)
(2,462)
(2,658)
(2,958)
(3,214)
Cash profits
8,938
11,965
12,562
13,802
14,862
(Inc)/dec in current assets
(2,653)
(8,181)
(6,910)
(10,229)
(6,292)
Inc/(dec) in current liab.
(828)
2,757
5,453
1,446
875
Net trade working capital
(3,482)
(5,423)
(1,457)
(8,783)
(5,417)
Cashflow from oper. actv.
5,456
6,542
11,105
5,019
9,445
(Inc)/dec in fixed assets
(1,203)
(276)
(1,075)
(300)
(300)
(Inc)/dec in intangibles
(889)
(600)
(791)
-
-
(Inc)/dec in investments
594
(119)
(104)
-
-
(Inc)/dec in net def. tax assets
87
-
-
-
-
(Inc)/dec in derivative assets
(24)
-
-
-
-
(Inc)/dec in non-current tax asset
12
7
146
-
-
(Inc)/dec in minority interest
22
9
10
10
10
Inc/(dec) in other non-current liab
90
273
510
-
-
(Inc)/dec in other non-current ast.
(122)
(122)
(34)
-
-
Cashflow from investing activities
(1,667)
(826)
(1,338)
(290)
(290)
Inc/(dec) in debt
1,006
180
465
-
-
Inc/(dec) in equity/premium
(123)
314
(14,441)
9,430
1,593
Dividends
(1,736)
(1,736)
(1,780)
(5,089)
(5,596)
Cashflow from financing activities
(853)
(1,242)
(15,756)
4,341
(4,003)
Cash generated/(utilized)
2,936
4,474
(5,988)
9,070
5,152
Cash at start of the year
8,484
11,420
15,894
9,906
18,976
Cash at end of the year
11,420
15,894
9,906
18,976
24,128
May 11, 2016
11
Wipro | 4QFY2016 Result Update
Key Ratios
Y/E March
FY2014 FY2015 FY2016 FY2017E FY2018E
Valuation ratio (x)
P/E (on FDEPS)
17.1
15.3
14.2
12.8
11.8
P/CEPS
8.1
7.5
6.8
6.0
5.5
P/BVPS
3.9
3.2
2.8
2.8
2.5
Dividend yield (%)
1.5
2.2
1.1
3.8
4.2
EV/Sales
2.7
2.4
2.2
1.8
1.5
EV/EBITDA
12.1
10.9
9.7
7.8
6.8
EV/Total assets
2.3
1.9
1.5
1.3
1.1
Per share data (`)
EPS (Fully diluted)
31.5
35.1
37.9
42.1
45.8
Cash EPS
66.3
72.1
79.4
89.2
97.5
Dividend
8.0
12.0
6.0
20.6
22.6
Book value
139.5
165.7
189.4
193.7
216.9
Return ratios (%)
RoCE (pre-tax)
17.1
15.3
14.2
14.7
14.9
Angel RoIC
32.6
28.8
26.3
28.7
30.5
RoE
22.6
21.1
20.0
20.0
19.6
Turnover ratios(x)
Asset turnover (fixed assets)
8.5
8.9
8.7
8.8
9.3
Receivables days
68
69
69
70
71
Payable days
67
67
67
67
67
May 11, 2016
12
Wipro | 4QFY2016 Result Update
Research Team Tel: 022 - 39357800
DISCLAIMER
Angel Broking Private Limited (hereinafter referred to as “Angel”) is a registered Member of National Stock Exchange of India Limited,
Bombay Stock Exchange Limited and MCX Stock Exchange Limited. It is also registered as a Depository Participant with CDSL and
Portfolio Manager with SEBI. It also has registration with AMFI as a Mutual Fund Distributor. Angel Broking Private Limited is a
registered entity with SEBI for Research Analyst in terms of SEBI (Research Analyst) Regulations, 2014 vide registration number
INH000000164. Angel or its associates has not been debarred/ suspended by SEBI or any other regulatory authority for accessing
/dealing in securities Market. Angel or its associates including its relatives/analyst do not hold any financial interest/beneficial
ownership of more than 1% in the company covered by Analyst. Angel or its associates/analyst has not received any compensation /
managed or co-managed public offering of securities of the company covered by Analyst during the past twelve months. Angel/analyst
has not served as an officer, director or employee of company covered by Analyst and has not been engaged in market making activity
of the company covered by Analyst.
This document is solely for the personal information of the recipient, and must not be singularly used as the basis of any investment
decision. Nothing in this document should be construed as investment or financial advice. Each recipient of this document should
make such investigations as they deem necessary to arrive at an independent evaluation of an investment in the securities of the
companies referred to in this document (including the merits and risks involved), and should consult their own advisors to determine
the merits and risks of such an investment.
Reports based on technical and derivative analysis center on studying charts of a stock's price movement, outstanding positions and
trading volume, as opposed to focusing on a company's fundamentals and, as such, may not match with a report on a company's
fundamentals.
The information in this document has been printed on the basis of publicly available information, internal data and other reliable
sources believed to be true, but we do not represent that it is accurate or complete and it should not be relied on as such, as this
document is for general guidance only. Angel Broking Pvt. Limited or any of its affiliates/ group companies shall not be in any way
responsible for any loss or damage that may arise to any person from any inadvertent error in the information contained in this report.
Angel Broking Pvt. Limited has not independently verified all the information contained within this document. Accordingly, we cannot
testify, nor make any representation or warranty, express or implied, to the accuracy, contents or data contained within this document.
While Angel Broking Pvt. Limited endeavors to update on a reasonable basis the information discussed in this material, there may be
regulatory, compliance, or other reasons that prevent us from doing so.
This document is being supplied to you solely for your information, and its contents, information or data may not be reproduced,
redistributed or passed on, directly or indirectly.
Neither Angel Broking Pvt. Limited, nor its directors, employees or affiliates shall be liable for any loss or damage that may arise from
or in connection with the use of this information.
Note: Please refer to the important ‘Stock Holding Disclosure' report on the Angel website (Research Section). Also, please refer to the
latest update on respective stocks for the disclosure status in respect of those stocks. Angel Broking Pvt. Limited and its affiliates may
have investment positions in the stocks recommended in this report.
Disclosure of Interest Statement
Wipro
1. Analyst ownership of the stock
No
2. Angel and its Group companies ownership of the stock
No
3. Angel and its Group companies' Directors ownership of the stock
No
4. Broking relationship with company covered
No
Note: We have not considered any Exposure below ` 1 lakh for Angel, its Group companies and Directors
Ratings (Based on expected returns
Buy (> 15%)
Accumulate (5% to 15%)
Neutral (-5 to 5%)
over 12 months investment period):
Reduce (-5% to -15%)
Sell (< -15)
May 11, 2016
13