2QFY2016 Result Update | IT
November 2, 2015
Wipro
BUY
CMP
`573
Performance Highlights
Target Price
`719
(` cr)
2QFY16 1QFY16
% chg (qoq)
2QFY15
% chg (yoy)
Investment Period
12 Months
Net revenue
12,514
12,371
1.2
11,684
7.1
EBITDA
2,729
2,606
4.7
2,482
9.9
Stock Info
EBITDA margin (%)
21.8
21.3
51bp
21.2
56bp
Sector
IT
PAT
2,235
2,188
2.2
2,085
7.2
Market Cap (` cr)
141,602
Source: Company, Angel Research
Net Debt (` cr)
(20,014)
Wipro posted a 2.1% qoq growth in IT revenue to US$1,832mn for 2QFY2016
Beta
0.6
(V/s an expected US$1,826mn). In Constant Currency terms (CC), the company
52 Week High / Low
677/513
posted a 3.1% qoq revenue growth. On the EBIDTA front, margins came in at
Avg. Daily Volume
121,503
21.7% V/s an expected 21.3%. The EBIT margin came in at 19.0% V/s (18.7%
Face Value (`)
2
expected), a qoq expansion of 44bp. The IT services segment posted an EBIT
margin of 20.7% V/s 21.0% in 1QFY2016. Thus, the net profit came in at
BSE Sensex
26,657
`2,235cr (V/s `2,223cr expected), a growth of 2.2% qoq. The company has
Nifty
8,066
guided towards sales of US$1,841-1,878mn for 3QFY2016, a growth of 0.5-
Reuters Code
WIPR.BO
2.5%. The guidance factors in fewer working days in 3QFY2016 and slow ramp-
Bloomberg Code
WPRO@IN
up of clients. We currently have a Buy rating on the stock.
Quarterly highlights: Wipro posted a
2.1% qoq growth in IT revenue to
Shareholding Pattern (%)
US$1,832mn for 2QFY2016 (V/s an expected US$1,826mn). In CC, the
Promoters
73.4
company posted a 3.1% qoq revenue growth. In rupee terms, the company
MF / Banks / Indian Fls
7.1
posted a 1.2% qoq revenue growth to `12,514cr V/s an expected `12,703cr. On
FII / NRIs / OCBs
13.8
the EBIDTA front, margins came in at 21.7% V/s an expected 21.3%. The IT
services segment posted an EBIT margin of 20.7% V/s 21.0% in 1QFY2016. In
Indian Public / Others
5.7
terms of the operating matrix, the net utilization level came in at 77.2% V/s 79.4%
in 1QFY2016 and the attrition rate was 16.8% V/s 16.4% in 1QFY2016. The
Abs.(%)
3m 1yr
3yr
company added 1 client in the US$50mn+ bracket and 3 in US$10mn+ bracket,
during the quarter.
Sensex
(3.8)
(2.5)
44.6
Wipro
2.2
2.5
65.0
Outlook and valuation: The Management remains confident of revenue growth
pick-up, citing momentum in large deal closures and win rates, uptick in
discretionary spending, strong business pipeline and with demand from the US
3-year price chart
sustaining. We expect USD and INR revenue CAGR for IT services to be at 10.0%
800.0
and 11.8%, respectively, over FY2015-17E. We recommend a Buy.
700.0
600.0
Key financials (Consolidated, IFRS)
500.0
Y/E March (` cr)
FY2014
FY2015
FY2016E
FY2017E
400.0
Net sales
43,427
46,955
52,414
58,704
300.0
% chg
16.0
8.1
11.6
12.0
200.0
100.0
Net profit
7,797
8,653
9,483
10,449
-
% chg
17.5
11.0
9.6
10.2
2
3
3
3
4
4
5
5
5
1
1
1
1
1
1
1
ŧ
r
-
c
r
1
1
ŧ
EBITDA margin (%)
22.9
23.1
23.7
23.8
c
a
u
e
p
pe
n
n
c
O M
J
D
A
S
J
a
uJ
O
EPS (`)
31.5
35.1
38.4
42.3
P/E (x)
18.2
16.3
14.9
13.6
Source: Company, Angel Research
P/BV (x)
4.1
3.5
2.9
2.6
RoE (%)
22.6
21.1
19.5
18.0
RoCE (%)
17.1
15.3
15.1
14.7
Sarabjit kour Nangra
EV/Sales (x)
2.9
2.6
2.2
1.8
+91 22-39357800 Ext: 6806
EV/EBITDA (x)
12.9
11.6
9.7
7.9
Source: Company, Angel Research; Note: CMP as of October 30, 2015
Please refer to important disclosures at the end of this report
1
Wipro | 2QFY2016 Result Update
Exhibit 1: 2QFY2016 performance (Consolidated, IFRS)
Y/E March (` cr)
2QFY16
1QFY16
% chg (qoq)
2QFY15
% chg (yoy) 1HFY2016
1HFY2015
% chg (yoy)
Net revenue
12,514
12,371
1.2
11,684
7.1
24,751
22,820
8.5
Cost of revenue
8,229
8,142
1.1
7,779
5.8
16,371
14,990
9.2
Gross profit
4,284
4,096
4.6
3,905
9.7
8,380
7,830
7.0
SGA expense
1,556
1,490
4.4
1,423
9.3
3,045
2,798
8.8
EBITDA
2,729
2,606
4.7
2,482
9.9
5,335
5,032
6.0
Dep. and amortisation
353
337
4.7
308
14.6
690
591
16.8
EBIT
2,376
2,269
4.7
2,174
9.3
4,645
4,441
4.6
Other income
619
529
17.1
544
1,042
989
5.4
PBT
2,995
2,798
7.0
2,718
10.2
5,687
5,430
4.7
Income tax
654
595
9.9
620
5.5
1,243
1,214
2.4
PAT
2,341
2,203
6.3
2,098
11.6
4,444
4,216
5.4
Minority interest
5
16
14
21
28
Adj. PAT
2,235
2,188
2.2
2,085
7.2
4,423
4,188
5.6
Diluted EPS
9.1
8.9
2.1
8.5
7.2
18.0
17.1
5.6
Gross margin (%)
34.2
33.5
77bp
33.4
81bp
33.9
34.3
(45)bp
EBITDA margin (%)
21.8
21.3
51bp
21.2
56bp
21.6
22.1
(50)bp
EBIT margin (%)
19.0
18.5
44bp
18.6
38bp
18.8
19.5
(69)bp
PAT margin(%)
17.9
17.9
(1)bp
17.8
2bp
17.9
18.4
(48)bp
Source: Company, Angel Research
Exhibit 2: 2QFY2016 - Actual vs Angel estimates
(` cr)
Actual
Estimate
Variation (%)
Net revenue
12,514
12,703
(1.5)
EBIT margin (%)
19.0
18.7
(52)bp
PAT
2,235
2,223
0.6
Source: Company, Angel Research
Lower-than-expected results
Wipro posted a 2.1% qoq IT revenue growth to US$1,832mn V/s an expected
US$1,826mn. In CC, the company posted a 3.1% qoq revenue growth. In rupee
terms, the company posted a 1.2% qoq revenue growth to `12,514cr (V/s
`12,703cr expected). The revenue guidance for 2QFY2016 was of US$1,803-
1,839mn. Thus, the results have come at the upper end of the guidance. In rupee
terms, the revenue came in at `12,514cr V/s an expected `12,703cr and V/s
`12,371cr in 1QFY2016.
In CC terms, the company posted a 3.1% qoq revenue growth in 2QFY2016. On
CC basis, the key verticals Healthcare, Life Sciences & Services, Global Media &
Telecom, and Energy, Natural Resources & Utilities, posted a 4.2%, 4.4% and
0.3% qoq growth, respectively. Other domains like Retail, Consumer Goods &
Transportation, Manufacturing & Hitech, and Finance Solutions posted a growth of
3.5%, 3.6% and 3.1% qoq, respectively.
In terms of geographies, the USA posted a 3.6% qoq CC growth, while India &
Middle East business and APAC & Other Emerging Markets posted a 2.7% qoq
and 5.1% qoq CC growth, respectively. Europe, on a CC basis, grew by
1.4% qoq.
November 2, 2015
2
Wipro | 2QFY2016 Result Update
Exhibit 3: Trend in IT Services revenue growth (qoq)
1,850
3
2.1
1,800
2
1.8
1,750
1.3
1.1
1
1,700
0
1,650
(1)
1,600
(1.1)
1,772
1,795
1,775
1,794
1,832
1,550
(2)
2QFY15
3QFY15
4QFY15
1QFY16
2QFY16
IT services
qoq growth (%)
Source: Company, Angel Research
Industry wise, Wipro’s Global Media & Telecom vertical grew by 4.4% qoq in CC
terms. The revenue from the anchor industry vertical, Financial Solutions, grew by
3.1% qoq in CC terms. Revenue from Healthcare, Life Sciences & Services
grew by 4.2% qoq in CC terms while that from Energy, Natural Resources &
Utilities grew by 0.3% qoq in CC terms. Manufacturing and Hi-tech posted a 3.5%
qoq growth in CC terms while Retail & Transportation posted a 3.5% qoq growth
in CC terms.
Exhibit 4: Revenue growth (Industry wise - CC basis)
% to revenue
% growth (qoq)
% growth (yoy)
Global media and telecom
13.4
4.4
6.2
Financial solutions
26.7
3.1
10.8
Manufacturing and hi-tech
18.7
3.6
10.7
Healthcare, life sciences and services
11.4
4.2
8.7
Retail and transportation
15.1
3.5
16.4
Energy and utilities
14.7
0.3
(2.9)
Source: Company, Angel Research
Services wise, Wipro’s anchor service line
- Business Application Services
(contributed 46.8% to revenue) and Technology Infrastructure Services (contributed
28.0% to revenue) registered a rise in revenue of 0.7% and 1.8% qoq, respectively.
Analytics and Information Management (which contributed 7.5% of sales) grew by
3.3% qoq. Product Engineering and Mobility (which contributed 7.9% of sales)
grew by 4.9% qoq. Other services, consulting, R&D and BPO posted a qoq growth
of 13.8%, 4.1% and 7.1%, respectively.
November 2, 2015
3
Wipro | 2QFY2016 Result Update
Exhibit 5: Revenue growth (Service wise)
Service verticals
% to revenue
% growth (qoq)
% growth (yoy)
Technology infrastructure services
28.0
1.8
6.3
Analytics and information management
7.5
3.3
8.4
BPO
9.8
7.1
9.7
Product engineering and mobility
7.9
4.9
17.2
ADM
46.8
0.7
(2.0)
R&D business
10.5
4.1
11.6
Consulting
1.9
13.8
(3.4)
Source: Company, Angel Research
Geography wise, the developed economies - America and Europe, grew by 3.6%
and 1.4% qoq in CC terms, respectively. India posted a 2.7% qoq growth during
the period.
Exhibit 6: Revenue growth (Geography wise, CC basis)
% to revenue
% growth (qoq)
% growth (yoy)
America
53.0
3.6
9.1
Europe
25.2
1.4
1.1
India and Middle East
10.6
2.7
23.8
APAC and other emerging markets
11.2
5.1
10.5
Source: Company, Angel Research
The IT products segment reported a 40.6% yoy dip in revenue to `544cr, during
the quarter.
Exhibit 7: IT products - Revenue growth (yoy)
1,200
10
7.0
1,100
0
(2.4)
1,000
(10)
900
(14.9)
800
(20)
(23.8)
700
(30)
600
(40.6)
(40)
500
915
774
944
821
544
400
(50)
2QFY15
3QFY15
4QFY15
1QFY16
2QFY16
IT products
yoy growth (%)
Source: Company, Angel Research
November 2, 2015
4
Wipro | 2QFY2016 Result Update
Hiring and utilization
Wipro reported a net addition of 6,607 employees in its IT Services’ employee
base, which now stands at 168,396. Voluntary attritions (annualized) in the global
IT business increased considerably, but remained stagnant on a net basis at
16.4%. The Management indicated that it has taken necessary steps to curtail
attritions and expects them to decline going ahead. Also, the Management noted
that the company is going measured in terms of hiring due to hyper automation
process going on in the company in the run services, resulting in higher
productivity. The utilization rate of the global IT business moved down by 180bp
sequentially to 69.5%. Going ahead, an improvement in utilization level will be an
important margin lever.
Exhibit 8: Employee pyramid
Employee pyramid
2QFY15 3QFY15 4QFY15 1QFY16 2QFY16
Utilization - Global IT (%)
70.0
68.5
70.5
71.3
69.5
Attrition (%)
Global IT
16.9
16.5
16.5
16.4
16.4
BPO
12.0
13.1
13.3
12.0
10.2
Net additions
6,845
2,569
1,351
3,572
6,607
Source: Company, Angel Research
Margins dip
The company posted EBIT margins of 19.0% (V/s 18.7% expected), a qoq
expansion of 44bps. The IT Services segment posted an EBIT margin of 20.7% V/s
21.0% in 1QFY2016. The expansion in the company’s overall margins was mainly
on back of currency impact.
Exhibit 9: Segment-wise EBIT margin trend
25
22.0
21.8
22.2
21.0
20.7
20
20.0
19.3
19.0
18.6
18.5
15
10
5
1.6
1.5
0.7
0.8
0.6
0
2QFY15
3QFY15
4QFY15
1QFY16
2QFY16
IT services
IT products
Consolidated
Source: Company, Angel Research
November 2, 2015
5
Wipro | 2QFY2016 Result Update
Client pyramid
Wipro added 67 new clients in 2QFY2016, with its active client base standing at
1,100. The company’s focus on account mining continues to yield results with top
clients driving growth. Wipro continues to see good demand in the market place.
Exhibit 10: Client metrics
Particulars
2QFY15
3QFY15
4QFY15
1QFY16
2QFY16
US$100mn plus
10
10
11
10
10
US$75mn-$100mn
5
6
4
4
7
US$50mn-$75mn
15
15
16
15
14
US$20mn-$50mn
55
53
55
55
54
US$10mn-$20mn
65
69
64
59
69
US$5mn-$10mn
75
73
81
81
90
US$3mn-$5mn
67
74
80
69
77
US$1mn-$3mn
232
226
231
218
212
New client addition
50
44
65
36
67
Active customers
1,018
1,018
1,054
1071
1100
Source: Company, Angel Research
Investment Highlights
Moderate outlook: For 2QFY2016, the company has given a revenue guidance of
US$1,821-1,857mn, implying a US$ qoq growth of 0.5-2.5%. The Management
remains confident of the revenue growth pick-up sustaining, citing a pick-up in
large deal closures and win rates, uptick in discretionary spending, strong business
pipeline and sustained momentum in demand from the US. We expect USD and
INR revenue CAGR for IT services to be at 10.0% and 11.8%, respectively, over
FY2015-17E.
Deal pipeline looks robust: The company sees itself better placed than this time last
year to latch on to opportunities in the market and remains focused on improving
traction from its top 125 clients. As per the company, it is seeing a broad based
pick up in discretionary spending across verticals in the US, which should help
drive a better performance in the geography. In addition, the company remains
confident of its growth prospects with increased penetration in Europe. Wipro has
chosen a growth strategy of focusing on a selected few segments in terms of
industry verticals and services. Wipro is now better positioned than it was three
years ago to capture upsides from overall market improvement and can reduce the
gap in revenue growth with its peers.
Further, the company has bought the information technology (IT) services business
of the Canadian logistics and utilities firm, Atco, for US$195mn.The deal, which
comes less than a year since Wipro bought US-based Opus Capital Markets
Consultants Llc for US$75mn, is one of the company’s largest acquisitions in
recent years, and comes bundled with a 10-year, US$1.1bn outsourcing contract
with Atco. The outsourcing contract—one of the largest ever for Wipro—is
expected to result in annual revenue of about US$112mn.
November 2, 2015
6
Wipro | 2QFY2016 Result Update
Outlook and valuation
Wipro has been showing a decent performance in the past couple of quarters by
rationalizing costs. We have factored in a FY2015-17E EBIT margin at 19.9%
considering that most headwinds are already behind for Wipro and hence believe
that this can be achieved if the company improves its operational efficiency. The
stock is currently trading at 14.9x FY2016E and 13.6x FY2017E EPS, ie at a
discount to its peers. We recommend a Buy on the stock with a target price of
`719.
Exhibit 11: Key assumptions
FY2016E
FY2017E
Revenue growth - IT services (USD)
8.0
12.0
USD-INR rate (realized)
62.5
62.5
Revenue growth - Consolidated (`)
11.6
12.0
EBITDA margin (%)
23.7
23.8
Tax rate (%)
22.0
22.0
EPS growth (%)
9.6
10.2
Source: Company, Angel Research
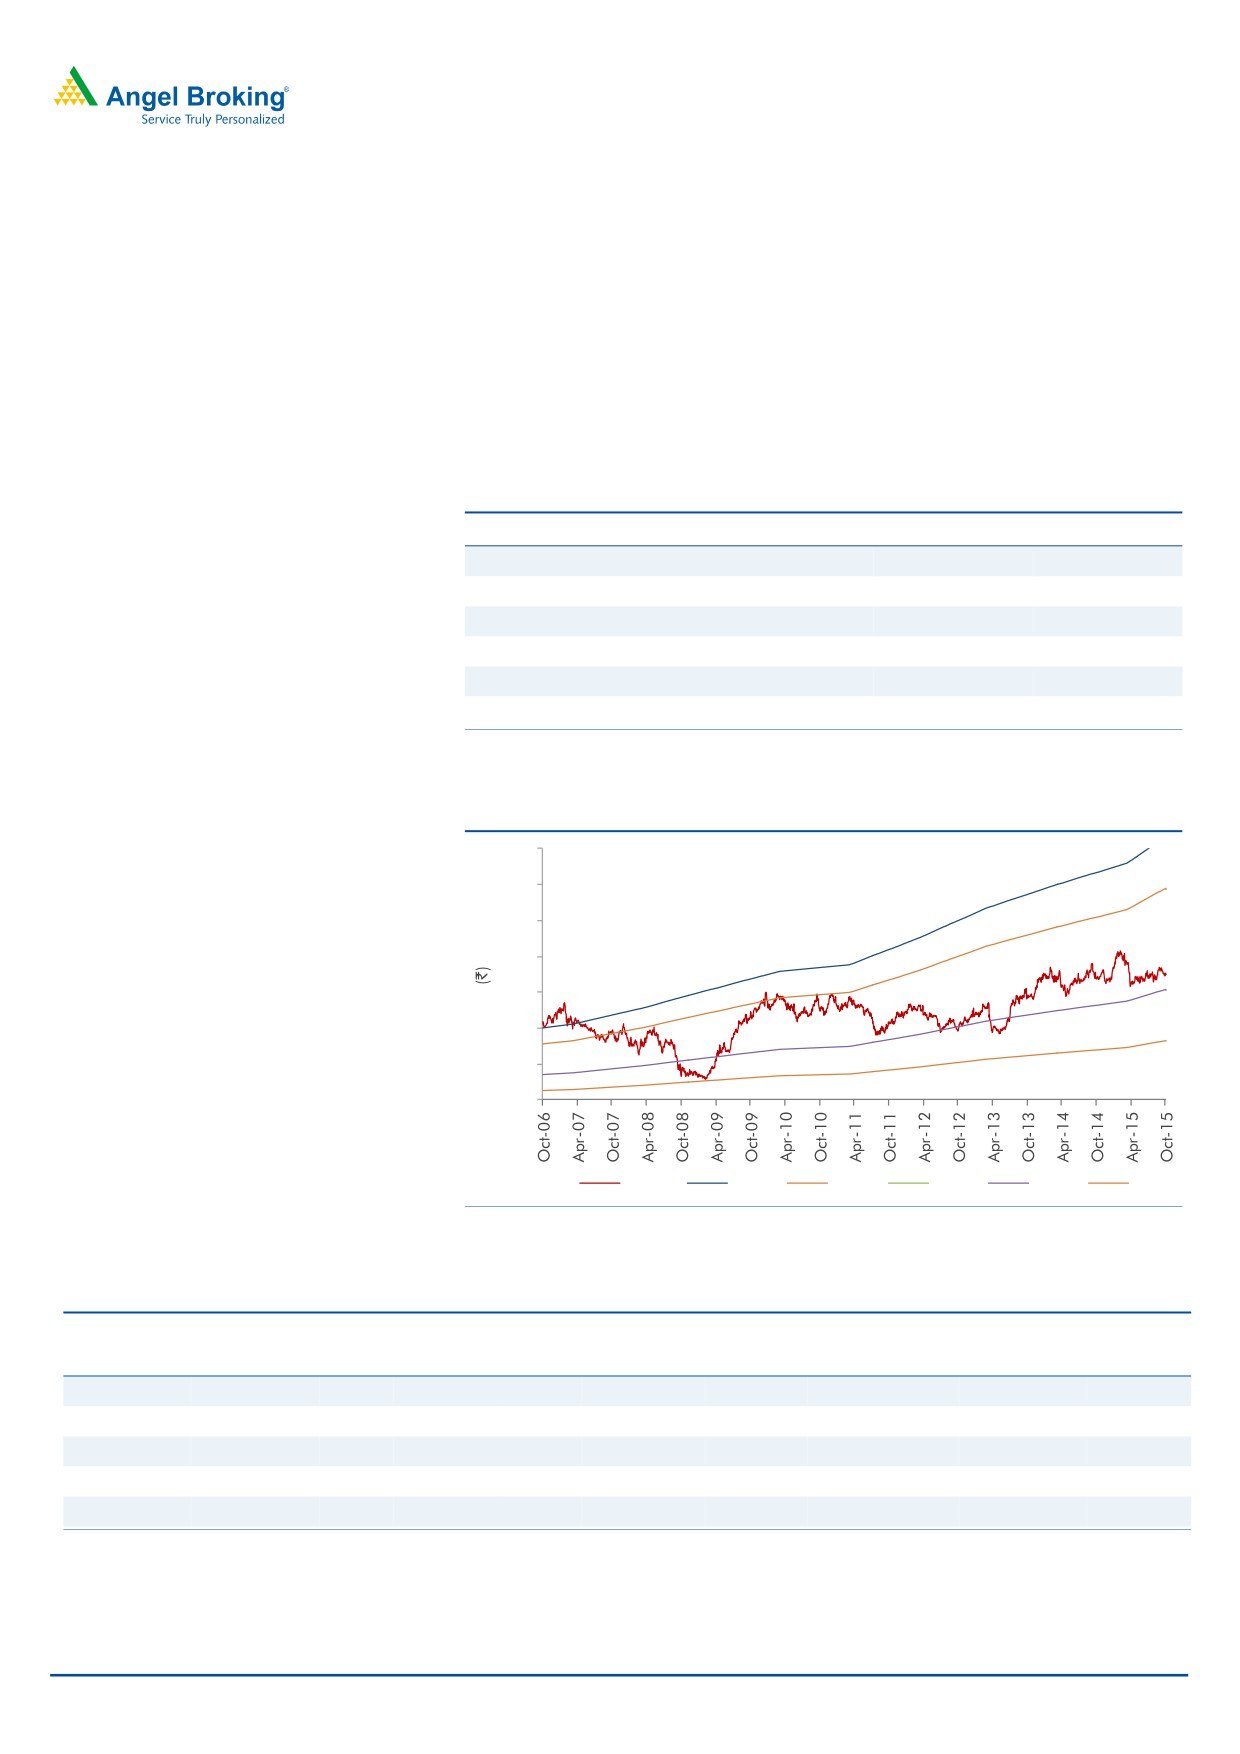
Exhibit 12: One-year forward PE chart
1,100
950
800
650
500
350
200
50
Price
27x
22x
17x
12x
7x
Source: Company, Angel Research
Exhibit 13: Recommendation summary
Company
Reco
CMP Tgt. price Upside
FY2017E FY2017E
FY2015-17E
FY2017E FY2017E
(`)
(`)
(%)
EBITDA (%)
P/E (x)
EPS CAGR (%)
EV/Sales (x)
RoE (%)
HCL Tech
Buy
870
1,132
30.2
23.5
13.8
10.6
2.0
19.8
Infosys
Buy
1,136
1,306
15.0
28.0
19.5
8.9
3.1
19.7
TCS
Buy
2,497
3,165
26.7
28.7
19.9
13.9
3.5
42.2
Tech Mahindra Buy
539
646
19.9
17.0
20.5
8.0
1.5
18.6
Wipro
Buy
573
719
25.4
23.8
13.6
9.7
1.9
18.0
Source: Company, Angel Research
November 2, 2015
7
Wipro | 2QFY2016 Result Update
Company background
Wipro is among the leading Indian companies, majorly offering IT services. The
company is also engaged in the IT hardware (10% of sales) business. Wipro's IT
arm is India's fourth largest IT firm, employing more than 1,68,000 professionals,
offering a wide portfolio of services such as ADM, consulting and package
implementation, and servicing more than 1,000 clients.
November 2, 2015
8
Wipro | 2QFY2016 Result Update
Profit & Loss account (Consolidated, IFRS)
Y/E March (` cr)
FY2013 FY2014 FY2015 FY2016E FY2017E
Net revenue
37,426
43,427
46,955
52,414
58,704
Cost of revenues
26,067
29,549
30,846
35,642
39,919
Gross profit
11,359
13,878
16,108
16,773
18,785
% of net sales
30.4
32.0
34.3
32.0
32.0
Selling and mktg exp.
2,421
2,925
3,063
3,512
3,933
% of net sales
6.5
6.7
6.5
6.7
6.7
General and admin exp.
2,203
2,354
2,585
2,830
3,170
% of net sales
5.9
5.4
5.5
5.4
5.4
Depreciation and amortization
1,084
1,111
1,282
1,363
1,526
% of net sales
2.9
2.6
2.7
2.6
2.6
EBIT
6,735
8,600
9,179
10,430
11,682
% of net sales
18.0
19.8
19.5
19.9
19.9
Other income, net
1,626
1,501
1,990
1,808
1,808
Share in profits of eq. acc. ass.
0
0
0
0
0
Profit before tax
8,360
10,101
11,168
12,238
13,490
Provision for tax
1,691
2,260
2,462
2,692
2,968
% of PBT
20.2
22.4
22.0
22.0
22.0
PAT
6,669
7,840
8,706
9,546
10,522
Share in earnings of associate
-
-
-
-
-
Minority interest
34
44
53
63
73
Adj. PAT
6,636
7,797
8,653
9,483
10,449
Diluted EPS (`)
26.8
31.5
35.1
38.4
42.3
November 2, 2015
9
Wipro | 2QFY2016 Result Update
Balance sheet (Consolidated, IFRS)
Y/E March (` cr)
FY2013
FY2014
FY2015
FY2016E
FY2017E
Assets
Goodwill
5,476
6,342
6,808
6,877
6,234
Intangible assets
171
194
793
793
793
Property, plant & equipment
5,053
5,145
5,421
5,721
6,021
Investment in equ. acc. investees
-
268
387
387
387
Derivative assets
5
29
74
74
74
Non-current tax assets
1,031
1,019
1,141
1,141
1,141
Deferred tax assets
424
336
295
295
295
Other non-current assets
1,074
1,430
1,437
1,430
1,430
Total non-current assets
13,233
14,762
16,354
16,716
16,373
Inventories
326
229
485
480
480
Trade receivables
7,664
8,539
9,153
10,216
11,441
Other current assets
3,107
3,947
7,336
7,336
7,336
Unbilled revenues
3,199
3,933
4,234
4,234
4,234
Available for sale investments
6,917
6,056
5,391
5,391
5,391
Current tax assets
741
977
649
900
900
Derivative assets
303
366
508
508
508
Cash and cash equivalents
8,484
11,420
15,894
23,237
32,948
Total current assets
30,740
35,469
43,649
52,300
63,237
Total assets
43,973
50,230
60,003
69,017
79,610
Equity
Share capital
493
493
493
493
493
Share premium
1,176
1,266
1,403
1,403
1,403
Retained earnings
25,918
31,495
37,225
44,946
54,378
Share based payment reserve
132
102
131
102
102
Other components of equity
717
1,047
1,545
1,545
1,545
Shares held by controlled trust
(54)
(54)
-
-
-
Equity attrib. to shareholders of Co.
28,381
34,350
40,789
48,489
57,921
Minority interest
117
139
165
165
165
Total equity
28,498
34,489
40,954
48,654
58,086
Liabilities
Long term loans and borrowings
85
1,091
1,271
1,271
1,271
Deferred tax liability
85
180
324
324
324
Derivative liabilities
12
63
16
16
16
Non-current tax liability
479
345
670
670
670
Other non-current liabilities
339
417
366
366
366
Provisions
1
1
1
1
1
Total non-current liabilities
1001
2096
2647
2647
2647
Loans and bank overdraft
6,296
4,068
6,621
6,621
6,621
Trade payables
4,807
5,226
5,875
6,914
7,744
Unearned revenues
1,035
1,277
1,655
1,655
1,877
Current tax liabilities
1,023
1,248
804
1,077
1,187
Derivative liabilities
98
250
75
75
75
Other current liabilities
1,099
1,439
1,222
1,222
1,222
Provisions
117
137
152
152
152
Total current liabilities
14,474
13,646
16,403
17,716
18,878
Total liabilities
15,475
15,742
19,050
20,363
21,525
Total equity and liabilities
43,973
50,230
60,003
69,017
79,610
November 2, 2015
10
Wipro | 2QFY2016 Result Update
Cash flow statement (Consolidated, IFRS)
Y/E March (` cr)
FY2013
FY2014
FY2015
FY2016E
FY2017E
Pre tax profit from operations
6,974
8,935
11,168
12,238
13,490
Depreciation
1,237
1,111
1,282
1,363
1,526
Expenses (deferred)/written off
(10)
(13)
(13)
(13)
(13)
Pre tax cash from operations
8,201
10,033
12,438
13,588
15,004
Other income/prior period ad
1,001
1,165
1,990
1,808
1,808
Net cash from operations
9,202
11,198
14,428
15,396
16,812
Tax
(1,835)
(2,260)
(2,462)
(2,692)
(2,968)
Cash profits
7,367
8,938
11,965
12,704
13,844
(Inc)/dec in current assets
47
(2,653)
(8,181)
(8,651)
(10,937)
Inc/(dec) in current liab.
2,706
(828)
2,757
1,313
1,162
Net trade working capital
2,752
(3,482)
(5,423)
(7,338)
(9,775)
Cashflow from oper. actv.
10,119
5,456
6,542
5,366
4,069
(Inc)/dec in fixed assets
(391)
(1,203)
(276)
(300)
(300)
(Inc)/dec in intangibles
1,570
(889)
(600)
-
-
(Inc)/dec in investments
(2,398)
594
(119)
-
-
(Inc)/dec in net def. tax assets
(164)
87
-
-
-
(Inc)/dec in derivative assets
341
(24)
-
-
-
(Inc)/dec in non-current tax asset
(2)
12
7
(7)
-
(Inc)/dec in minority interest
32
22
9
10
10
Inc/(dec) in other non-current liab
(49)
90
273
-
-
(Inc)/dec in other non-current ast.
104
(122)
(122)
-
-
Cashflow from investing activities
(957)
(1,667)
(826)
(297)
(290)
Inc/(dec) in debt
(2,166)
1,006
180
-
-
Inc/(dec) in equity/premium
(4,544)
(123)
314
4,036
6,949
Dividends
(1,736)
(1,736)
(1,736)
(1,762)
(1,017)
Cashflow from financing activities
(8,446)
(853)
(1,242)
2,274
5,932
Cash generated/(utilized)
717
2,936
4,474
7,343
9,711
Cash at start of the year
7,767
8,484
11,420
15,894
23,237
Cash at end of the year
8,484
11,420
15,894
23,237
32,948
November 2, 2015
11
Wipro | 2QFY2016 Result Update
Key Ratios
Y/E March
FY2013
FY2014
FY2015
FY2016E
FY2017E
Valuation ratio(x)
P/E (on FDEPS)
21.4
18.2
16.3
14.9
13.6
P/CEPS
10.6
8.6
7.9
7.1
6.4
P/BVPS
5.0
4.1
3.5
2.9
2.6
Dividend yield (%)
1.0
1.0
1.0
1.1
0.6
EV/Sales
3.4
2.9
2.6
2.2
1.8
EV/EBITDA
16.1
12.9
11.6
9.7
7.9
EV/Total assets
2.9
2.5
2.0
1.7
1.3
Per share data (`)
EPS (Fully diluted)
26.8
31.5
35.1
38.4
42.3
Cash EPS
54.1
66.3
72.1
80.5
89.5
Dividend
6.0
6.0
6.0
6.1
3.5
Book value
115.3
139.5
165.7
196.8
220.0
DuPont analysis
Tax retention ratio (PAT/PBT)
0.8
0.8
0.8
0.8
0.8
Cost of debt (PBT/EBIT)
7.7
9.1
8.7
9.0
8.8
EBIT margin (EBIT/Sales)
0.0
0.0
0.0
0.0
0.0
Asset turnover ratio (Sales/Assets)
0.9
0.9
0.8
0.8
0.7
Leverage ratio (Assets/Equity)
1.5
1.5
1.5
1.4
1.4
Operating ROE
23.5
22.8
21.3
19.7
18.2
Return ratios (%)
RoCE (pre-tax)
15.3
17.1
15.3
15.1
14.7
Angel RoIC
29.2
32.6
28.8
31.1
33.3
RoE
23.3
22.6
21.1
19.5
18.0
Turnover ratios (x)
Asset turnover(fixed assets)
0.9
0.9
0.9
0.8
0.8
Receivables days
77
68
69
69
70
Payable days
67
67
67
67
67
November 2, 2015
12
Wipro | 2QFY2016 Result Update
Research Team Tel: 022 - 39357800
DISCLAIMER
Angel Broking Private Limited (hereinafter referred to as “Angel”) is a registered Member of National Stock Exchange of India Limited,
Bombay Stock Exchange Limited and MCX Stock Exchange Limited. It is also registered as a Depository Participant with CDSL and
Portfolio Manager with SEBI. It also has registration with AMFI as a Mutual Fund Distributor. Angel Broking Private Limited is a
registered entity with SEBI for Research Analyst in terms of SEBI (Research Analyst) Regulations, 2014 vide registration number
INH000000164. Angel or its associates has not been debarred/ suspended by SEBI or any other regulatory authority for accessing
/dealing in securities Market. Angel or its associates including its relatives/analyst do not hold any financial interest/beneficial
ownership of more than 1% in the company covered by Analyst. Angel or its associates/analyst has not received any compensation /
managed or co-managed public offering of securities of the company covered by Analyst during the past twelve months. Angel/analyst
has not served as an officer, director or employee of company covered by Analyst and has not been engaged in market making activity
of the company covered by Analyst.
This document is solely for the personal information of the recipient, and must not be singularly used as the basis of any investment
decision. Nothing in this document should be construed as investment or financial advice. Each recipient of this document should
make such investigations as they deem necessary to arrive at an independent evaluation of an investment in the securities of the
companies referred to in this document (including the merits and risks involved), and should consult their own advisors to determine
the merits and risks of such an investment.
Reports based on technical and derivative analysis center on studying charts of a stock's price movement, outstanding positions and
trading volume, as opposed to focusing on a company's fundamentals and, as such, may not match with a report on a company's
fundamentals.
The information in this document has been printed on the basis of publicly available information, internal data and other reliable
sources believed to be true, but we do not represent that it is accurate or complete and it should not be relied on as such, as this
document is for general guidance only. Angel Broking Pvt. Limited or any of its affiliates/ group companies shall not be in any way
responsible for any loss or damage that may arise to any person from any inadvertent error in the information contained in this report.
Angel Broking Pvt. Limited has not independently verified all the information contained within this document. Accordingly, we cannot
testify, nor make any representation or warranty, express or implied, to the accuracy, contents or data contained within this document.
While Angel Broking Pvt. Limited endeavors to update on a reasonable basis the information discussed in this material, there may be
regulatory, compliance, or other reasons that prevent us from doing so.
This document is being supplied to you solely for your information, and its contents, information or data may not be reproduced,
redistributed or passed on, directly or indirectly.
Neither Angel Broking Pvt. Limited, nor its directors, employees or affiliates shall be liable for any loss or damage that may arise from
or in connection with the use of this information.
Note: Please refer to the important ‘Stock Holding Disclosure' report on the Angel website (Research Section). Also, please refer to the
latest update on respective stocks for the disclosure status in respect of those stocks. Angel Broking Pvt. Limited and its affiliates may
have investment positions in the stocks recommended in this report.
Disclosure of Interest Statement
Wipro
1. Analyst ownership of the stock
No
2. Angel and its Group companies ownership of the stock
No
3. Angel and its Group companies' Directors ownership of the stock
No
4. Broking relationship with company covered
No
Note: We have not considered any Exposure below ` 1 lakh for Angel, its Group companies and Directors
Ratings (Based on expected returns
Buy (> 15%)
Accumulate (5% to 15%)
Neutral (-5 to 5%)
over 12 months investment period):
Reduce (-5% to -15%)
Sell (< -15)
November 2, 2015
13