4QFY2016 Result Update | Cement Products
May 21, 2016
Visaka Industries
BUY
CMP
`135
Performance Highlights
Target Price
`162
Investment Period
12 Months
Y/E March (` cr)
4QFY16 4QFY15
% chg (yoy) 3QFY16
% chg (qoq)
Net sales
276
285
(3.3)
215
28.0
Stock Info
EBITDA
29
27
6.6
16
73.8
Sector
Cement Products
EBITDA Margin (%)
10.4
9.4
96bp
7.7
274bp
Market Cap (` cr)
215
Adjusted PAT
10
6
58.6
1
767.2
Source: Company, Angel Research
Net Debt
262
Beta
1.5
Visaka Industries posted a good set of numbers for 4QFY2016. Although the top-line
52 Week High / Low
189 / 89
declined, the performance on the operating and bottom-line fronts was favorable.
The top-line declined by 3.3% yoy to `276cr. On the operating front the EBITDA grew
Avg. Daily Volume
18,326
by 6.6% yoy to `29cr and the EBITDA margin improved by 96bp yoy to 10.4%. There
Face Value (`)
10
was an exceptional expense related to diminution in value of investment during the
BSE Sensex
25,302
quarter amounting to `1cr, adjusting for which, other expenses declined by 192bp
Nifty
7,750
yoy to 24.6% of sales. Raw material and employee expenses remained flat as a
Reuters Code
VSKI.BO
proportion of sales, thus resulting in EBITDA margin expansion. Aided by lower
Bloomberg Code
VSKI.IN
interest and depreciation, the adjusted net profit grew by 58.6% yoy to `10cr.
Overall long term prospects intact: The company’s performance in FY2016 was
Shareholding Pattern (%)
impacted on account of drop in volumes and realizations for its main business, ie
Promoters
37.5
Asbestos Cement Sheets (ACS). However, the company is aiming at growing its
MF / Banks / Indian Fls
0.5
Boards and Synthethic yarn business in order to lower its dependence on the ACS
FII / NRIs / OCBs
3.3
business. While the long term prospects of ACS are intact the outlook for the Boards
and Synthetic yarn business also looks favorable which should drive growth for the
Indian Public / Others
58.7
company going forward. The Yarn business has better margins while the Boards
business has shown significant improvement in profitability which should only improve
Abs.(%)
3m 1yr
3yr
once the business scales up.
Sensex
7.1
(8.1)
25.6
Outlook and Valuations: We have introduced our FY2018E estimates for the
Visaka
42.0
14.6
28.3
company and have lowered our expectation for FY2017E on account of near term
dampness in the ACS division. At the current market price of `135, the stock is trading
3 Year Price Chart
200
at a valuation of 5.9x its FY2018E EPS, which is attractive. We continue to maintain
180
our Buy rating on the stock with a revised price target of `162, valuing the stock at
160
7.0x its FY2018E earnings.
140
120
100
Key financials
80
Y/E March (` cr)
FY2014
FY2015
FY2016
FY2017E
FY2018E
60
40
Net sales
892
1,021
1,005
1,051
1,138
20
% chg
(2.6)
14.5
(1.6)
4.6
8.3
-
Adj. net profit
12
21
28
33
37
% chg
(76.3)
76.6
29.8
21.0
10.2
EBITDA Margin (%)
6.4
9.4
9.9
10.3
10.4
Source: Company, Angel Research
EPS (`)
7.5
13.4
17.4
21.0
23.1
P/E (x)
17.9
10.1
7.8
6.4
5.9
P/BV (x)
0.6
0.6
0.6
0.6
0.5
RoE (%)
3.6
6.4
7.9
9.0
9.2
RoCE (%)
5.3
7.7
8.8
8.7
8.6
Milan Desai
EV/Sales (x)
0.5
0.5
0.4
0.5
0.4
+91 22 4000 3600 Ext: 6846
EV/EBITDA (x)
7.7
5.0
4.5
4.5
4.2
Source: Company, Angel Research; Note: CMP as of May 20, 2016
Please refer to important disclosures at the end of this report
1
Visaka Industries | 4QFY2016 Result Update
Exhibit 1: 2QFY2016 performance
Y/E March (` cr)
4QFY16
4QFY15
% chg (yoy)
3QFY16
% chg (qoq)
FY2016
FY2015
% chg (yoy)
Total operating income
276
285
(3.3)
215
28.0
1,005
1,021
(1.6)
Net raw material
162
167
(3.2)
124
30.5
572
578
(1.0)
(% of Sales)
58.8
58.7
4bp
57.7
110bp
56.9
56.6
33bp
Employee cost
17
15
13.4
17
3.7
68
59
14.5
(% of Sales)
6.3
5.4
93bp
7.8
(147)bp
6.8
5.8
95bp
Other Expenses
68
75
(10.3)
58
16.8
266
288
(7.9)
(% of Sales)
24.6
26.5
(192)bp
26.9
(237)bp
26.4
28.2
(181)bp
Total expenditure
247
258
(4.3)
199
24.2
905
925
(2.2)
EBITDA
29
27
6.6
16
73.8
100
96
4.0
EBITDA Margin (%)
10.4
9.4
96bp
7.7
274bp
9.9
9.4
53bp
Interest
5
7
(26.6)
6
(8.2)
21
22
(3.3)
Depreciation
8
10
(12.6)
9
(7.4)
36
43
(15.7)
Other income
0
0
108.0
0
(5.1)
3
2
12.7
Extraordinary Exp./(Inc.)
1
-
-
5
-
PBT
15
10
(7.8)
2
(23.4)
40
33
9.6
(% of Sales)
5.3
3.7
1.0
4.6
4.3
Tax
5.6
4.3
28.5
1.1
398.2
16
12
33.1
(% of PBT)
38.4
41.7
50.2
39.5
36.0
Reported PAT
9
6
47.1
1
704.1
24
21
15.0
Exceptional items
1
-
-
3.15
-
Adjusted PAT
10
6
58.6
1
767.2
28
21
29.8
PATM (%)
3.5
2.1
0.5
2.7
2.1
Source: Company, Angel Research
Exhibit 2: Actual vs. Estimate
Actual v/s Angel's Estimates
Actual (` cr)
Estimate (` cr)
% variation
Total Income (` cr)
276
291
(5.3)
EBITDA (` cr)
29
21
36.0
EBITDA Margin (%)
10.4
7.2
316bp
Adjusted PAT (` cr)
10
7
46.0
Source: Company, Angel Research
Top-line disappoints, margin and bottom-line impress
The top-line during the quarter witnessed a de-growth of 3.3% yoy to `276cr which
is below our estimate of `291cr. This was on account of decline in volumes and
realizations for the ACS division and lower realizations for the Synthetic Yarn
segment. On the operational front, raw material and employee expense both as a
percentage of sales remained flat while other expenses, adjusting for provision for
diminution in value of `1cr (`4.5cr for FY2016), declined by 192bp yoy to 24.6%
of sales. Aided by lower other expense, the EBITDA grew by 6.6% yoy to `29cr and
the EBITDA margin expanded by 96bp yoy to 10.4%. The deviation in the EBITDA
margin from our estimates is on account of we having estimated for higher other
expenses. Interest expense declined by 26.6% yoy to `5cr while depreciation
declined by 12.6% yoy to `8cr. Consequently, the adjusted net profit grew by
58.6% yoy to `10cr.
May 21, 2016
2
Visaka Industries | 4QFY2016 Result Update
Segmental performance
Building products: The sgements’ top-line for the quarter witnessed a 3.3% yoy
decline to `229.3cr on account of decline in volumes as well as realizations for the
ACS division. However, the V-boards division’s revenue improved by ~23% yoy,
thus arresting any sharp decline in overall revenues. Aided by improvement in
profitability, the Boards division’s building products EBIT grew by 14.0% yoy to
`18.6cr. As per the management, the boards division’s EBIDTA margin improved
to 7.9% (in 4QFY2016) after having posted -2.5% margin in 4QFY2015.
Synthetic Yarn: The segment’s top-line remained flat at `44.6cr while the margins
reported a 32bp yoy improvement to 13.5%.
Exhibit 3: Segment-wise performance
Y/E Mar (` cr)
4QFY16
4QFY15
% chg (yoy) 3QFY16
% chg (qoq)
Total Revenue
A) Building Products
229.3
237.2
(3.3)
167.4
37.0
B) Synthetic Yarn
44.6
44.6
(0.0)
40.9
8.9
Total
273.9
46.0
496.0
208.3
31.5
EBIT
A) Building Products
18.6
16.3
14.0
6.6
181.3
B) Synthetic Yarn
6.0
5.9
2.4
5.5
9.9
Total
24.6
191.2
(87.1)
12.1
103.7
EBIT Margin (%)
A) Building Products
8.1
6.9
123bp
3.9
415bp
B) Synthetic Yarn
13.5
13.2
32bp
13.3
12bp
Source: Company, Angel Research
Concall highlights
The ACS division witnessed a volume decline of ~3.0% for FY2016 while the
realizations were down by ~2.5%. The division has been impacted by poor
rural economy and cannibalization by Chinese steel roofing (color coated)
sheets. The Management is optimistic that the division will see improvement on
the back of increased rural allocation by the government and expectation of a
better monsoon this year which should slowly bring back demand for ACS.
The company sold 7.0 lakh tons in FY2016 against 7.2 lakh tons in FY2015
and produced 6.9 lakh tons in FY2016 against 7.7 lakh tons in FY2015, thus
resulting in a decline in inventory levels.
The Boards division has been witnessing good traction and the company has
been aggressive in promotion of products. The company has spent ~`3.5-4cr
on advertisement which will likely be ~`8cr for FY2017. The division’s
production stood at ~91,000 tons for FY2016 which can reach peak capacity
of 1,20,000 tons. The company expects the division to be a significant
contributor to revenues in the future.
The Synthetic yarn segment was impacted on account of lower realizations in
FY2016. The company expects margins to improve in FY2017 on account of
inventory gains and pickup in demand on account of reversal of in the
realization cycle. The company has lined up a capex of ~`70cr which will get
operational by September 2016. Of this, `60cr will be funded via debt which
May 21, 2016
3
Visaka Industries | 4QFY2016 Result Update
will entail interest rebate from the Government of Maharashtra. This will likely
benefit the company as the debt servicing cost will come down to ~6%. The
capacity of the division post expansion will increase by 26%.
Overall, the company is expected to benefit from lower chrysotile asbestos
fiber prices in FY2016 and we expect the currency to remain stable which will
likely keep a check on raw material prices. The company has been prudent
with managing expenses and the Management has stated at the same
continuing and the trend being sustainable.
Investment arguments
Boards business to drive growth for Building Products segment
The company’s ACS business which used to account for ~80% of the revenue in
the past has seen its contribution decline to ~65% in FY2016. This has been on
account of poor rural sentiment which has impacted volumes as well as
realizations in FY2016. Also, this could also be attributable to improvement in the
contribution of the Boards business as the company has been aggressive in
promoting its V-next (boards) products and expects good growth in the division
which will also witness improvement in margins with scale.
Synthetic yarn business to witness improvement with increase in
realizations
The company’s Synthetic yarn business, which although is a commoditized
business, uses superior technology (Japanese twin jet machines) to produce high
quality yarn. The yarn is supplied to key clients like Raymond, Siyaram Silk Mills,
Pantaloons, etc which require superior quality yarn for their fabrics and hence the
product entails better margin for the company in comparison to other yarn
manufacturers. The business’ contribution to overall revenue in FY2016 has
declined owing to falling realizations which however should turnaround once poly
staple fibre and oil prices stabilize and rebound. Overall, the outlook for the
business looks stable in the near term owing to improvement in domestic demand
for the Indian textile sector although exports have been hindered due to a poor
global demand scenario. This should support volumes for the company till we
witness a revival in global demand.
May 21, 2016
4
Visaka Industries | 4QFY2016 Result Update
Financials
On account of bleak near term outlook for the ACS division, we have estimated a
revenue CAGR of ~4.0% for the division over FY2016E-FY2018E. We have built in
a revenue CAGR of 12.8% for the Boards division in our estimates led by
volume/realization CAGR of ~8%/5% over FY2016E-18E. We expect the Synthetic
yarn business’ volumes/realization to post a CAGR of ~8%/4% over FY2016E-
18E, resulting in revenue CAGR of 12.5%. As a result, the overall revenue is
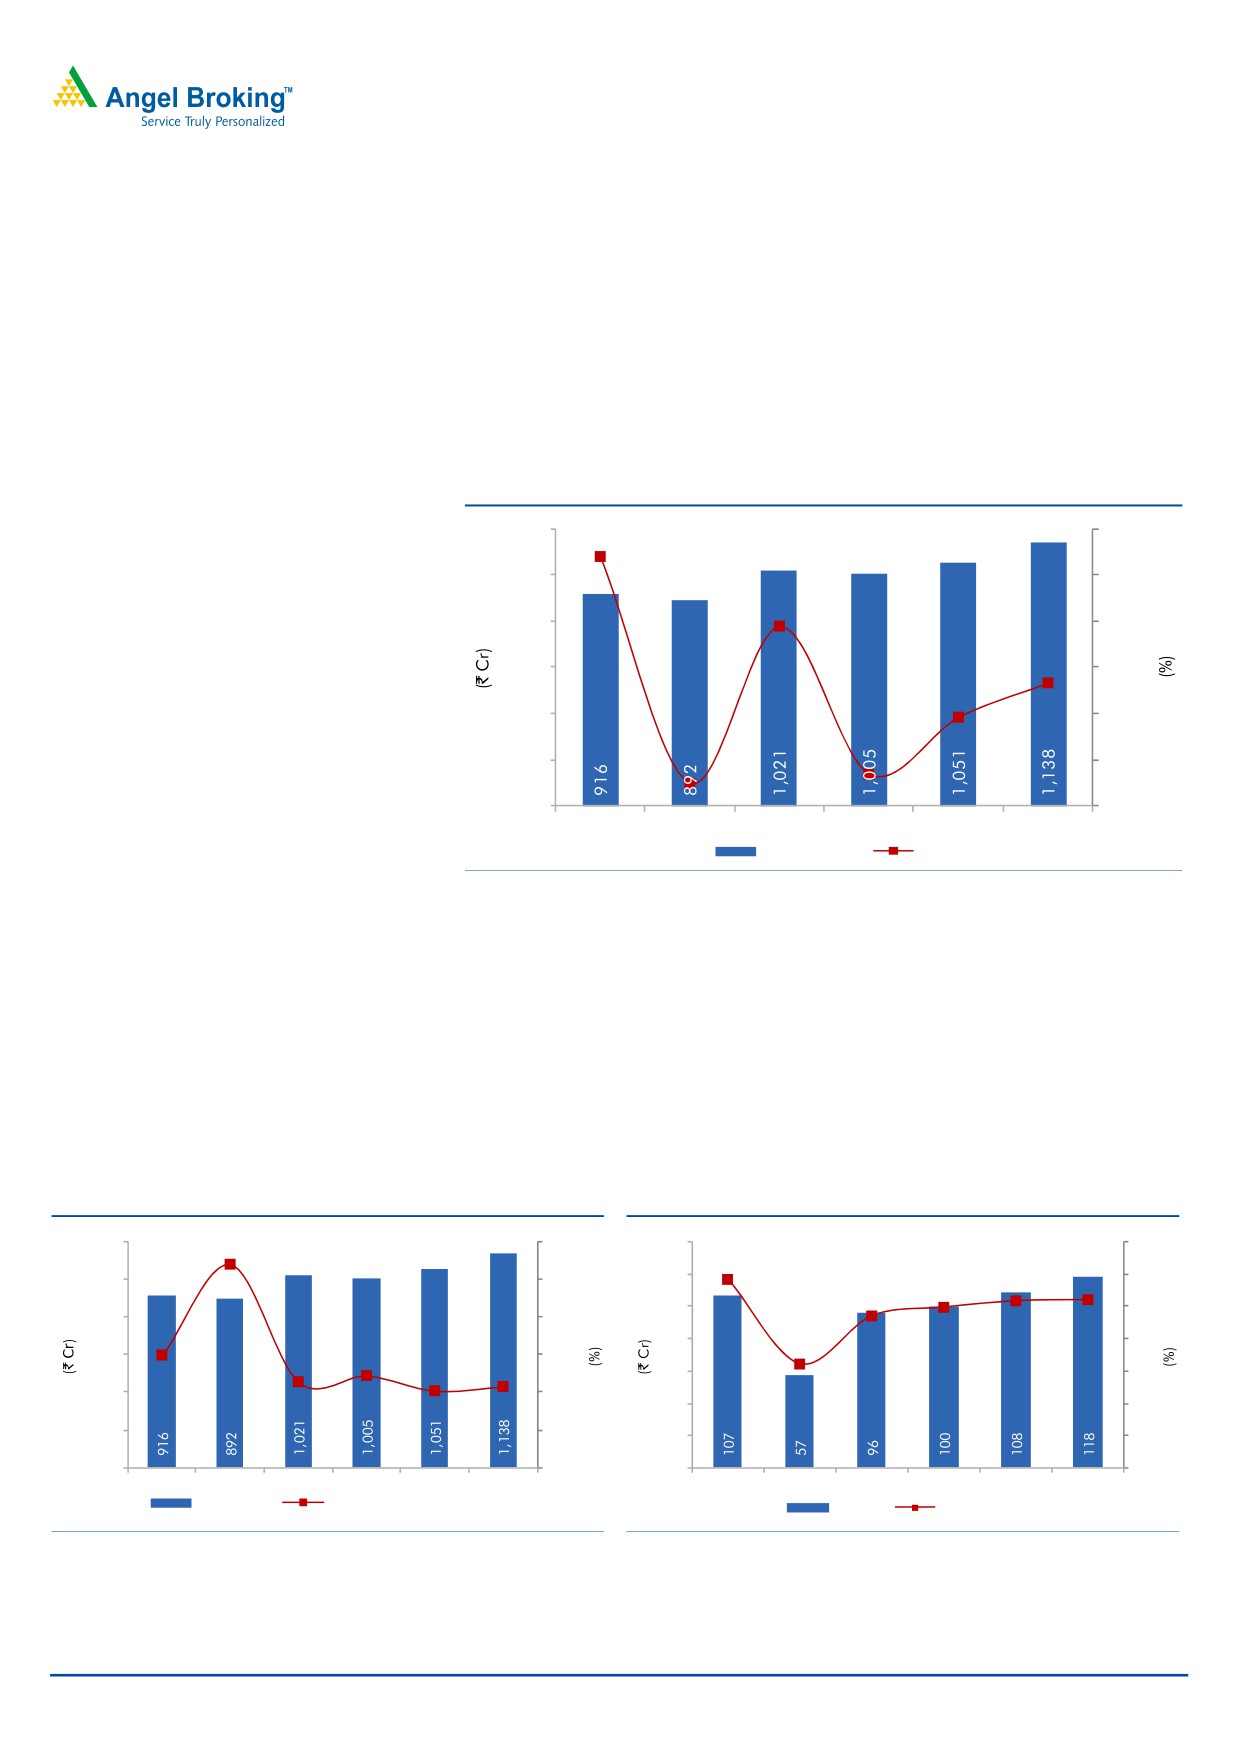
expected to post a CAGR of 6.4% over FY2016-18E to `1,138cr.
Exhibit 4: Sales to post a CAGR of 6.4% over FY2016-18E
1,200
25.0
22.0
1,000
20.0
800
15.0
14.5
600
10.0
8.3
400
5.0
4.6
200
-
-1.6
(2.6)
-
(5.0)
FY2013
FY2014
FY2015
FY2016
FY2017E FY2018E
Net Sales
Sales yoy growth
Source: Company, Angel Research
EBIDTA margin to trend upwards
With chrysotile fibre prices are expected to remain soft and with the currency
expected to remain stable, we expect the raw material cost to come down in
FY2017E and increase from thereon. The company has undertaken steps to curb
its expense which has resulted in savings in the past year and we expect the cost to
sustain at the same levels in term of percentage of sales. As a result, the EBIDTA
margin will improve from 9.9% in FY2016 to 10.4% in FY2017E.
Exhibit 5: Raw material costs remain stable
Exhibit 6: EBITDA margin to improve to 10.2%
1,200
64.0
140
14.0
11.6
62.8
10.4
1,000
62.0
120
10.3
12.0
9.9
9.4
100
10.0
800
60.0
80
6.4
8.0
600
58.0
58.0
56.6
56.9
60
6.0
56.1
56
.3
400
56.0
40
4.0
200
54.0
20
2.0
-
52.0
-
-
FY2013
FY2014
FY2015
FY2016
FY2017E FY2018E
FY2013
FY2014
FY2015
FY2016
FY2017E FY2018E
Net Sales
Raw material as % of net sales
EBIDTA
EBIDTA margins
Source: Company, Angel Research
Source: Company, Angel Research
On account of extended capacities being operationalized in FY2017E (Synthetic
Yarn) and FY2018E (Boards), the depreciation expense is estimated to increase
May 21, 2016
5
Visaka Industries | 4QFY2016 Result Update
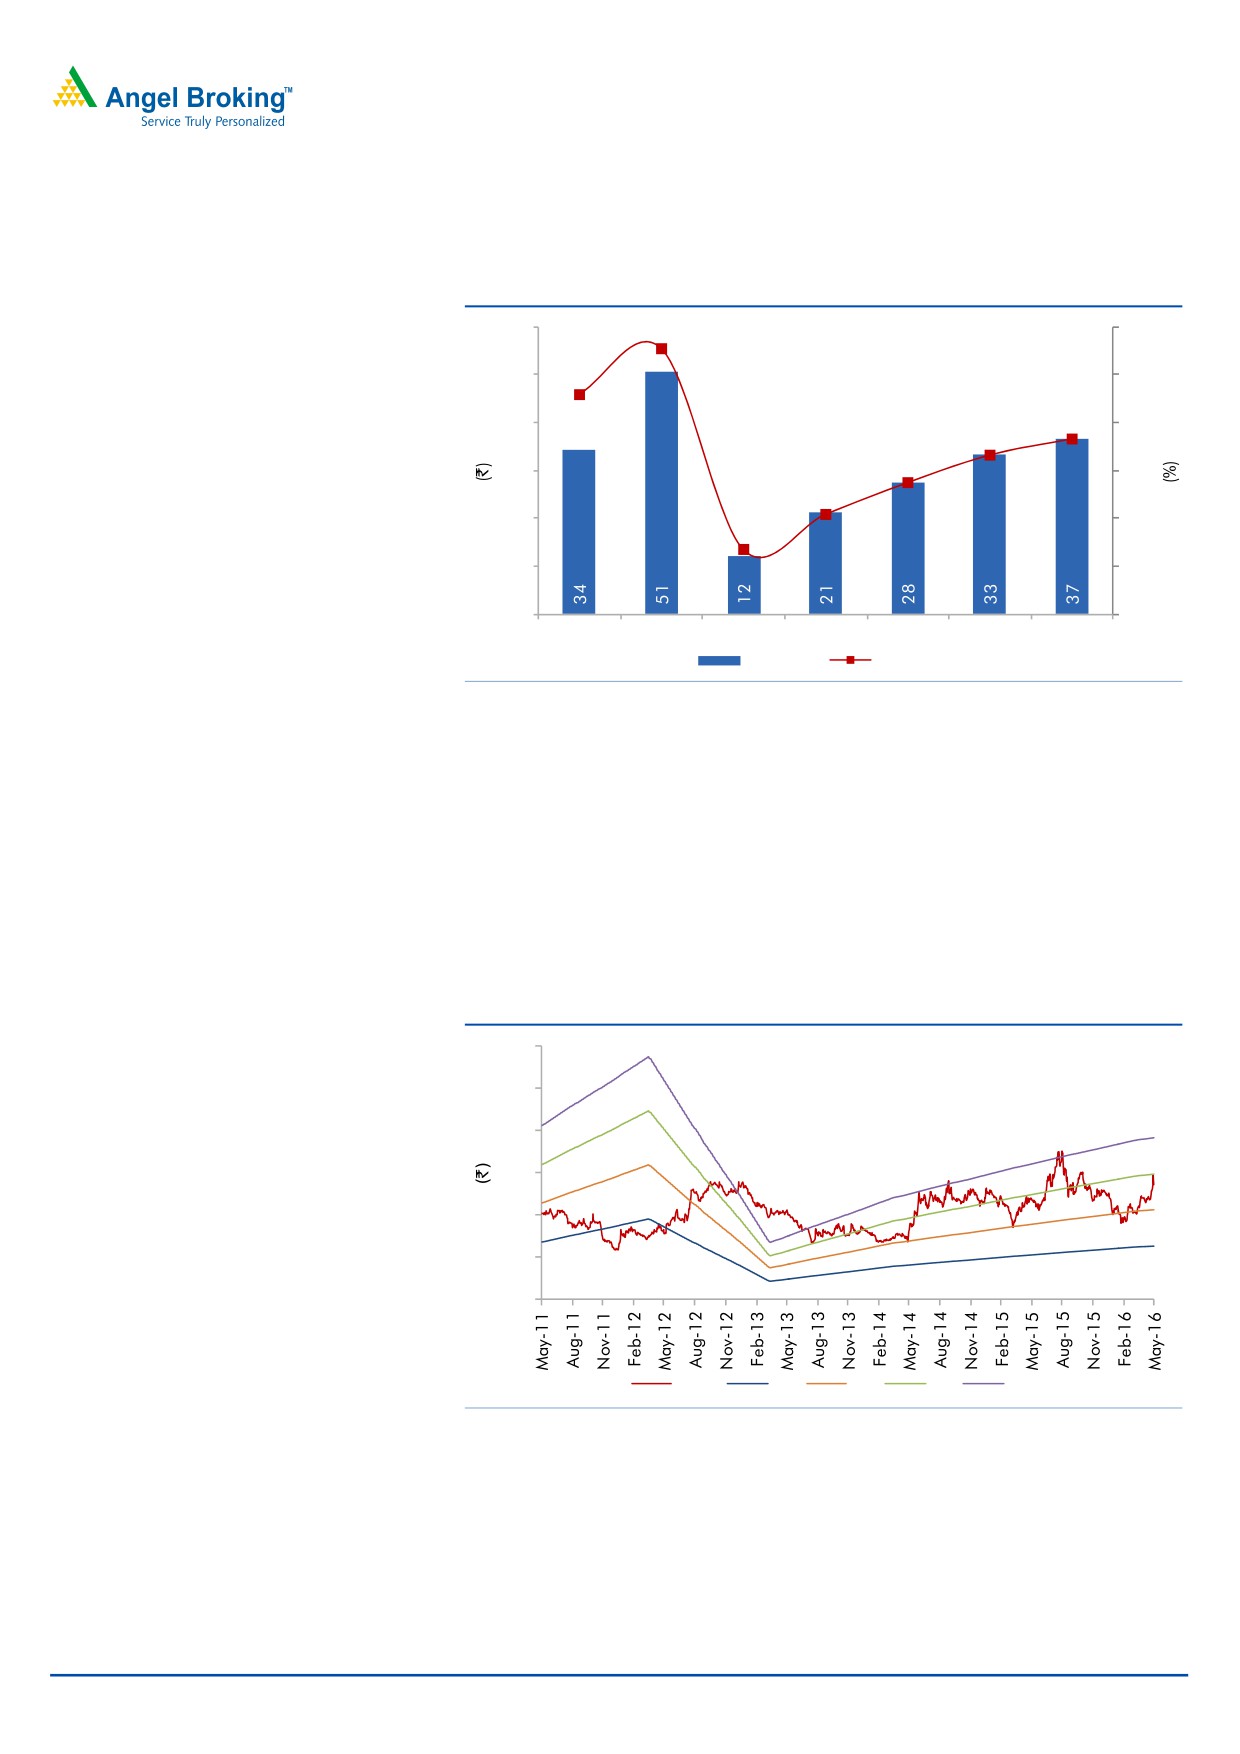
from current levels. On factoring the same, the bottom-line is expected to improve
from `28cr in FY2016 to `37cr in FY2018E.
Exhibit 7: PAT and PAT margins to improve
60
5.5
6.0
50
4.6
5.0
3.7
40
3.3
4.0
2.7
30
3.0
1.3
2.1
20
2.0
10
1.0
-
-
FY2012
FY2013
FY2014
FY2015
FY2016
FY2017E FY2018E
ADJ. PAT
PAT margins
Source: Company, Angel Research
Outlook and valuation
We have introduced our FY2018E estimates for the company and have lowered
our expectation for FY2017E on account of near term dampness in the ACS
division. At the current market price of `135, the stock is trading at a valuation of
5.9x FY2018E EPS, which is attractive. We continue to maintain our Buy rating on
the stock, with a revised target price of `162, valuing the stock at 7.0x its FY2018E
earnings.
Exhibit 8: One-year forward PE band
300
250
200
150
100
50
-
Price
3x
5x
7x
9x
Source: Company, Angel Research
May 21, 2016
6
Visaka Industries | 4QFY2016 Result Update
Exhibit 9: Comparative analysis
Company
Year end
Mcap
Sales
OPM PAT
EPS
RoE P/E P/BV
EV/EBITDA
EV/Sales
Visaka Industries
FY2018E
215
1,138
10.4
37
23.1
9.2
5.9
0.5
4.2
0.4
Everest Industries*
FY2018E
438
1,687
7.8
61
39.9
15.4
7.2
1.1
4.7
0.4
Hyderabad
FY2018E
387
1,325
9.9
61
81.7
11.9
6.4
0.7
4.0
0.4
Industries*
Source: Company, Angel Research, *Bloomberg
Key concerns
Forex risk: Asbestos fibre is a key raw material and accounts for 60% of overall
costs and is 100% imported. Since exports are limited and imports are significant,
the company is exposed to forex risk.
Dependence on rural growth: Rural demand for housing is a key growth driver
which depends upon increase in spending power and on government schemes.
High inflation and lower spend could have an adverse impact on roofing in rural
India.
Ban-Asbestos lobby: Asbestos fibre, included with other forms of asbestos, is being
considered to be a human carcinogen by the International Agency for Research on
Cancer (IARC) and by the U.S. Department of Health and Human Services. Any
government initiative to completely ban or restrict use of asbestos fibre will be a
negative.
Lack of entry barriers: Lack of entry barriers is attracting new entrants into this line
of business.
Company Background
Visaka Industries (established in 1985) is engaged in two businesses - building
products (cement asbestos products and fibre cement flat products like V-Boards
and V-Panels) and textiles. Its manufacturing facilities are spread across
11 locations supported by 9 marketing offices. The company is the second largest
cement asbestos products manufacturer in India with a 17% market share. The
spinning plant, with 33 MURATA Twinjet spinning machines is the world's largest
installation of its kind, producing about ~10,800 tons of yarn per annum.
May 21, 2016
7
Visaka Industries | 4QFY2016 Result Update
Profit and Loss
Y/E March (` cr)
FY2014
FY2015
FY2016
FY2017E
FY2018E
Total operating income
892
1,021
1,005
1,051
1,138
% chg
(2.6)
14.5
(1.6)
4.6
8.3
Net Raw Materials
560
578
572
589
641
% chg
5.5
3.1
(1.0)
3.1
8.7
Personnel
52
59
68
74
78
% chg
10.6
14.1
14.5
8.3
6.0
Other Expenses
223
288
266
280
301
% chg
(3.6)
29.5
(7.9)
5.3
7.7
Total Expenditure
835
925
905
943
1,020
EBITDA
57
96
100
108
118
% chg
(46.3)
67.4
4.0
8.7
9.1
EBITDA Margin
6.4
9.4
9.9
10.3
10.4
Depreciation & Amortisation
22
43
36
39
43
EBIT
35
53
63
70
75
% chg
(60.0)
51.6
20.1
9.7
7.6
(% of Net Sales)
3.9
5.2
6.3
6.9
7.5
Interest & other Charges
21
22
21
23
24
Other Income
5
2
3
3
4
(% of Net Sales)
0.6
0.2
0.3
0.3
0.4
Recurring PBT
13
31
42
47
51
% chg
(81.3)
129.1
36.8
10.7
8.6
Extraordinary Expense/(Inc.)
-
-
5
-
-
PBT (reported)
19
33
40
50
55
Tax
7
12
16
16
18
(% of PBT)
36.3
36.0
39.5
33.0
33.0
PAT (reported)
12
21
24
33
37
Exceptional Item
0.1
-
3.2
-
-
ADJ. PAT
12
21
28
33
37
% chg
(76.3)
76.6
29.8
21.0
10.2
(% of Net Sales)
1.3
2.1
2.7
3.3
3.7
Basic EPS (`)
7.5
13.4
17.4
21.0
23.1
Fully Diluted EPS (`)
7.5
13.4
17.4
21.0
23.1
% chg
(76.4)
77.5
29.8
21.0
10.2
May 21, 2016
8
Visaka Industries | 4QFY2016 Result Update
Balance Sheet
Y/E March (` cr)
FY2014
FY2015
FY2016E
FY2017E
FY2018E
SOURCES OF FUNDS
Equity Share Capital
16
16
16
16
16
Preference Capital
-
-
-
-
-
Reserves& Surplus
317
316
331
355
382
Shareholders’ Funds
333
332
347
371
398
Minority Interest
-
-
-
-
-
Total Loans
265
304
318
378
417
Other long term liabilities
24
27
32
32
32
Net Deferred tax liability
30
26
22
22
22
Total Liabilities
652
689
719
803
870
APPLICATION OF FUNDS
Gross Block
527
567
589
648
743
Less: Acc. Depreciation
192
255
291
330
373
Net Block
334
312
298
318
370
Capital Work-in-Progress
21
0
0
40
10
Lease adjustment
-
-
-
-
-
Goodwill
-
-
-
-
-
Investments
15
15
10
10
10
Other non-current assets
0
0
0
0
0
Current Assets
341
444
483
500
548
Cash
26
28
75
99
120
Loans & Advances
30
37
29
30
33
Other current assets
0
0
0
0
0
Current liabilities
77
101
99
93
98
Net Current Assets
264
343
384
407
450
Mis. Exp. not written off
-
-
-
-
-
Total Assets
652
689
719
803
870
May 21, 2016
9
Visaka Industries | 4QFY2016 Result Update
Cash flow statement
Y/E March (` cr)
FY2014 FY2015 FY2016 FY2017E FY2018E
Profit Before Tax
19
33
40
50
55
Depreciation
22
43
36
39
43
Other Income
(5)
(2)
(3)
(3)
(4)
Change in Working Capital
59
(77)
5
1
(22)
Direct taxes paid
(7)
(12)
(16)
(16)
(18)
Cash Flow from Operations
88
(15)
63
70
54
(Incr)/ Decr in Fixed Assets
(111)
(19)
(22)
(98)
(65)
(Incr)/Decr In Investments
22
(2)
(2)
(1)
(2)
Other Income
5
2
3
3
4
Cash Flow from Investing
(83)
(18)
(22)
(96)
(63)
Issue of Equity/Preference
-
-
-
-
-
Incr/(Decr) in Debt
(7)
39
15
60
39
Dividend Paid (Incl. Tax)
(5)
(10)
(10)
(10)
(10)
Others
(1)
6
-
-
-
Cash Flow from Financing
(12)
35
6
51
30
Incr/(Decr) In Cash
(7)
2
46
24
21
Opening cash balance
34
26
28
75
99
Closing cash balance
26
28
75
99
120
May 21, 2016
10
Visaka Industries | 4QFY2016 Result Update
Key Ratios
Y/E March
FY2014
FY2015
FY2016
FY2017E
FY2018E
Valuation Ratio (x)
P/E (on FDEPS)
17.9
10.1
7.8
6.4
5.9
P/CEPS
6.2
3.3
3.4
3.0
2.7
P/BV
0.6
0.6
0.6
0.6
0.5
Dividend yield (%)
2.2
4.5
4.5
4.5
4.5
EV/Net sales
0.5
0.5
0.4
0.5
0.4
EV/EBITDA
7.7
5.0
4.5
4.5
4.2
EV / Total Assets
0.7
0.7
0.6
0.6
0.6
Per Share Data (`)
EPS (Basic)
7.5
13.4
17.4
21.0
23.1
EPS (fully diluted)
7.5
13.4
17.4
21.0
23.1
Cash EPS
21.7
40.5
40.2
45.5
50.5
DPS
2.5
5.0
5.0
5.0
5.0
Book Value
209.9
209.2
218.6
233.5
250.6
DuPont Analysis
EBIT margin
3.9
5.2
6.3
6.6
6.6
Tax retention ratio
0.6
0.6
0.6
0.7
0.7
Asset turnover (x)
1.5
1.6
1.6
1.6
1.6
ROIC (Post-tax)
3.8
5.2
6.1
7.1
6.9
Cost of Debt (Post Tax)
5.1
4.6
4.1
4.1
3.9
Leverage (x)
0.7
0.8
0.7
0.7
0.7
Operating ROE
2.8
5.7
7.4
9.4
9.0
Returns (%)
ROCE (Pre-tax)
5.3
7.7
8.8
8.7
8.6
Angel ROIC (Pre-tax)
5.9
8.2
10.0
10.6
10.3
ROE
3.6
6.4
7.9
9.0
9.2
Turnover ratios (x)
Asset TO (Gross Block)
1.7
1.8
1.7
1.6
1.5
Inventory / Net sales (days)
94
78
88
82
80
Receivables (days)
38
40
50
45
45
Payables (days)
31
36
36
36
35
WC cycle (ex-cash) (days)
109
99
113
107
102
Solvency ratios (x)
Net debt to equity
0.7
0.8
0.7
0.7
0.7
Net debt to EBITDA
3.9
2.7
2.3
2.5
2.4
Int. Coverage (EBIT/ Int.)
1.6
2.4
3.0
3.0
3.1
May 21, 2016
11
Visaka Industries | 4QFY2016 Result Update
Research Team Tel: 022 - 39357800
DISCLAIMER
Angel Broking Private Limited (hereinafter referred to as “Angel”) is a registered Member of National Stock Exchange of India Limited,
Bombay Stock Exchange Limited and Metropolitan Stock Exchange of India Limited. It is also registered as a Depository Participant with
CDSL and Portfolio Manager with SEBI. It also has registration with AMFI as a Mutual Fund Distributor. Angel Broking Private Limited is
a registered entity with SEBI for Research Analyst in terms of SEBI (Research Analyst) Regulations, 2014 vide registration number
INH000000164. Angel or its associates has not been debarred/ suspended by SEBI or any other regulatory authority for accessing
/dealing in securities Market. Angel or its associates including its relatives/analyst do not hold any financial interest/beneficial
ownership of more than 1% in the company covered by Analyst. Angel or its associates/analyst has not received any compensation /
managed or co-managed public offering of securities of the company covered by Analyst during the past twelve months. Angel/analyst
has not served as an officer, director or employee of company covered by Analyst and has not been engaged in market making activity
of the company covered by Analyst.
This document is solely for the personal information of the recipient, and must not be singularly used as the basis of any investment
decision. Nothing in this document should be construed as investment or financial advice. Each recipient of this document should
make such investigations as they deem necessary to arrive at an independent evaluation of an investment in the securities of the
companies referred to in this document (including the merits and risks involved), and should consult their own advisors to determine
the merits and risks of such an investment.
Reports based on technical and derivative analysis center on studying charts of a stock's price movement, outstanding positions and
trading volume, as opposed to focusing on a company's fundamentals and, as such, may not match with a report on a company's
fundamentals.
The information in this document has been printed on the basis of publicly available information, internal data and other reliable
sources believed to be true, but we do not represent that it is accurate or complete and it should not be relied on as such, as this
document is for general guidance only. Angel Broking Pvt. Limited or any of its affiliates/ group companies shall not be in any way
responsible for any loss or damage that may arise to any person from any inadvertent error in the information contained in this report.
Angel Broking Pvt. Limited has not independently verified all the information contained within this document. Accordingly, we cannot
testify, nor make any representation or warranty, express or implied, to the accuracy, contents or data contained within this document.
While Angel Broking Pvt. Limited endeavors to update on a reasonable basis the information discussed in this material, there may be
regulatory, compliance, or other reasons that prevent us from doing so.
This document is being supplied to you solely for your information, and its contents, information or data may not be reproduced,
redistributed or passed on, directly or indirectly.
Neither Angel Broking Pvt. Limited, nor its directors, employees or affiliates shall be liable for any loss or damage that may arise from
or in connection with the use of this information.
Note: Please refer to the important ‘Stock Holding Disclosure' report on the Angel website (Research Section). Also, please refer to the
latest update on respective stocks for the disclosure status in respect of those stocks. Angel Broking Pvt. Limited and its affiliates may
have investment positions in the stocks recommended in this report.
Disclosure of Interest Statement
Visaka Industries
1. Analyst ownership of the stock
No
2. Angel and its Group companies ownership of the stock
No
3. Angel and its Group companies' Directors ownership of the stock
No
4. Broking relationship with company covered
No
Note: We have not considered any Exposure below ` 1 lakh for Angel, its Group companies and Directors
Ratings (Based on expected returns
Buy (> 15%)
Accumulate (5% to 15%)
Neutral (-5 to 5%)
over 12 months investment period):
Reduce (-5% to -15%)
Sell (< -15)
May 21, 2016
12