2QFY2016 Result Update | Cement Products
November 18, 2015
Visaka Industries
BUY
CMP
`119
Performance Highlights
Target Price
`144
Y/E March (` cr)
2QFY16 2QFY15
% chg (yoy) 1QFY16
% chg (qoq)
Investment Period
12 Months
Net sales
192
210
(8.2)
321
(40.2)
Stock Info
EBITDA
15
19
(21.6)
36
(57.6)
EBITDA Margin (%)
7.9
9.3
(135)bp
11.2
(326)bp
Sector
Cement Products
Adjusted PAT
0.8
3.7
(78.9)
13.6
(94.3)
Market Cap (` cr)
189
Source: Company, Angel Research
Net Debt
262
For 2QFY2016, Visaka Industries reported a mixed set of numbers. The top-line,
Beta
1.4
at `192cr (8.2% yoy decline), was marginally below our estimate of `205cr. The
52 Week High / Low
189 / 85
EBITDA declined by 21.6% yoy to `15cr and the EBITDA margin contracted by
Avg. Daily Volume
17,961
135bp yoy to 7.9%, owing to a 109bp yoy increase in raw material cost as a
percentage of sales to 50.2% and 157bp yoy increase in employee expense to
Face Value (`)
10
8.0% of sales. Other expenses declined by 131bp yoy to 33.9% of sales. We had
BSE Sensex
25,864
built in an EBITDA margin estimate of 6.4%. Interest expense at `5cr was higher
Nifty
7,838
by 19.7% on a yoy basis. Consequently, the net profit declined by 78.9% yoy to
Reuters Code
VSKI.BO
`0.8cr, against our estimate of `1.5cr.
Bloomberg Code
VSKI.IN
Near term pressure for Asbestos Cement Products (ACP); Overall long term
prospects intact: The ACP division of the Building Products segment is likely to
Shareholding Pattern (%)
face pressure in the near term on account of subdued rural sentiment. However,
Promoters
37.5
the company is a major player with ~17% market share. With the rural economy
expected to improve in the longer run, we expect the division to perform well
MF / Banks / Indian Fls
0.7
going forward. The Building products segment is also supported by strong
FII / NRIs / OCBs
3.9
performance of its V-boards division which is expected to post a robust
Indian Public / Others
57.8
performance on account of growing acceptance and cost advantages against
substitute products and increasing contribution of exports. Additionally, we expect the
Abs.(%)
3m 1yr
3yr
Synthetic yarn segment to remain a steady contributor, thus aiding top-line growth.
Sensex
(7.6)
(8.6)
40.7
Outlook and Valuations: We have marginally revised our estimates downwards
Visaka
(25.8)
(6.3)
(4.8)
for FY2017E to factor in the lower than estimated numbers. At the current market
price of `119, the stock is trading at a valuation of 4.1x FY2016E EPS, which
continues to be attractive. We continue to maintain our Buy rating on the stock,
3 Year Price Chart
with a revised target price of `144, valuing the stock at 5.0x on FY2017E
earnings.
Key financials
Y/E March (` cr)
FY2013
FY2014
FY2015E
FY2016E
FY2017E
Net sales
916
892
1,021
1,086
1,197
% chg
22.0
(2.6)
14.5
6.4
10.2
Adj. net profit
51
12
21
34
46
% chg
47.5
(76.3)
76.5
61.0
33.5
EBITDA Margin (%)
11.6
6.4
9.4
9.9
10.2
Source: Company, Angel Research
EPS (`)
31.9
7.5
13.4
21.5
28.7
P/E (x)
3.7
15.7
8.9
5.5
4.1
P/BV (x)
0.6
0.6
0.6
0.5
0.5
RoE (%)
15.6
3.6
6.4
9.6
11.6
RoCE (%)
13.4
5.3
7.7
10.1
11.7
Milan Desai
EV/Sales (x)
0.5
0.5
0.4
0.4
0.4
+91 22 4000 3600 Ext: 6846
EV/EBITDA (x)
9.5
3.9
5.2
6.5
7.0
Source: Company, Angel Research; Note: CMP as of November 17, 2015
Please refer to important disclosures at the end of this report
1
Visaka Industries | 2QFY2016 Result Update
Exhibit 1: 2QFY2016 performance
Y/E March (` cr)
2QFY16
2QFY15
% chg (yoy)
1QFY16
% chg (qoq)
1HFY16
1HFY15
% chg
Total operating income
192
210
(8.2)
321
(40.2)
514
522
(1.6)
Net raw material
97
103
(6.2)
189
(48.8)
285
296
(3.7)
(% of Sales)
50.2
49.1
109bp
58.7
(849)bp
55.5
56.8
(124)bp
Employee cost
15
13
14.2
19
(17.1)
34
31
10.9
(% of Sales)
8.0
6.4
157bp
5.8
223bp
6.6
5.9
74bp
Other Expenses
65
74
(11.7)
78
(16.8)
143
141
1.4
(% of Sales)
33.9
35.2
(131)bp
24.3
952bp
27.9
27.1
81bp
Total expenditure
177
190
(6.9)
286
(38.0)
463
468
(1.2)
EBITDA
15
19
(21.6)
36
(57.6)
51
54
(4.6)
EBITDA Margin (%)
7.9
9.3
(135)bp
11.2
(326)bp
10.0
10.3
(32)bp
Interest
5
4
19.7
5
(11.8)
10
9
15.1
Depreciation
10
10
(6.1)
9
0.3
19
24
(20.0)
Other income
1
1
(16.6)
1
(56.0)
2
2
21.9
PBT
1
6
21.1
22
17.0
24
22
5.6
(% of Sales)
0.7
2.8
6.9
4.6
4.3
Tax
0.6
2.2
(70.8)
8.6
(92.5)
9
7
23.4
(% of PBT)
45.3
37.4
38.7
39.1
33.5
Reported PAT
0.8
4
78.9
14
(94.3)
14
15
(3.4)
Exceptional items
0
0
0
0
0
Adjusted PAT
1
4
78.9
14
(94.3)
14
15
(3.4)
PATM (%)
0.4
1.8
4.2
2.8
2.9
Source: Company, Angel Research
Result mostly below our expectations
For 2QFY2016, Visaka Industries reported a mixed set of numbers. The top-line at
`192cr (8.2% yoy decline) was below our estimates of `205cr. The EBITDA
declined by 21.6% yoy to `15cr and the EBITDA margin contracted by 135bp yoy
to 7.9% owing to a 109bp yoy increase in raw material cost as a percentage of
sales to 50.2% and 157bp yoy increase in employee expense to 8.0% of sales. We
had accounted for a higher raw material expense (52.3% of sales on account of
USD appreciation against INR). Other expenses declined by 131bp yoy to 33.9%
of sales. We had built in an EBITDA margin estimate of 6.4%. The interest expense
at `5cr was higher by 19.7% on a yoy basis. As a result, the net profit declined by
78.9% yoy to `0.8cr. We had estimated a net profit of `1.5cr for the quarter.
Exhibit 2: Actual vs. Estimate
Actual v/s Angel's Estimates
Actual (`cr)
Estimate (`cr)
% variation
Total Income (` cr)
192
205
(6.1)
EBITDA (`cr)
15
13
16.8
EBITDA Margin (%)
7.9
6.4
155bp
Adjusted PAT (` cr)
0.8
1.5
(48.4)
Source: Company, Angel Research
November 18, 2015
2
Visaka Industries | 2QFY2016 Result Update
Segmental performance
Sales of the Building products segment declined by 7.7% yoy to `147.7cr, while
that of Synthetic yarn segment declined by 13.2% yoy to `41.9cr. The Building
products segment reported an EBIT of `3.4cr and EBIT margin of 2.3% as against
EBIT and EBIT margin of `6.7cr and 4.2%, respectively in the corresponding
quarter a year ago. The Synthetic yarn division reported EBIT and EBIT margin of
`7.1cr and 16.9% respectively, as against `6.0cr and 12.4%, in the corresponding
quarter a year ago.
Exhibit 3: Segment-wise performance
Y/E Mar (` cr)
2QFY16
2QFY15
% chg (yoy) 1QFY16
% chg (qoq)
Total Revenue
A) Building Products
147.7
160.0
(7.7)
273.5
(46.0)
B) Synthetic Yarn
41.9
48.3
(13.2)
44.3
(5.4)
Total
189.6
(51.4)
(468.7)
317.8
(40.3)
EBIT
A) Building Products
3.4
6.7
(49.0)
24.5
(86.1)
B) Synthetic Yarn
7.1
6.0
18.3
7.7
(8.1)
Total
10.5
(94.2)
(111.1)
32.2
(67.5)
EBIT Margin (%)
A) Building Products
2.3
4.2
(187)bp
9.0
(667)bp
B) Synthetic Yarn
16.9
12.4
451bp
17.4
(49)bp
Source: Company, Angel Research
November 18, 2015
3
Visaka Industries | 2QFY2016 Result Update
Investment arguments
Long term prospects intact, near term pressure for ACP division
The company’s Building products segment’s sales are dominated by Asbestos
Cement Products (accounting for 72% of FY2015 revenue). The company has
expanded its capacity from 6,52,000MT in FY2011 to 7,52,000MT in FY2012 to
cater to the rising rural demand. In the near term, we expect the Asbestos Cement
Products performance to be under pressure on account of poor monsoons
impacting rural sentiment. The company has been the second largest cement
asbestos products manufacturer in India with a 17% market share supported by its
outdoor advertising campaign and strong dealer network. In the longer run, we
expect the division to perform well once the rural sentiment turns positive.
The growth in the Building product segment is also supported by strong
performance of its V-boards division (capacity of 1,20,000MT). We expect the
V-boards division to post a robust performance going ahead as well, on account
of growing acceptance in India due to cost advantages against substitute products
and increasing contribution of exports.
The company’s Synthetic yarn segment has an installed capacity of 55,000 ring
spindles (31 MT M/CS). Strong growth in exports coupled with improvement in
realizations due to rupee depreciation would enable the company to post decent
revenue growth going ahead. As per the Federation of Indian Chamber of
Commerce and Industry (FICCI), India’s textile exports are expected to rise from
US$21bn in 2012 to US$145.6bn by 2023. This augurs well for the company as it
is expected to increase its focus on the export business which has higher margins.
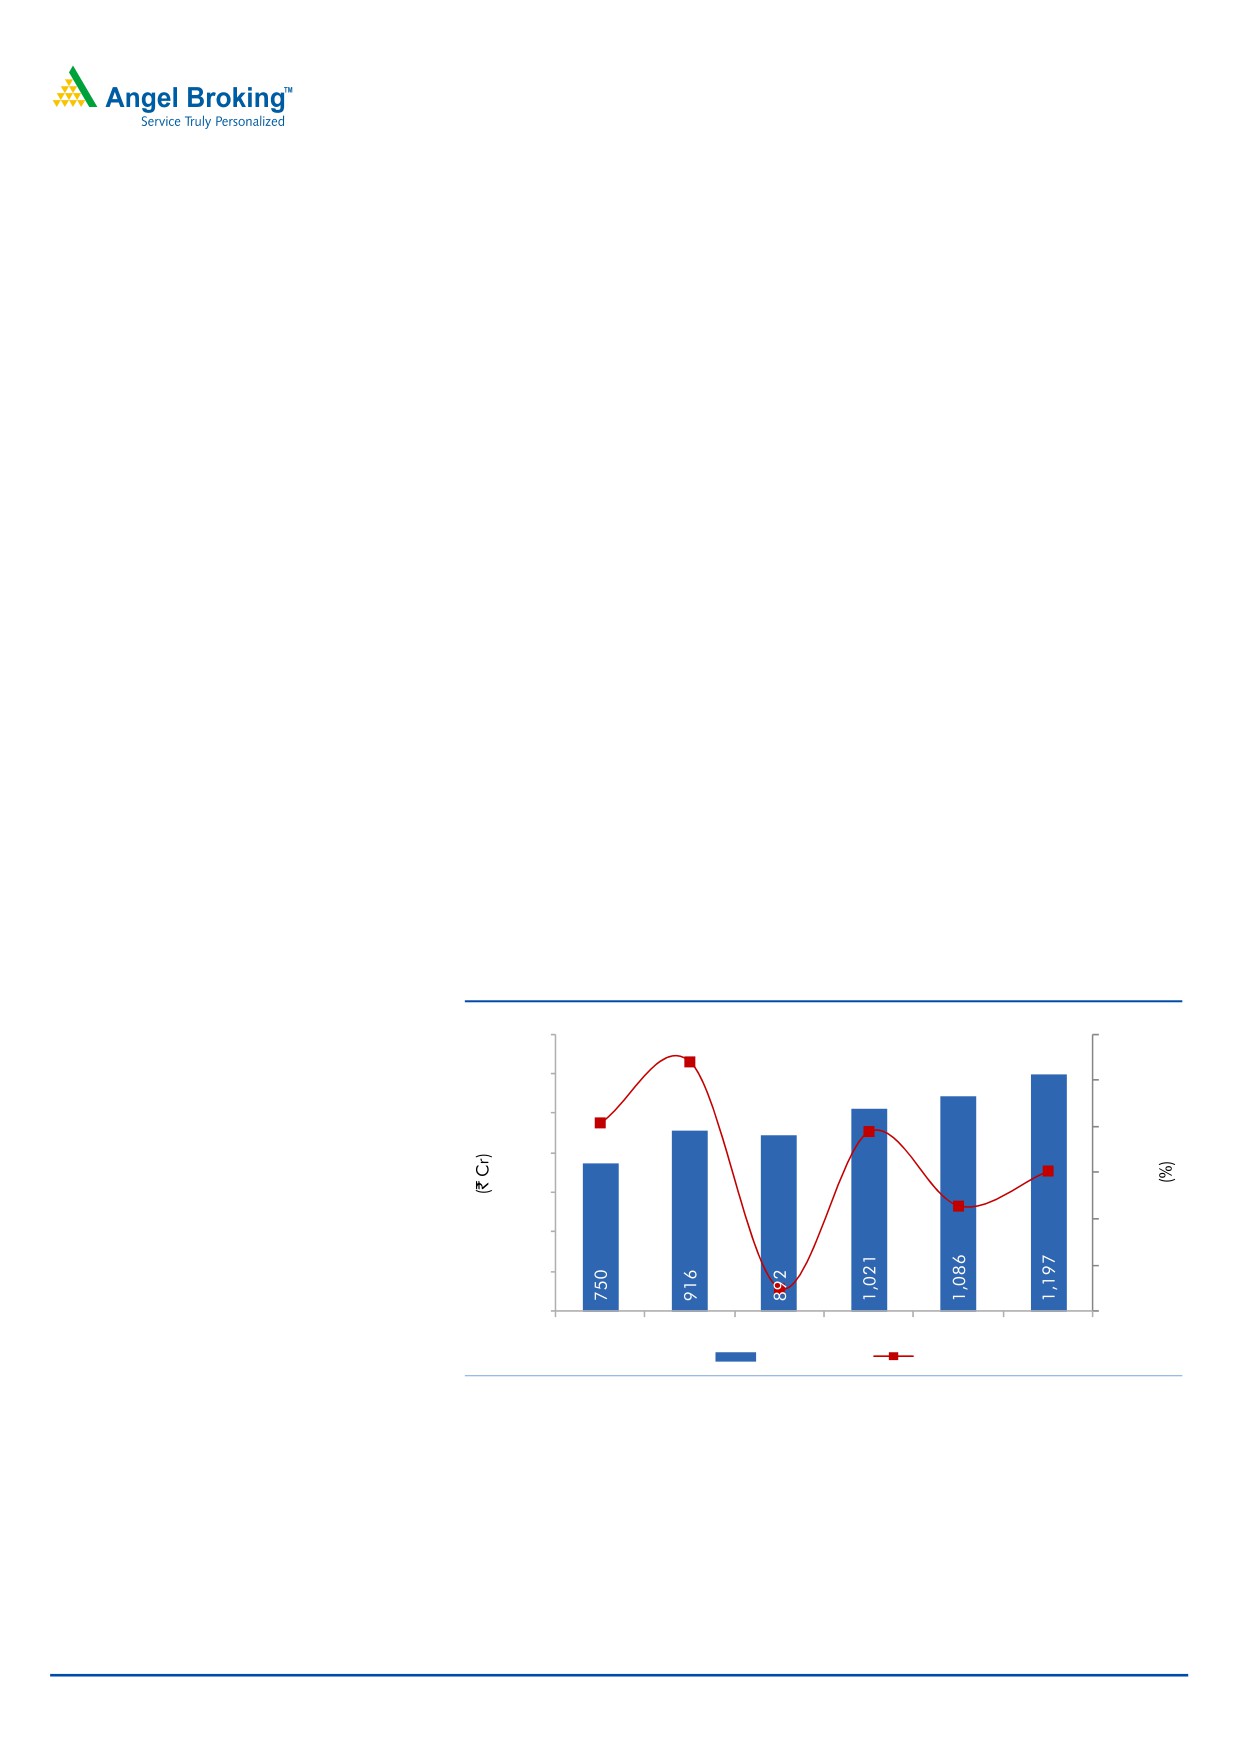
Exhibit 4: Sales to post a CAGR of 8.3% over FY2015-17E
1,400
25.0
22.0
1,200
20.0
1,000
15.4
15.0
14.5
800
10.
2
10.0
600
6.4
5.0
400
-
200
(2.6)
-
(5.0)
FY2012
FY2013
FY2014
FY2015
FY2016E FY2017E
Net Sales
Sales yoy growth
Source: Company, Angel Research
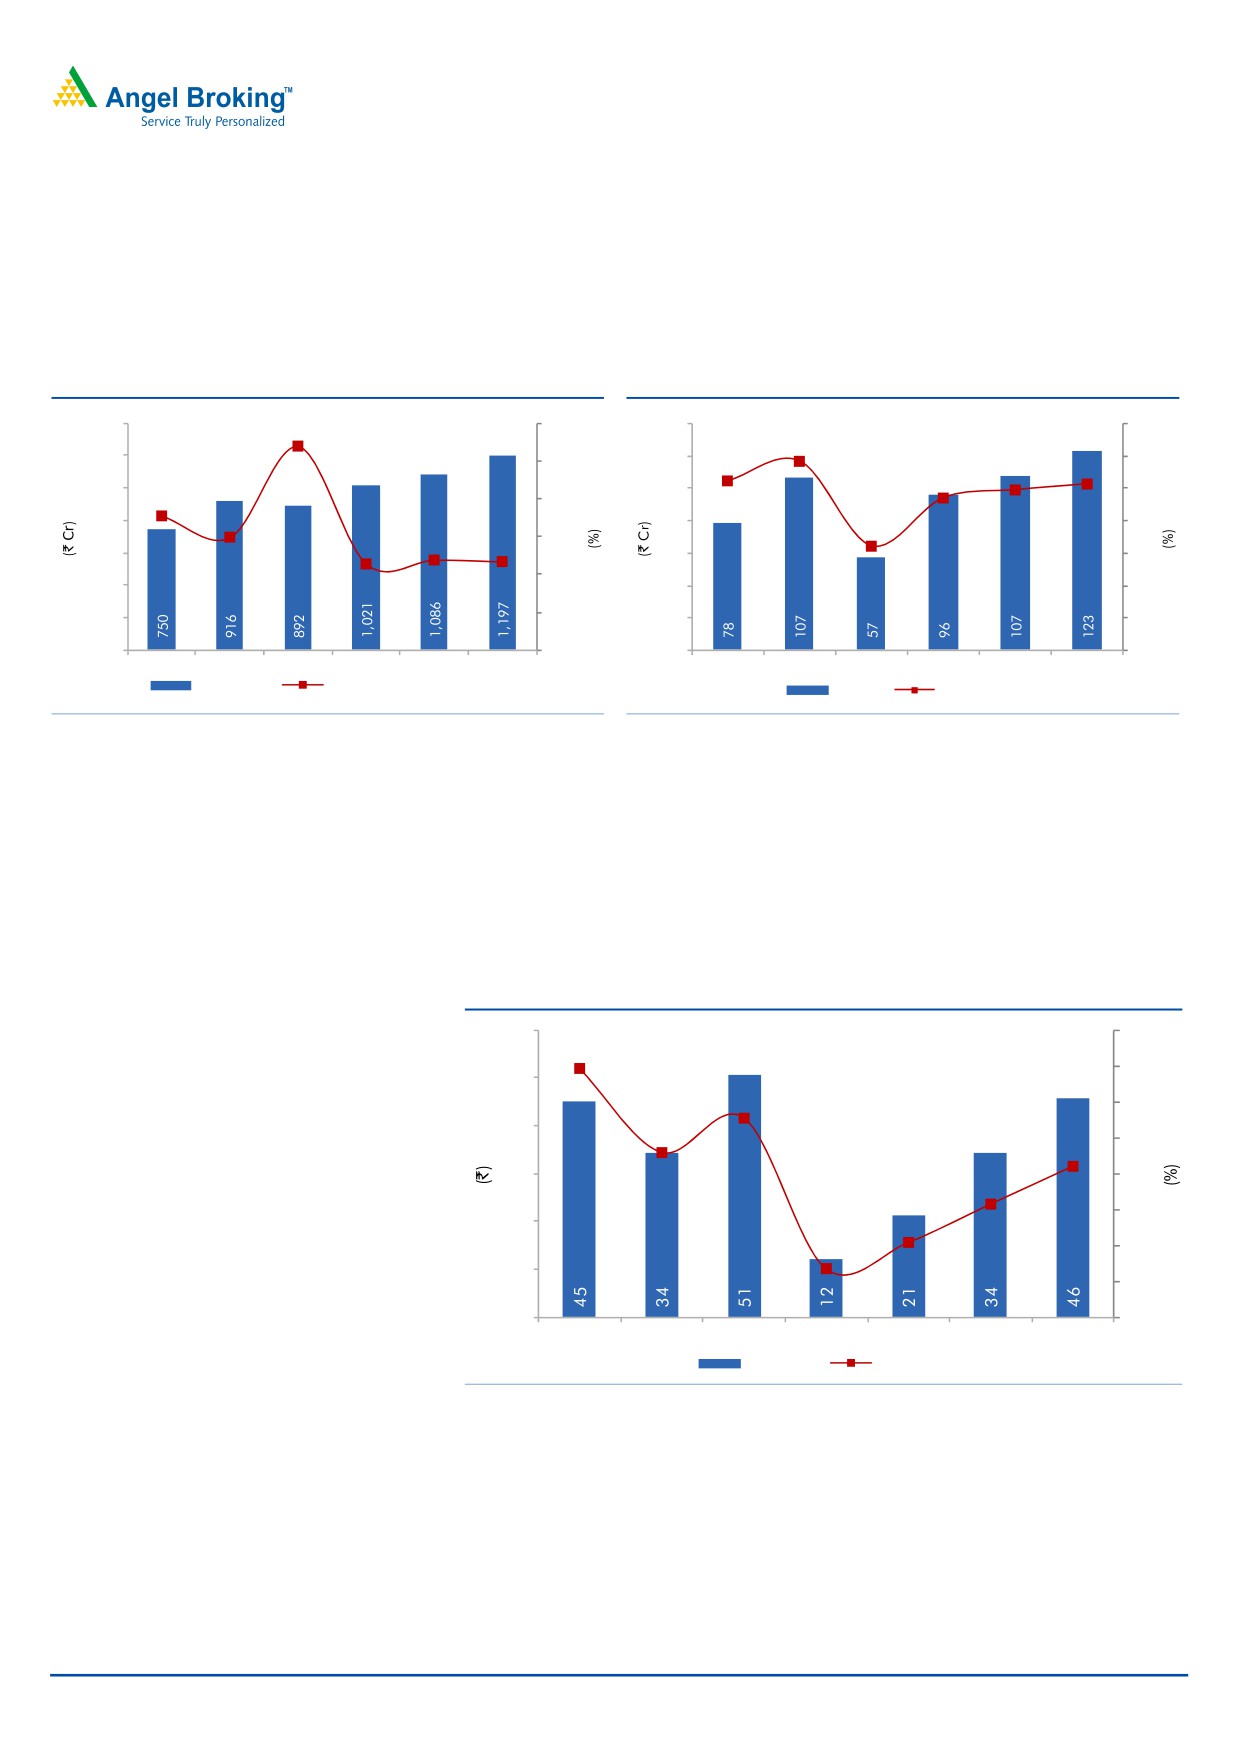
EBIDTA margin to witness an uptrend
The company’s raw material cost is expected to more or less be at levels of
FY2015. The company’s net raw-material cost as a percentage of sales is expected
to be at ~56.7% of sales in FY2017E. Asbestos fibre, the key raw material for
asbestos cement products is 100% imported and accounts for 60% of raw material
cost of building products segment. The recent depreciation of INR against the USD
November 18, 2015
4
Visaka Industries | 2QFY2016 Result Update
will impact the raw material cost to some extent. Moreover, asbestos fibre, cement
and fly ash prices are expected to remain flat. Freight costs too are expected to
remain stable as diesel prices have cooled down. The company is expected to
increase exports in its Synthetic yarn business, which has higher margins. As a result,
the EBIDTA margin will improve from 9.4% in FY2015 to 10.2% in FY2017E.
Exhibit 5: Raw material costs remain stable
Exhibit 6: EBITDA margin to improve to 10.2%
1,400
64.0
140
14.0
62.8
1,200
120
12.0
62.0
11.6
10.4
9.9
10
.2
1,000
100
10.0
60.0
9.4
800
59.1
80
8.0
58.0
58.0
56.8
6.4
600
56
.7
60
6.0
56.6
56.0
400
40
4.0
54.0
200
20
2.0
-
52.0
-
-
FY2012
FY2013
FY2014
FY2015
FY2016E FY2017E
FY2012
FY2013
FY2014
FY2015
FY2016E FY2017E
Net Sales
Raw material as % of net sales
EBIDTA
EBIDTA margins
Source: Company, Angel Research
Source: Company, Angel Research
PAT to grow at a CAGR of 46.6% over FY2015-17E
With improvement in EBIDTA margins coupled with lower depreciation cost,
especially in FY2017E, the PAT is expected to grow at a CAGR of 46.6% over
FY2015-17E to `46cr. As a result, the PAT margins are expected to improve from
2.1% in FY2015 to 4.2% in FY2017E.
Exhibit 7: PAT and PAT margins to improve
60
8.0
6.9
5.5
7.0
4.2
50
6.0
40
4.6
3.1
5.0
30
4.0
2.1
3.0
20
1.3
2.0
10
1.0
-
-
FY2011
FY2012
FY2013
FY2014
FY2015
FY2016E FY2017E
ADJ. PAT
PAT margins
Source: Company, Angel Research
Outlook and valuation
We have marginally revised our estimates downwards for FY2017E to factor in
lower than estimated numbers for the quarter. At the current market price of `119,
the stock is trading at a valuation of 4.1x FY2017E EPS, which continues to be
attractive. We continue to maintain our Buy rating on the stock, with a revised
target price of `144, valuing the stock at 5.0x on FY2017E earnings.
November 18, 2015
5
Visaka Industries | 2QFY2016 Result Update
Exhibit 8: One-year forward PE band
200
150
100
50
-
Price
2 x
4 x
6 x
8 x
Source: Company, Angel Research
Relative valuation
The leading players in the industry are Hyderabad Industries, Visaka Industries,
Everest Industries and Ramco Industries. These companies account for 70-75% of
industry capacity. Visaka Industries is trading at a cheap valuation of 4.1x P/E and
0.5x P/BV on FY2017E as compared to its peers which are trading at relatively
high valuations.
Exhibit 9: Comparative analysis
Company
Year end
Mcap
Sales
OPM PAT
EPS
RoE
P/E
P/BV
EV/Sales
EV/EBIDTA
Visaka Industries
FY2017E
189
1,197
10.2
46
28.7
11.6
4.1
0.5
3.5
0.4
Everest Industries*
FY2017E
437
1,596
7.6
55
36.0
15.1
7.9
1.2
5.5
0.4
Hyderabad Industries*
FY2017E
437
1,370
11.1
81
108.6
16.8
5.4
0.9
3.7
0.4
Source: Company, Angel Research, *Bloomberg
Key concerns
Increase in input costs due to rupee depreciation: The continuous increase in cost
of inputs is a matter of concern. Asbestos fibre, cement and fly ash and polyester
fibre are the key materials. Asbestos fibre is a key raw material and accounts for
60% of overall cost and is 100% imported. Since exports are limited and imports
are significant, the company is exposed to forex risk.
Dependence on rural growth: Rural demand for housing is the key growth driver
which depends upon increase in spending power and on government schemes.
High inflation and lower spend could have an adverse impact on roofing in rural
India.
Ban Asbestos Lobby: Asbestos fibre, included with other forms of asbestos, is being
considered to be a human carcinogen by the International Agency for Research on
Cancer (IARC) and by the U.S. Department of Health and Human Services. Any
government initiative to completely ban or restrict use of asbestos fibre will be a
negative.
November 18, 2015
6
Visaka Industries | 2QFY2016 Result Update
Lack of entry barriers: Lack of entry barriers is attracting new entrants into this line
of business. Closure of Canadian and Zimbabwean asbestos mines are a matter
of concern.
Company Background
Visaka Industries (established in 1985) is engaged in two businesses - building
products (cement asbestos products and fibre cement flat products like V-Boards
and V-Panels) and textiles. Its manufacturing facilities are spread across
11 locations supported by nine marketing offices. The company is the second
largest cement asbestos products manufacturer in India with a 17% market share.
The spinning plant, with
31 MURATA Twinjet spinning machines and
112
Two-For-One twisting machines, is the world's largest installation of its kind,
producing about 9,000 tons of yarns per annum.
November 18, 2015
7
Visaka Industries | 2QFY2016 Result Update
Profit and Loss
Y/E March (` cr)
FY2013
FY2014
FY2015
FY2016E
FY2017E
Net Sales
916
892
1,021
1,086
1,197
Other operating income
-
-
-
-
-
Total operating income
916
892
1,021
1,086
1,197
% chg
22.0
(2.6)
14.5
6.4
10.2
Net Raw Materials
531
560
578
617
678
% chg
19.7
5.5
3.1
6.8
10.0
Power and Fuel costs
51
48
51
53
59
% chg
31.4
(6.4)
6.3
4.9
10.2
Personnel
47
52
59
67
75
% chg
12.2
10.6
14.1
13.5
12.0
Selling & Admin Expenses
79
86
119
127
139
% chg
11.9
8.7
38.1
6.1
9.8
Other
101
89
118
115
123
% chg
31.0
(12.0)
33.6
(2.7)
6.7
Total Expenditure
809
835
925
979
1,074
EBITDA
107
57
96
107
123
% chg
36.1
(46.3)
67.4
12.0
14.2
EBITDA Margin
11.6
6.4
9.4
9.9
10.2
Depreciation & Amortisation
20
22
43
37
39
EBIT
87
35
53
70
84
% chg
43.3
(60.0)
51.6
33.4
19.1
(% of Net Sales)
9.5
3.9
5.2
6.5
7.7
Interest & other Charges
15
21
22
21
18
Other Income
3
5
2
3
3
(% of Net Sales)
0.3
0.6
0.2
0.3
0.3
Recurring PBT
72
13
31
49
66
% chg
54.7
(81.3)
129.0
59.2
35.5
PBT (reported)
75
19
33
52
69
Tax
24
7
12
18
24
(% of PBT)
32.1
36.3
36.1
34.0
34.0
PAT (reported)
51
12
21
34
46
Extraordinary Expense/(Inc.)
(0.1)
(0.1)
-
-
-
ADJ. PAT
51
12
21
34
46
% chg
47.5
(76.3)
76.5
61.0
33.5
(% of Net Sales)
5.5
1.3
2.1
3.1
4.2
Basic EPS (`)
31.9
7.5
13.4
21.5
28.7
Fully Diluted EPS (`)
31.9
7.5
13.4
21.5
28.7
% chg
47.5
(76.4)
77.3
61.0
33.5
November 18, 2015
8
Visaka Industries | 2QFY2016 Result Update
Balance Sheet
Y/E March (` cr)
FY2013
FY2014
FY2015
FY2016E
FY2017E
SOURCES OF FUNDS
Equity Share Capital
16
16
16
16
16
Preference Capital
-
-
-
-
-
Reserves& Surplus
310
317
316
341
377
Shareholders’ Funds
326
333
332
357
393
Minority Interest
-
-
-
-
-
Total Loans
277
265
304
288
273
Other long term liabilities
21
24
27
27
27
Net Deferred tax liability
26
30
26
26
26
Total Liabilities
651
652
689
698
719
APPLICATION OF FUNDS
Gross Block
421
527
567
606
624
Less: Acc. Depreciation
171
192
255
291
330
Net Block
250
334
312
315
294
Capital Work-in-Progress
16
21
0
0
0
Lease adjustment
-
-
-
-
-
Goodwill
0
0
0
0
0
Investments
15
15
15
15
15
Other non-current assets
0
0
0
0
0
Current Assets
419
341
444
445
497
Cash
34
26
28
30
63
Loans & Advances
26
30
37
39
43
Other current assets
0
0
0
0
0
Current liabilities
89
77
101
97
107
Net Current Assets
330
264
343
348
390
Mis. Exp. not written off
-
-
-
-
-
Total Assets
651
652
689
698
719
November 18, 2015
9
Visaka Industries | 2QFY2016 Result Update
Cash flow statement
Y/E March (` cr)
FY2013 FY2014 FY2015 FY2016E FY2017E
Profit Before Tax
75
19
33
52
69
Depreciation
20
22
43
37
39
Other Income
(3)
(5)
(2)
(3)
(3)
Change in Working Capital
(136)
59
(77)
(4)
(8)
Direct taxes paid
(24)
(7)
(12)
(18)
(24)
Cash Flow from Operations
(68)
88
(15)
64
73
(Incr)/ Decr in Fixed Assets
(37)
(111)
(19)
(40)
(18)
(Incr)/Decr In Investments
(29)
22
(2)
-
-
Other Income
3
5
2
3
3
Cash Flow from Investing
(63)
(83)
(18)
(37)
(15)
Issue of Equity/Preference
-
-
-
-
-
Incr/(Decr) in Debt
123
(7)
39
(16)
(15)
Dividend Paid (Incl. Tax)
(11)
(5)
(10)
(10)
(10)
Others
(0)
(1)
6
-
-
Cash Flow from Financing
111
(12)
35
(26)
(25)
Incr/(Decr) In Cash
(20)
(7)
2
2
33
Opening cash balance
54
34
26
28
30
Closing cash balance
34
26
28
30
63
November 18, 2015
10
Visaka Industries | 2QFY2016 Result Update
Key Ratios
Y/E March
FY2013
FY2014
FY2015
FY2016E
FY2017E
Valuation Ratio (x)
P/E (on FDEPS)
3.7
15.7
8.9
5.5
4.1
P/CEPS
2.7
5.5
2.9
2.7
2.2
P/BV
0.6
0.6
0.6
0.5
0.5
Dividend yield (%)
5.9
2.5
5.1
5.1
5.1
EV/Net sales
0.5
0.5
0.4
0.4
0.4
EV/EBITDA
3.9
7.2
4.7
4.0
3.5
EV / Total Assets
0.6
0.6
0.7
0.6
0.6
Per Share Data (`)
EPS (Basic)
31.9
7.5
13.4
21.5
28.7
EPS (fully diluted)
31.9
7.5
13.4
21.5
28.7
Cash EPS
44.3
21.7
40.5
44.8
53.2
DPS
6.0
2.5
5.0
5.0
5.0
Book Value
205.3
209.9
209.2
224.6
247.3
DuPont Analysis
EBIT margin
9.5
3.9
5.2
6.5
7.0
Tax retention ratio
0.7
0.6
0.6
0.7
0.7
Asset turnover (x)
1.6
1.5
1.6
1.7
1.9
ROIC (Post-tax)
10.1
3.8
5.2
7.1
8.6
Cost of Debt (Post Tax)
3.7
5.1
4.6
4.9
4.2
Leverage (x)
0.7
0.7
0.8
0.7
0.5
Operating ROE
14.6
2.8
5.7
8.6
10.8
Returns (%)
ROCE (Pre-tax)
13.4
5.3
7.7
10.1
11.7
Angel ROIC (Pre-tax)
14.9
5.9
8.2
10.8
13.1
ROE
15.6
3.6
6.4
9.6
11.6
Turnover ratios (x)
Asset TO (Gross Block)
2.2
1.7
1.8
1.8
1.9
Inventory / Net sales (days)
85
94
78
85
78
Receivables (days)
32
38
40
40
40
Payables (days)
35
31
36
36
36
WC cycle (ex-cash) (days)
91
109
99
106
98
Solvency ratios (x)
Net debt to equity
0.7
0.7
0.8
0.7
0.5
Net debt to EBITDA
2.1
3.9
2.7
2.3
1.6
Int. Coverage (EBIT/ Int.)
5.8
1.6
2.4
3.3
4.8
November 18, 2015
11
Visaka Industries | 2QFY2016 Result Update
Research Team Tel: 022 - 39357800
DISCLAIMER
Angel Broking Private Limited (hereinafter referred to as “Angel”) is a registered Member of National Stock Exchange of India Limited,
Bombay Stock Exchange Limited and Metropolitan Stock Exchange of India Limited. It is also registered as a Depository Participant with
CDSL and Portfolio Manager with SEBI. It also has registration with AMFI as a Mutual Fund Distributor. Angel Broking Private Limited is
a registered entity with SEBI for Research Analyst in terms of SEBI (Research Analyst) Regulations, 2014 vide registration number
INH000000164. Angel or its associates has not been debarred/ suspended by SEBI or any other regulatory authority for accessing
/dealing in securities Market. Angel or its associates including its relatives/analyst do not hold any financial interest/beneficial
ownership of more than 1% in the company covered by Analyst. Angel or its associates/analyst has not received any compensation /
managed or co-managed public offering of securities of the company covered by Analyst during the past twelve months. Angel/analyst
has not served as an officer, director or employee of company covered by Analyst and has not been engaged in market making activity
of the company covered by Analyst.
This document is solely for the personal information of the recipient, and must not be singularly used as the basis of any investment
decision. Nothing in this document should be construed as investment or financial advice. Each recipient of this document should
make such investigations as they deem necessary to arrive at an independent evaluation of an investment in the securities of the
companies referred to in this document (including the merits and risks involved), and should consult their own advisors to determine
the merits and risks of such an investment.
Reports based on technical and derivative analysis center on studying charts of a stock's price movement, outstanding positions and
trading volume, as opposed to focusing on a company's fundamentals and, as such, may not match with a report on a company's
fundamentals.
The information in this document has been printed on the basis of publicly available information, internal data and other reliable
sources believed to be true, but we do not represent that it is accurate or complete and it should not be relied on as such, as this
document is for general guidance only. Angel Broking Pvt. Limited or any of its affiliates/ group companies shall not be in any way
responsible for any loss or damage that may arise to any person from any inadvertent error in the information contained in this report.
Angel Broking Pvt. Limited has not independently verified all the information contained within this document. Accordingly, we cannot
testify, nor make any representation or warranty, express or implied, to the accuracy, contents or data contained within this document.
While Angel Broking Pvt. Limited endeavors to update on a reasonable basis the information discussed in this material, there may be
regulatory, compliance, or other reasons that prevent us from doing so.
This document is being supplied to you solely for your information, and its contents, information or data may not be reproduced,
redistributed or passed on, directly or indirectly.
Neither Angel Broking Pvt. Limited, nor its directors, employees or affiliates shall be liable for any loss or damage that may arise from
or in connection with the use of this information.
Note: Please refer to the important ‘Stock Holding Disclosure' report on the Angel website (Research Section). Also, please refer to the
latest update on respective stocks for the disclosure status in respect of those stocks. Angel Broking Pvt. Limited and its affiliates may
have investment positions in the stocks recommended in this report.
Disclosure of Interest Statement
Visaka Industries
1. Analyst ownership of the stock
No
2. Angel and its Group companies ownership of the stock
No
3. Angel and its Group companies' Directors ownership of the stock
No
4. Broking relationship with company covered
No
Note: We have not considered any Exposure below ` 1 lakh for Angel, its Group companies and Directors
Ratings (Based on expected returns
Buy (> 15%)
Accumulate (5% to 15%)
Neutral (-5 to 5%)
over 12 months investment period):
Reduce (-5% to -15%)
Sell (< -15)
November 18, 2015
12