4QFY2016 Result Update | Capital Goods
June 1, 2016
VA Tech Wabag
BUY
CMP
`575
Performance Highlights
Target Price
`681
Quarterly highlights - Standalone
Investment Period
12 Months
Y/E March (` cr)
4QFY16 4QFY15 3QFY16
% chg (yoy)
% chg (qoq)
Stock Info
Net sales
553
568
371
(2.6)
49.0
Sector
Capital Goods
EBITDA
93
78
37
19.2
153.2
Market Cap (` cr)
3,134
Reported PAT
56
52
21
8.2
171.8
Net debt (` cr)
19
Source: Company, Angel Research;
Beta
0.8
For 4QFY2016, VA Tech Wabag (Wabag) reported a 2.6% yoy decline in sales to
52 Week High / Low
833/409
`553cr, reflecting weak execution across the EPC-Municipal business. The EBITDA
Avg. Daily Volume
212,407
grew 19.2% yoy to `93cr while the EBITDA margin expanded by 306bp yoy to
Face Value (`)
2
16.8%. In-line with the EBITDA margin, the PAT margin expanded to 10.2%
BSE Sensex
26,836
during the quarter vs 9.1% in 4QFY2015.
Nifty
8,160
Reuters Code
VATE.BO
International revenues declined 10.4% yoy to `303cr, on account of Euro
Bloomberg Code
VATW@IN
depreciation and with some of the projects being at early stages of execution and
therefore not contributing to revenues. A poor operating performance coupled with
a higher tax rate led to losses in the international business during the quarter.
Shareholding Pattern (%)
The order book as of 4QFY2016-end stood at `8,315cr, reflecting order book /
Promoters
29.0
last twelve month (LTM) sales ratio of 3.3x.
MF / Banks / Indian Fls
25.4
FII / NRIs / OCBs
27.1
Valuation: Wabag trades at FY2017E/2018E P/E multiple of
22.1x/16.0x.
Indian Public / Others
18.5
Recently the company reported large ticket order wins from the Middle East and
Asian sub-continent (worth `2,862cr), which tend to enjoy higher margins than
orders from Europe. These order wins have now taken the order book to highs of
Abs. (%)
3m 1yr 3yr
`8,315cr, reflecting OB/LTM ratio at 3.3x. With better revenue visibility, we now
Sensex
12.1
(4.2)
36.0
expect Wabag to report 23.0% top-line and 45.6% bottom-line CAGR during
Wabag
36.7
(22.8)
146.2
FY2016-18E, respectively. Accordingly, we expect RoEs to expand from 9.7% in
FY2016 to 15.9% in FY2018E. Given such earnings growth and RoE expansion
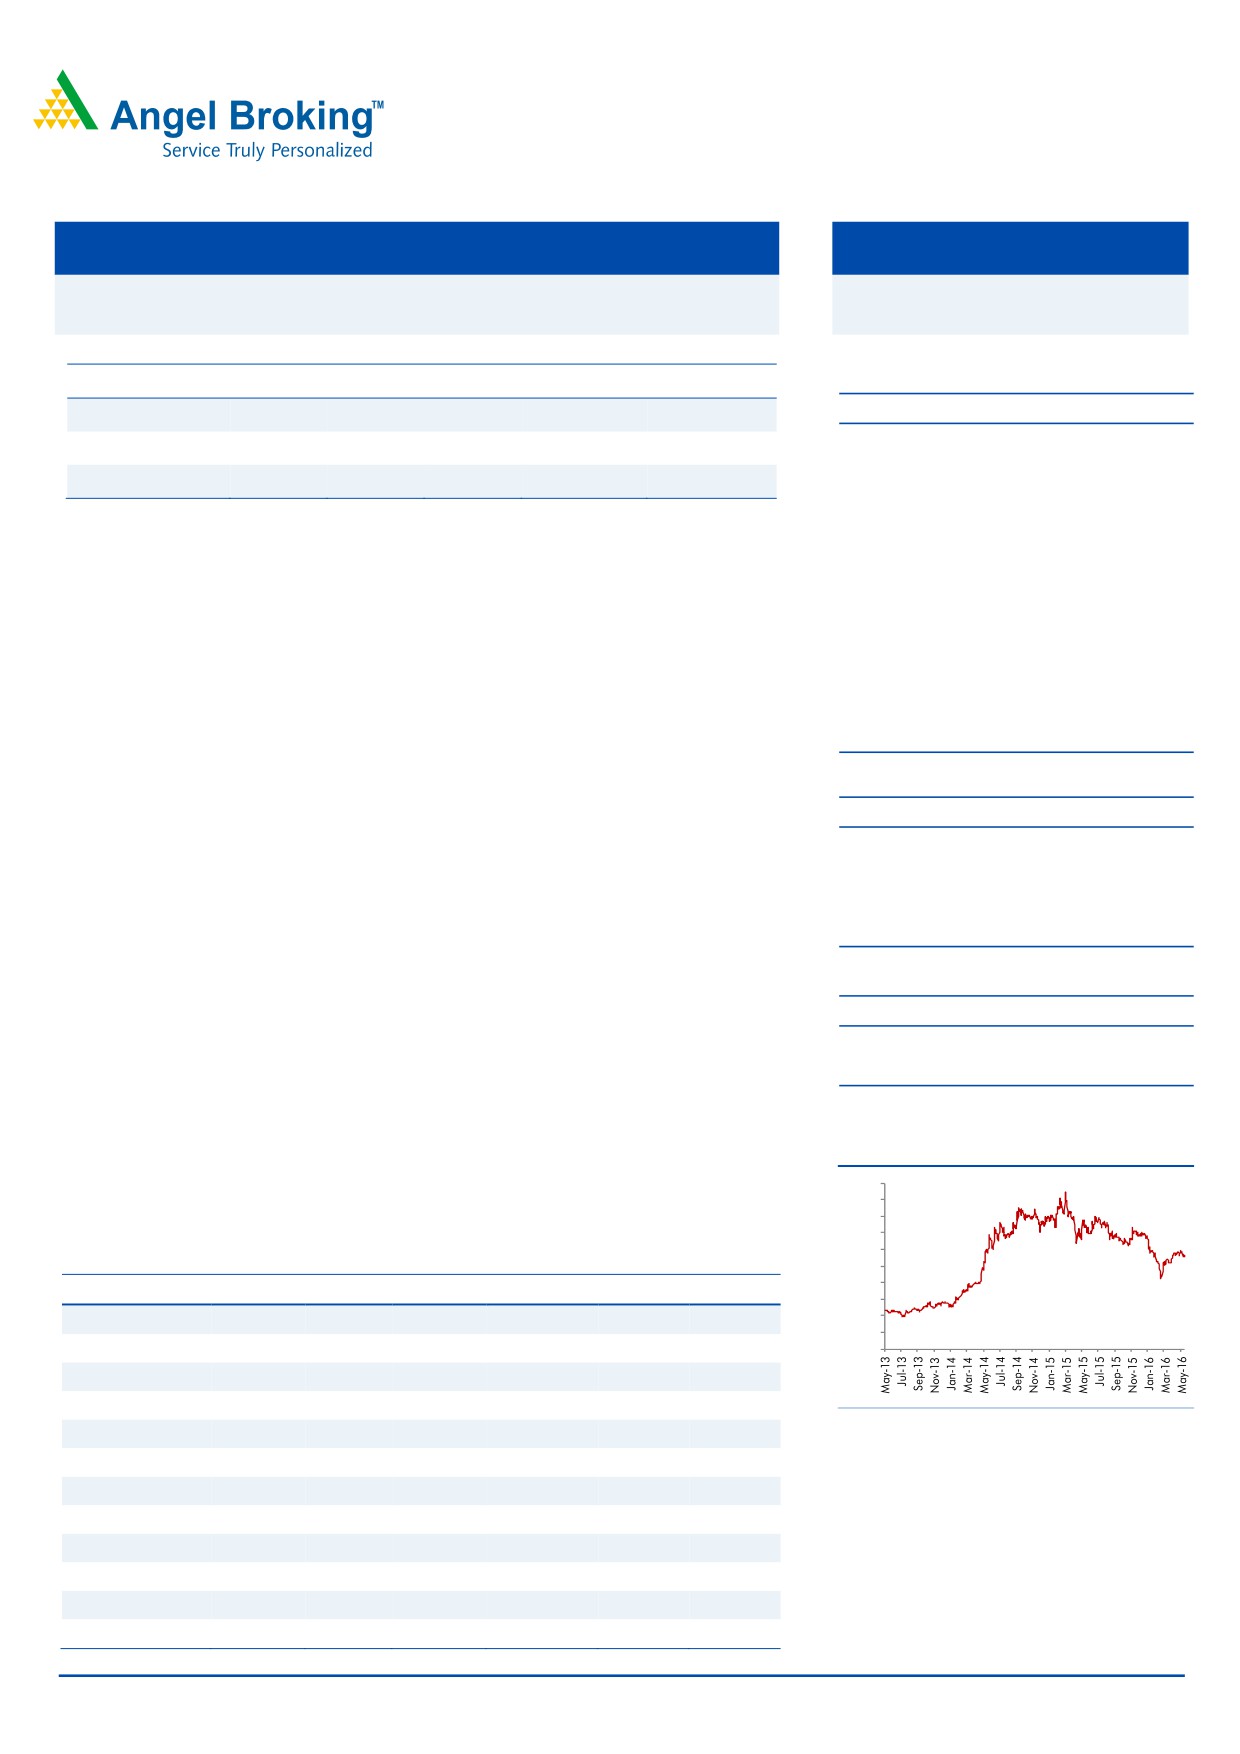
3-Year Daily Price Chart
potential, we assign 19.0x P/E multiple to our FY2018E EPS of `35.9 to arrive at
1000
a price target of
`681. Given the 18.5% upside potential, we upgrade our
900
800
recommendation on the stock to BUY.
700
600
Key financials (Consolidated)
500
400
Y/E March (` cr)
FY13
FY14
FY15
FY16
FY17E
FY18E
300
200
Net Sales
1,619
2,239
2,435
2,542
3,136
3,845
100
% chg
12.1
38.3
8.8
4.4
23.3
22.6
0
Net Profit
90
114
112
94
144
197
% chg
22.5
25.5
(2.9)
(16.3)
53.9
37.7
Source: Company, Angel Research
EBITDA (%)
9.6
8.4
8.6
8.6
8.9
9.1
EPS (`)
34
42
20
17
26
36
P/E (x)
17.0
13.6
28.5
34.0
22.1
16.0
P/BV (x)
2.1
1.8
3.5
3.2
2.8
2.4
RoE (%)
12.6
14.6
12.6
9.7
13.4
15.9
RoCE (%)
20.1
20.6
22.0
19.9
22.4
24.5
Yellapu Santosh
EV/Sales (x)
0.8
0.6
1.2
1.2
0.9
0.7
022 - 3935 7800 Ext: 6811
EV/EBITDA (x)
8.5
7.0
14.3
14.5
10.3
7.8
Source: Company, Angel Research; CMP as of May 31, 2016
Please refer to important disclosures at the end of this report
1
VA Tech Wabag | 4QFY2016 Result Update
Exhibit 1: Quarterly Performance (Standalone)
Particulars (` cr)
4QFY16
3QFY16
% chg (qoq)
4QFY15
% chg (yoy)
FY16
FY15
% chg
Net Sales
553
371
49.0
568
(2.6)
1,503
1,220
23.2
Total Expenditure
460
335
37.5
490
(6.0)
1,307
1,084
20.6
Cost of materials consumed
425
311
36.7
422
0.7
1,190
958
24.3
Change in Inventories
3
(22)
(112.9)
30
(90.8)
(36)
(15)
131.2
Employee benefits Expense
24
23
1.0
19
22.5
94
81
16.7
Other Expenses
9
22
(59.3)
18
(50.1)
59
61
(4.5)
EBITDA
93
37
153.2
78
19.2
195
136
43.7
EBIDTA %
16.8
9.9
13.7
13.0
11.1
Depreciation
3
3
1.0
3
(10.0)
12
7
62.0
EBIT
90
34
166.4
75
20.5
183
129
42.6
Interest and Financial Charges
6
5
35.1
0
nmf
15
6
166.7
Other Income & forex (gain)/loss
2
2
41.1
4
nmf
11
13
(19.8)
PBT before Exceptional Items
86
31
179.4
78
10.0
179
136
31.3
Exceptional Items
0
0
0
0
0
PBT after Exceptional Items
86
31
179.4
78
10.0
179
136
31.3
Tax
30
10
195.0
26
13.4
61
46
34.0
% of PBT
34.6
32.7
33.5
34.2
33.5
Net Profit/ (Loss) after taxes
56
21
171.8
52
8.2
117
90
29.9
PAT %
10.2
5.6
9.1
7.8
7.4
Dil. EPS (after extra-ord. Items)
10.26
3.79
170.7
9.53
7.7
21.43
16.59
29.2
Source: Company, Angel Research; Note: nmf- Not meaningful
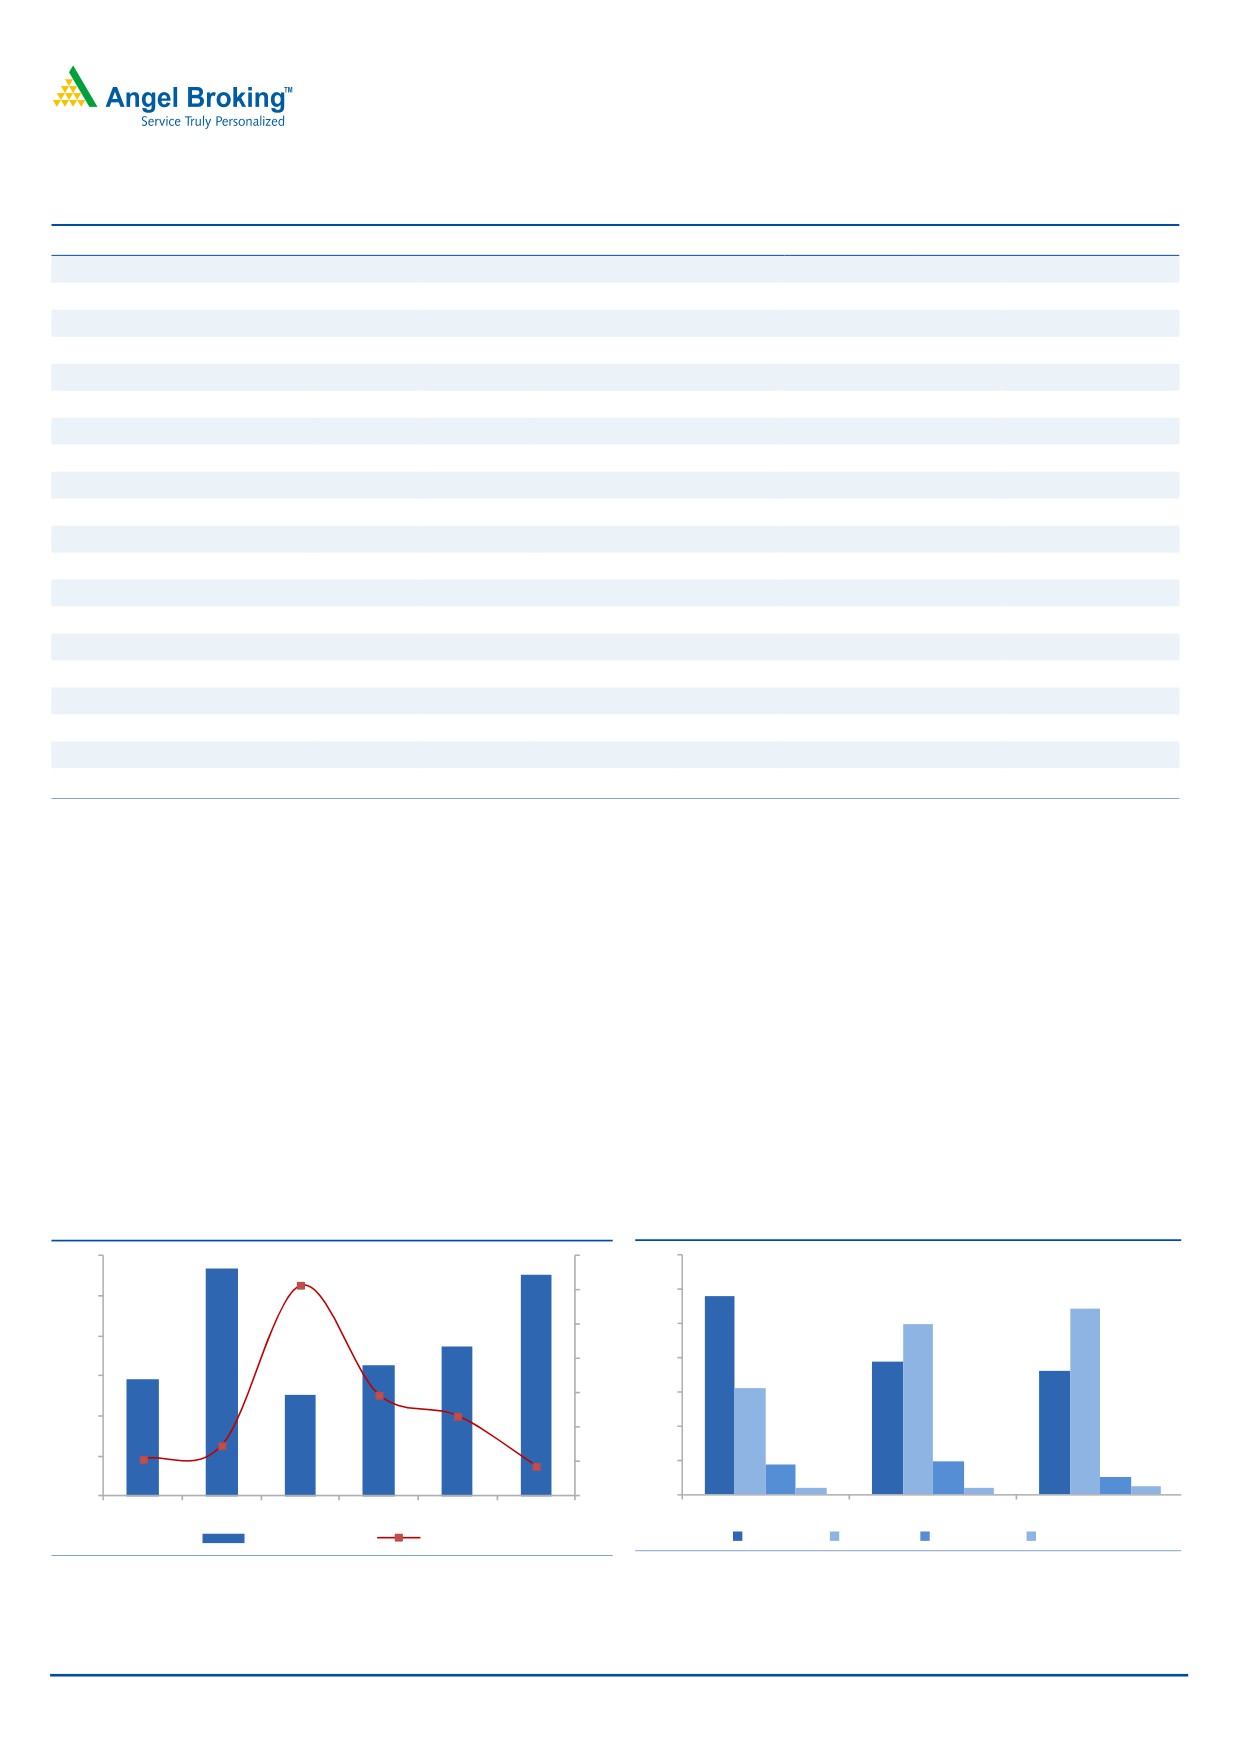
Standalone business performance
Revenues grow 26.6% yoy
Wabag reported 2.6% yoy decline in its revenues for the quarter to `553cr, which
is below our expectations. Decline in the yoy revenues is mainly attributable to (1)
39.3% yoy decline in EPC- Municipal segment business (36.2% of 4QFY2016
revenues) and (2) 46.1% yoy decline in O&M- Municipal segment business (5.0%
of 4QFY2016 revenues). The following 3 projects contributed 29.8% to the
4QFY2016 standalone revenues, (1) APGENCO project (`117.5cr), (2) 147 MLD
WTP project at Habra, West Bengal (`29.2cr), and (3) 100 MLD Desal. plant-
O&M works at Nemmeli, Chennai (`18.1cr).
Exhibit 2: Revenues decline 2.6% yoy
Exhibit 3: EPC-Industrial contributes highest share
600
120
70
568
553
58.1
100
60
54.4
500
102.8
49.8
80
50
371
400
325
38.9
60
40
36.2
293
300
254
31.0
40
30
200
38.8
20
20
26.6
8.9
9.6
100
0
10
5.0
9.5
1.9
1.7
2.5
1.5
(2.6)
0
(20)
0
3QFY2015 4QFY2015 1QFY2016 2QFY2016 3QFY2016 4QFY2016
4QFY2015
3QFY2016
4QFY2016
Revenues (` cr)
yoy growth (%)
EPC- Mun.
EPC- Ind.
O&M- Mun.
O&M- Ind.
Source: Company, Angel Research
Source: Company, Angel Research
June 1, 2016
2
VA Tech Wabag | 4QFY2016 Result Update
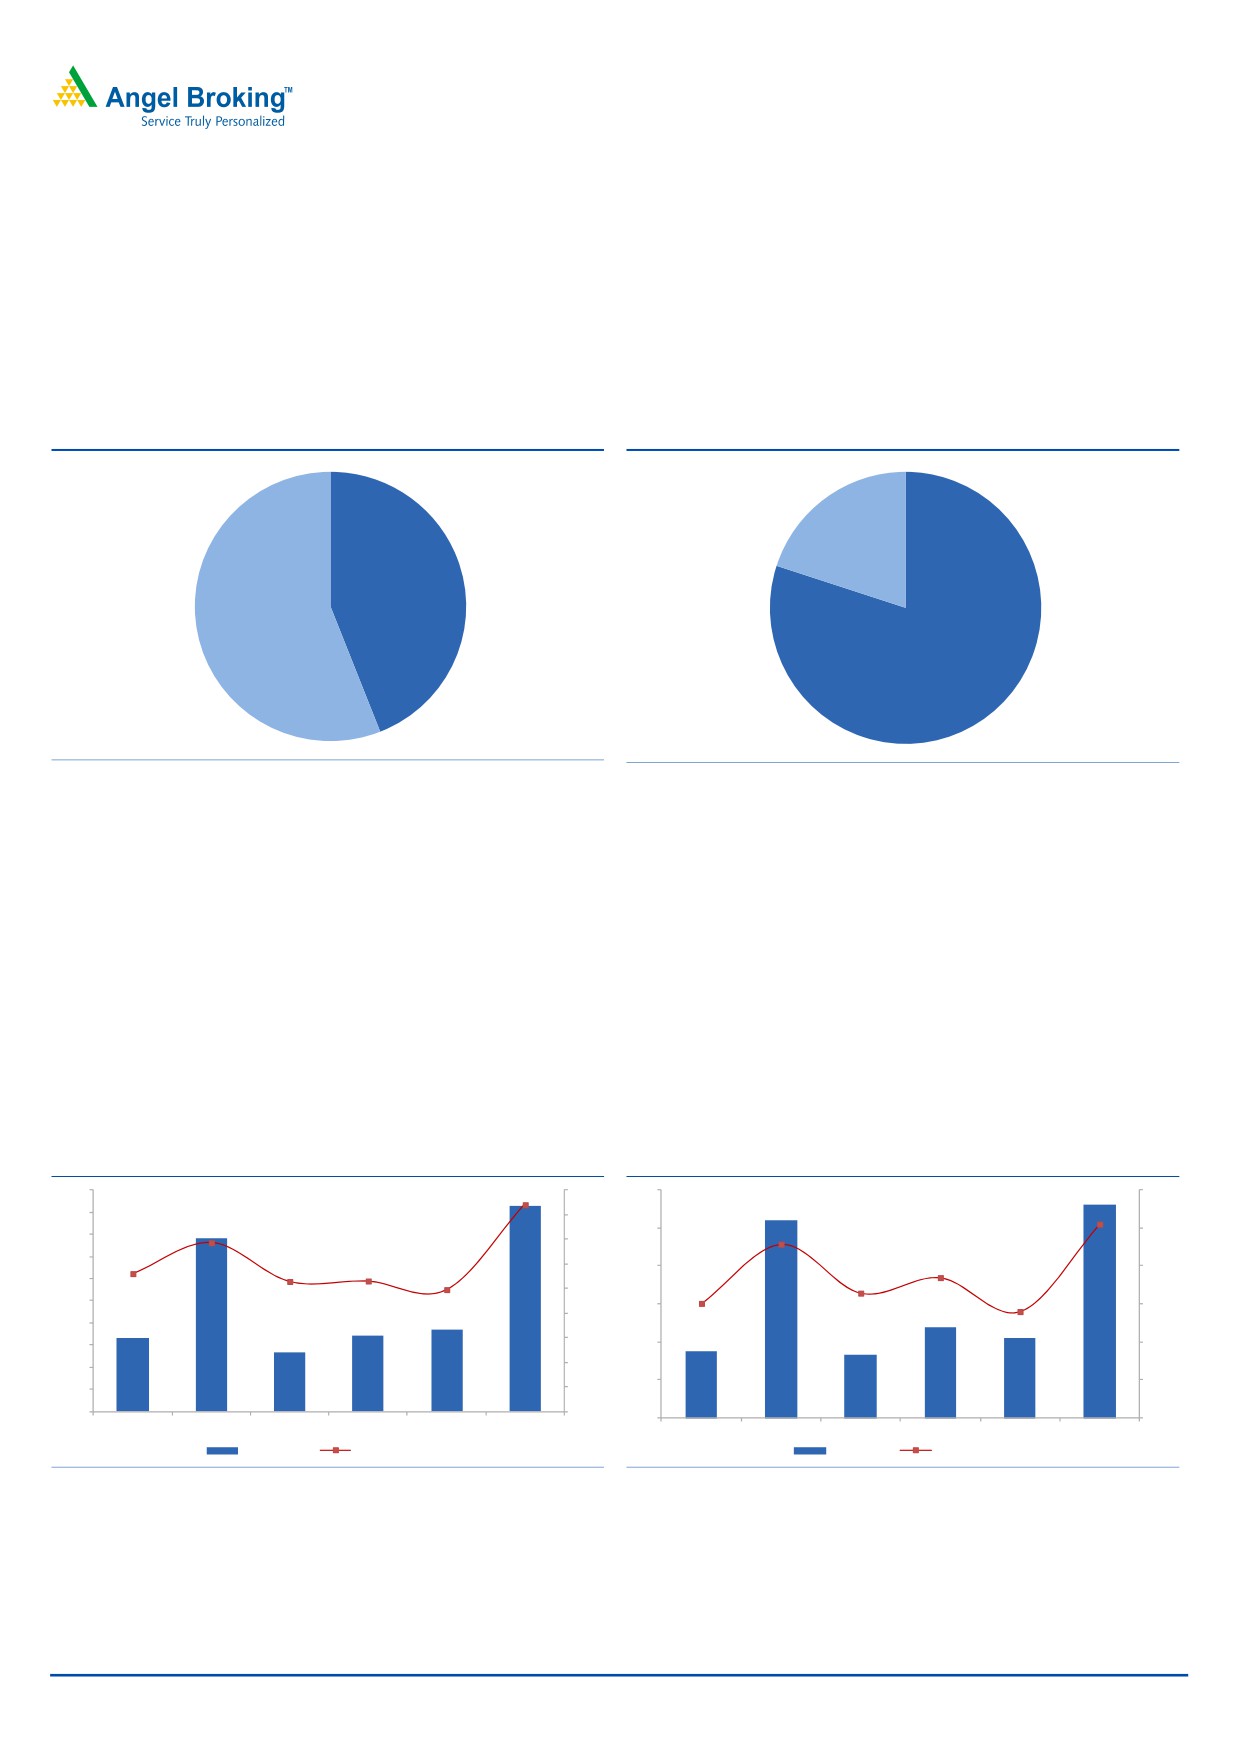
For the full year, Wabag reported 23.2% yoy increase in revenues led by strong
revenue booking seen across the (1) APGENCO project (`398.3cr), (2) 147 MLD
WTP project at Habra, West Bengal (`86.4cr), and (3) 100 MLD Desal. plant-
O&M works at Nemmeli, Chennai (`63.8cr). If we look at the business segments,
then the Industrial EPC segment (31.2% of FY2016 revenues) reported a 135.0%
yoy increase in revenues.
Exhibit 4: Business-wise FY2016 Revenue split
Exhibit 5: Vertical-wise FY2016 Revenue split
O&M, 20.0
Municipal,
44.0
Industrial,
56.0
EPC, 80.0
Source: Company, Angel Research
Source: Company, Angel Research
EBITDA margin expands yoy to 16.8%
Wabag reported 19.2% yoy increase in EBITDA to `93cr, while EBITDA margin
expanded 306bp yoy to 16.8% in 4QFY2016. EBITDA margin expansion was
restricted on account of 22.5% increase in employee expenses. Such increase in
employee expenses is attributable to incentive payments made to employees for
FY2015 and FY2016. On normalizing the impact of such incentive payments,
employee expenses would have remained flat on a yoy basis.
For FY2016, EBITDA margins expanded 186bp yoy to 13.0%, benefitting from
4.5% decline in other expenses to `59cr.
Exhibit 6: EBITDA margins expand yoy to 16.8%
Exhibit 7: PAT margins also expand to 10.2%
100
18.0
60
12.0
90
16.0
16.8
50
10.0
80
14.0
10.2
70
13.7
9.1
12.0
40
8.0
60
11.2
10.0
7.4
50
10.6
10.6
9.9
30
6.0
8.0
6.6
40
6.0
5.6
30
6.0
20
4.0
20
4.0
10
2.0
10
2.0
33
78
27
34
37
93
18
52
17
24
21
56
0
0.0
0
0.0
3QFY2015
4QFY2015
1QFY2016
2QFY2016
3QFY2016
4QFY2016
3QFY2015
4QFY2015
1QFY2016
2QFY2016
3QFY2016
4QFY2016
EBITDA (` cr)
EBITDA margin (%)
PAT (` cr)
PAT Margin (%)
Source: Company, Angel Research
Source: Company, Angel Research
PAT margin expand yoy to 10.2%
In-line with the EBITDA margin, PAT margins expanded from 9.1% in 4QFY2015
to 10.2% in 4QFY2016. EBITDA margin expansion coupled with 10.0% yoy decline
in depreciation expenses (to `3cr) led to PAT margin expansion.
June 1, 2016
3
VA Tech Wabag | 4QFY2016 Result Update
For FY2016, Wabag reported 40bp yoy PAT margin expansion to 7.8%. Entire
benefits of yoy EBITDA margin expansion have not flown down to the PAT level, as
(1) interest expenses increased sharply to `15cr, and (2) tax rate increased from to
34.2% in FY2016 from 33.5% in FY2015.
Update on Subsidiaries’ performance
The company’s international subsidiaries’ revenues declined 10.4% on a yoy basis
to `303cr, which is attributable to
(1)
7% Euro depreciation, (2) some of the
projects being at early stages of execution and not contributing to revenues, and
(3) delays in the Egyptian and Saudi Arabian projects (mainly owing to engineering
issues; expected to start contributing to revenues in the next 2 quarters). If we look
at 4QFY2016 revenue composition from international subsidiaries, then
(1)
Petronas, Malaysia contributed
`82.3cr,
(2) DAWASA, Tanzania contributed
`39.4cr, and (3) O&M, Istanbul project contributed `37.0cr. Notably, EPC-
Municipal segment reported 4.1% yoy decline in revenues to `182.1cr (60.1% of
4QFY2016 revenues).
For FY2016, subsidiaries reported 14.0% yoy revenue decline to `1,039cr, as
there were delays in international projects on account of engineering issues.
The EBITDA margins of the international business declined yoy owing to 13.6% increase
in employee expenses. Other expenses during the quarter declined as no more
provisions related to the Gubrah project were made (as had been made in the earlier
quarters). A poor operating performance coupled with higher tax rate led to losses at the
international business.
For FY2016, the EBITDA declined owing to higher other expenses. A poor
operating performance, higher interest expenses coupled with higher tax expenses
led to higher losses in FY2016.
June 1, 2016
4
VA Tech Wabag | 4QFY2016 Result Update
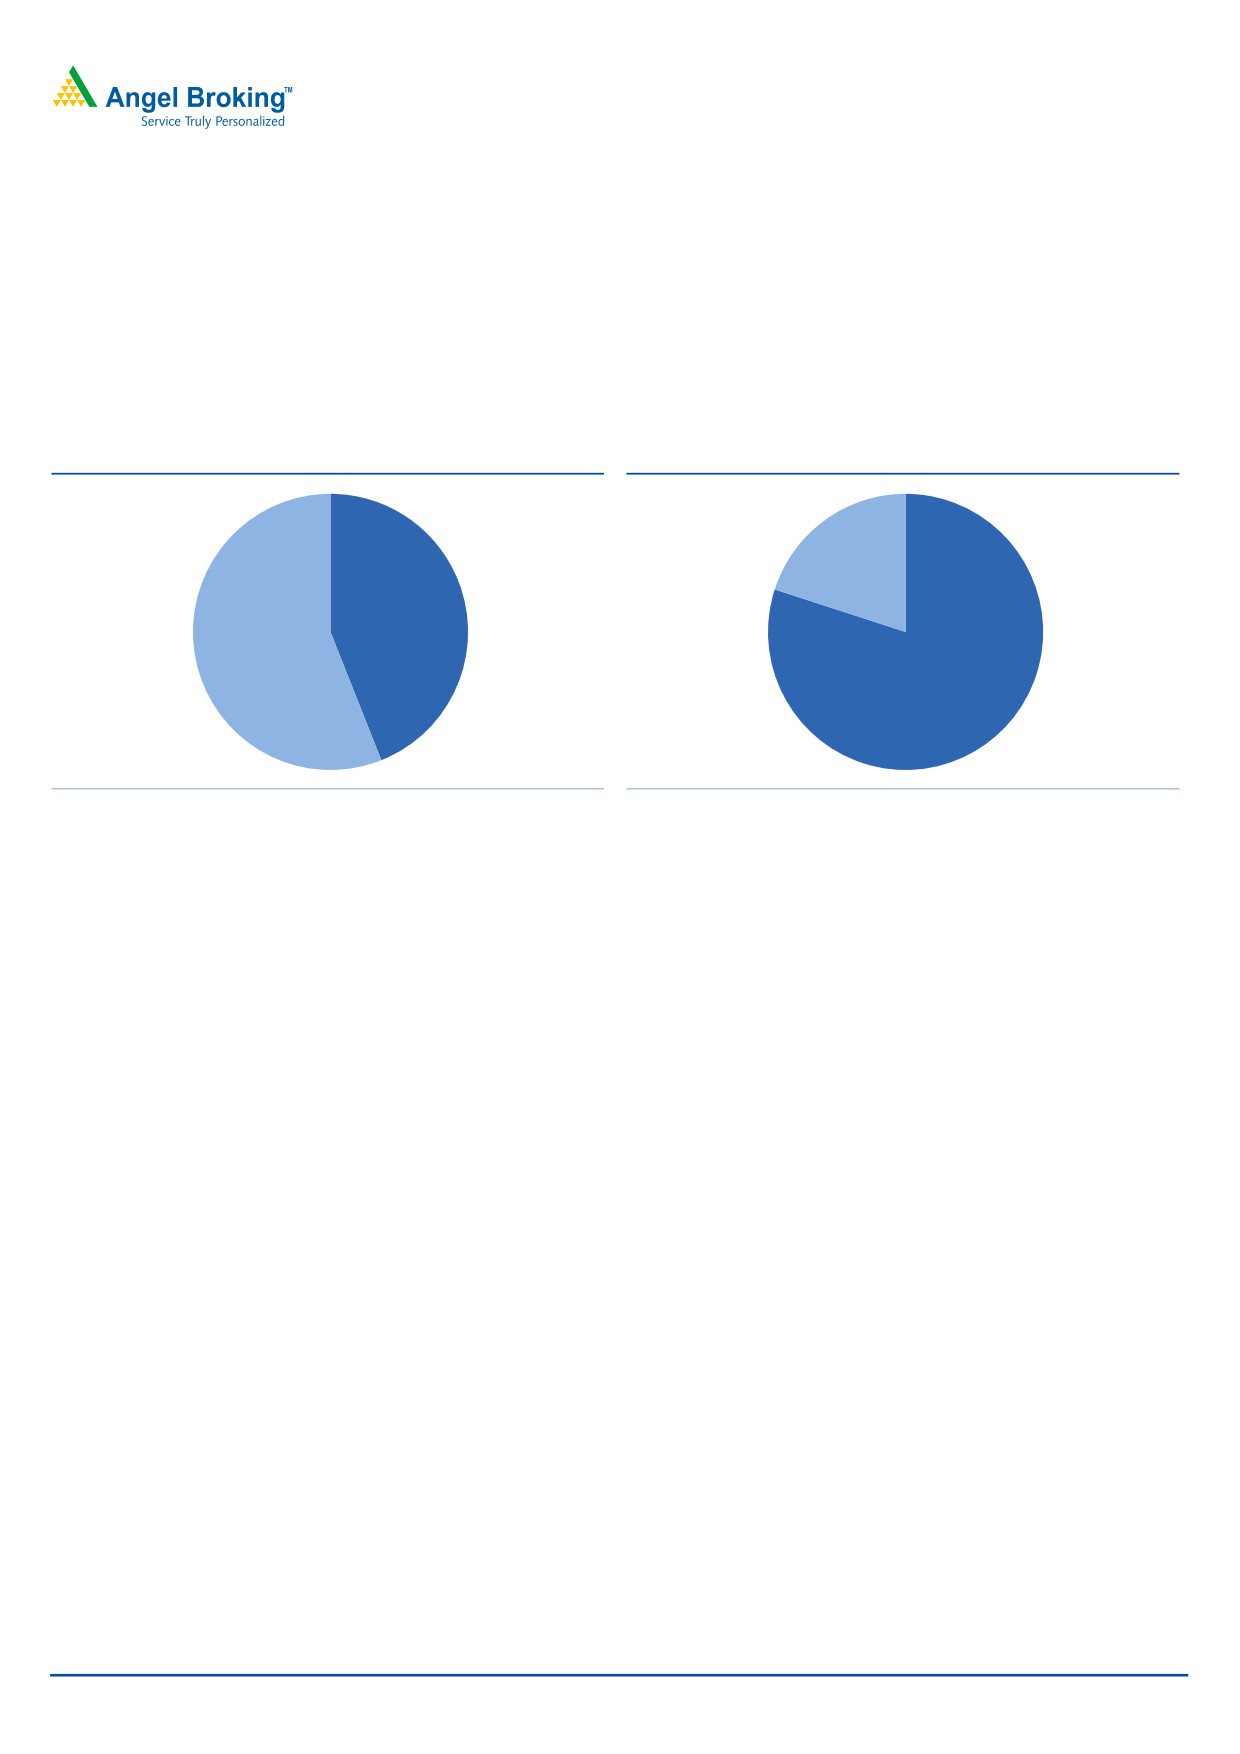
`1,784cr of Order Inflows in 4QFY2016
Wabag reported `1,784cr of order wins in 4QFY2016, which is up 17.2% yoy. The
company reported key order wins from Polgahawela WTP (`734cr) and Chennai
TTP (`594cr). The company has already won `500cr of projects year-to-date
FY2017 (waste water treatment project at Nepal, Reliance waste water treatment
plant at Jamnagar, and Czech waste water treatment plant). For FY2016 Wabag
reported highest ever yearly order inflows of `5,140cr.
Exhibit 8: Business-wise FY2016 Order Inflows split
Exhibit 9: Vertical-wise FY2016 Order Inflows split
O&M, 20.0
Municipal,
44.0
Industrial,
56.0
EPC, 80.0
Source: Company, Angel Research
Source: Company, Angel Research
Order book as of 4QFY2016-end stood at `8,315cr, reflecting Order book / last
twelve month (LTM) sales ratio of 3.3x.
Management Guidance & Concall Updates
For FY2017, the company’s Management maintained its order inflow guidance of
`4,000-4,200cr (down 18-22% to reported order inflows of FY2016).
Wabag’s Management has given a revenue guidance of `3,000-3,200cr for
FY2017E (up 18-26% from FY2016 reported revenues).
The Management highlighted that it expects to see reasonable improvement in the
FY2017 EBITDA margins from the 8.6% levels reported in FY2016.
Update on some of the projects: (1) Basic engineering works have been approved
at Bahrain Suez project. Civil works have already started. Ordering of the key
equipments is at advanced stages. (2) The Dangote project is at final stages of
engineering and major dispatches are expected to be done in FY2017E. (3) Oman
desalinization plant has been handed over to the client. For past 30 continuous
days, trial/reliability runs are ongoing. Arbitration discussions are ongoing, which
are expected to complete in the next 1 quarter. (4) For AP Genco project, boiler
testing is done, turbine generator is erected, conveyor handling systems have been
started, and the company is on track to finish the project in FY2017. Currently no
profits are being taken up from the project; post hand-over, once no risks are
attached, then profits would be taken up.
June 1, 2016
5
VA Tech Wabag | 4QFY2016 Result Update
Investment arguments
Strong market positioning: Wabag in our view has a strong portfolio of offerings in
the water treatment/ waste water/ desalination space. Unlike most of the domestic
EPC players, Wabag has a differentiated business model, given its in-house
technology. Strong technological know-how coupled with large talent positions it to
successfully execute complex water projects.
Asset-light business model drives RoEs: Wabag pursues an asset-light business
model. Its strategy of keeping core areas of work in-house and outsourcing the
non-critical, low-value work helps it maintain high RoEs. Also, it takes on large
volume projects, thereby enabling it to generate high RoEs.
India & Emerging markets hold huge opportunity: India has low per capita water
supply vis-a-vis developed nations, indicating huge growth potential for the
company’s business. Also, with rising stringency in norms for waste water
treatment, scope for Wabag is huge, given that ~30% of industrial waste water is
not treated. Wabag has made strong in-roads in emerging markets like
Philippines, China, Saudi Arabia, Egypt, Spain and Turkey.
Risks & Concerns
Delays in revival of international business could impact our margin
assumptions.
Any significant loss of market share could be a risk to our assumptions.
Execution delays in the domestic markets could be a risk to our assumptions.
Valuation
At CMP of `675, VA Tech Wabag stock trades at FY2017E/2018E P/E multiple of
22.1x/16.0x. Recently Wabag reported large ticket order wins from the Middle
East and Asian sub-continent (worth `2,862cr), which tend to have a better margin
profile than orders executed in Europe. These order wins have now taken the order
book to the highs of `8,315cr, reflecting OB/LTM ratio at 3.3x. With better revenue
visibility, declining contribution of low margin projects, we now expect VA Tech
Wabag to report 23.0% top-line and 45.6% bottom-line CAGR during FY2016-
18E, respectively. On the back of such strong earnings growth, we expect the RoEs
of the company to expand from 9.7% in FY2016 to 15.9% in FY2018E. Given the
strong earnings growth and RoE expansion potential, we assign 19.0x P/E multiple
to our FY2018E EPS of `35.9 to arrive at a price target of `681. Given the 18.5%
upside, we upgrade our recommendation on the stock to BUY.
June 1, 2016
6
VA Tech Wabag | 4QFY2016 Result Update
Company background
VA Tech Wabag is a multinational player in the water treatment industry with
presence across India, Middle East, North Africa, Central and Eastern Europe,
China and South East Asia. Wabag offers an entire range of solutions including
conceptualisation, design, engineering, procurement, supply, installation,
construction and O&M (operational and maintenance) services. The company also
provides range of EPC and O&M solutions for sewage treatment, processed &
drinking water treatment, effluents treatment, sludge treatment, desalination and
reuse for institutional clients like municipal corporations and companies in the
infrastructure sector.
June 1, 2016
7
VA Tech Wabag | 4QFY2016 Result Update
Profit & Loss (Consolidated)
Y/E March (` cr)
FY13
FY14
FY15
FY16
FY17E
FY18E
Net Sales
1,619
2,239
2,435
2,542
3,136
3,845
% Chg
12.1
38.3
8.8
4.4
23.3
22.6
Total Expenditure
1,464
2,050
2,226
2,324
2,858
3,493
Cost of sales & services
1,165
1,689
1,848
2,038
2,355
2,919
Changes in inventory
10
9
(15)
(49)
8
(9)
Employee benefits Expense
209
222
278
218
346
418
Other Expenses
80
130
115
117
149
165
EBITDA
155
189
209
218
278
352
% Chg
19.1
21.7
11.1
4.1
27.3
26.7
EBIDTA %
9.6
8.4
8.6
8.6
8.9
9.1
Depreciation
11
15
11
21
23
26
EBIT
144
173
199
198
254
326
% Chg
18.5
20.5
14.4
(0.5)
28.7
28.1
Interest and Financial Charges
22
25
39
42
49
42
Other Income
13
13
8
7
7
9
EBT & exceptional items
135
161
167
162
213
293
Exceptional Items
0
5
0
0
0
0
EBT
135
166
167
162
213
293
Tax Expenses
46
53
57
69
71
98
% of PBT
33.7
32.6
33.9
42.6
33.3
33.3
EAT before share of Profit in asso.
90
114
110
93
142
196
Share of profit in Associate
1
1
2
1
2
2
PAT before Minority Interest
90
114
112
94
144
197
Minority Interest
0
1
2
2
2
2
PAT
90
113
110
92
142
195
% Chg
22.5
25.5
(2.9)
(16.3)
53.9
37.7
PAT %
5.6
5.1
4.5
3.6
4.5
5.1
Diluted EPS
33.8
42.1
20.2
16.9
26.0
35.9
% Chg
21.2
24.8
(52.1)
(16.3)
53.9
37.7
June 1, 2016
8
VA Tech Wabag | 4QFY2016 Result Update
Balance Sheet (Consolidated)
Y/E March (` cr)
FY13
FY14
FY15
FY16E FY17E FY18E
Sources of Funds
Equity Capital
5
5
11
11
11
11
Reserves & Surplus
710
836
892
981
1,123
1,318
Networth
715
841
903
992
1,134
1,329
Total Debt
82
158
181
377
342
315
Minority Interest & Share
2
3
5
8
10
12
appl. pending allot.
Other Long-term Liabilities & Prov.
112
182
242
172
275
295
Total Liabilities
912
1,185
1,331
1,550
1,761
1,951
Application of Funds
Gross Block
107
175
252
259
284
315
Accumulated Depreciation
56
56
61
81
105
131
Net Block
51
119
191
178
180
185
Cap. WIP & Intan.
48
69
1
0
0
0
Assets underDevelop.
Investments
3
23
38
28
28
28
Current Assets
Inventories
41
35
47
98
69
74
Sundry Debtors
1,109
1,387
1,481
1,768
1,976
2,412
Cash and Bank Balance
287
370
311
358
628
690
Loans & Advances
116
100
116
125
129
127
Other Current Asset
225
320
361
444
375
395
Current Liabilities
979
1,251
1,237
1,457
1,658
2,002
Net Current Assets
798
962
1,078
1,336
1,519
1,697
Other Assets
11
11
23
8
35
42
Total Assets
912
1,185
1,331
1,550
1,761
1,951
June 1, 2016
9
VA Tech Wabag | 4QFY2016 Result Update
Cash Flow Statement
Y/E March (` cr)
FY13
FY14
FY15
FY16E FY17E FY18E
Profit before tax
135
161
167
162
213
293
Depreciation & Other Non-cash Chrg.
89
85
135
132
136
87
Change in Working Capital
(115)
(84)
(257)
(321)
87
(116)
Interest & Financial Charges
7
7
15
15
17
15
Direct taxes paid
(34)
(57)
(55)
(69)
(71)
(98)
Cash Flow from Operations
82
112
6
(82)
382
181
(Inc)/ Dec in Fixed Assets
(41)
(103)
(28)
(7)
(25)
(31)
(Inc)/ Dec in Investments & Oth. Adj.
1
5
(39)
0
0
0
Cash Flow from Investing
(40)
(97)
(68)
(7)
(25)
(31)
Issue/ (Buy Back) of Equity
3
1
20
0
0
0
Inc./ (Dec.) in Borrowings
(43)
76
22
197
(35)
(27)
Dividend Paid (Incl. Tax)
(19)
(22)
(25)
(22)
(33)
(46)
Interest Expenses & Oth. Adj.
(7)
(8)
(15)
(15)
(17)
(15)
Cash Flow from Financing
(65)
48
2
160
(85)
(88)
Inc./(Dec.) in Cash & forex translation
(21)
86
(91)
72
272
62
Opening Cash balances
265
244
330
240
312
583
Closing Cash balances
244
330
240
312
583
645
June 1, 2016
10
VA Tech Wabag | 4QFY2016 Result Update
Ratio Analysis (x)
Y/E March
FY13
FY14
FY15
FY16E FY17E FY18E
Valuation Ratio (x)
Adj. P/E (on FDEPS)
17.0
13.6
28.5
34.0
22.1
16.0
Adj. P/CEPS
15.1
11.9
25.8
27.8
19.0
14.2
Dividend yield (%)
1.0
1.2
0.7
0.7
0.9
1.1
EV/Sales
0.8
0.6
1.2
1.2
0.9
0.7
EV/EBITDA
8.5
7.0
14.3
14.5
10.3
7.8
EV / Total Assets
1.5
1.1
2.2
2.0
1.6
1.4
Per Share Data (`)
Adj. EPS (fully diluted)
33.8
42.1
20.2
16.9
26.0
35.9
Cash EPS
38.1
48.3
22.3
20.7
30.3
40.6
DPS
6.0
7.0
4.0
3.9
4.9
6.2
Book Value
269
316
166
182
208
244
Returns (%)
RoCE (Pre-tax)
20.1
20.6
22.0
19.9
22.4
24.5
Angel RoIC (Pre-tax)
14.1
13.3
12.0
10.0
11.7
14.5
RoE
12.6
14.6
12.6
9.7
13.4
15.9
Turnover ratios (x)
Asset Turnover (Gross Block) (x)
1.8
1.9
1.8
1.6
1.8
2.0
Inventory / Sales (days)
9
6
7
8
8
7
Receivables (days)
250
226
222
228
230
229
Payables (days)
221
204
185
195
193
190
WC (days)
39
28
44
41
45
46
Leverage Ratios (x)
D/E ratio (x)
0.1
0.2
0.2
0.4
0.3
0.2
Note: nmf- Not Meaningful
June 1, 2016
11
VA Tech Wabag | 4QFY2016 Result Update
Research Team Tel: 022 - 39357800
DISCLAIMER
Angel Broking Private Limited (hereinafter referred to as “Angel”) is a registered Member of National Stock Exchange of India Limited,
Bombay Stock Exchange Limited and MCX Stock Exchange Limited. It is also registered as a Depository Participant with CDSL and
Portfolio Manager with SEBI. It also has registration with AMFI as a Mutual Fund Distributor. Angel Broking Private Limited is a
registered entity with SEBI for Research Analyst in terms of SEBI (Research Analyst) Regulations, 2014 vide registration number
INH000000164. Angel or its associates has not been debarred/ suspended by SEBI or any other regulatory authority for accessing
/dealing in securities Market. Angel or its associates including its relatives/analyst do not hold any financial interest/beneficial
ownership of more than 1% in the company covered by Analyst. Angel or its associates/analyst has not received any compensation /
managed or co-managed public offering of securities of the company covered by Analyst during the past twelve months. Angel/analyst
has not served as an officer, director or employee of company covered by Analyst and has not been engaged in market making activity
of the company covered by Analyst.
This document is solely for the personal information of the recipient, and must not be singularly used as the basis of any investment
decision. Nothing in this document should be construed as investment or financial advice. Each recipient of this document should
make such investigations as they deem necessary to arrive at an independent evaluation of an investment in the securities of the
companies referred to in this document (including the merits and risks involved), and should consult their own advisors to determine
the merits and risks of such an investment.
Reports based on technical and derivative analysis center on studying charts of a stock's price movement, outstanding positions and
trading volume, as opposed to focusing on a company's fundamentals and, as such, may not match with a report on a company's
fundamentals.
The information in this document has been printed on the basis of publicly available information, internal data and other reliable
sources believed to be true, but we do not represent that it is accurate or complete and it should not be relied on as such, as this
document is for general guidance only. Angel Broking Pvt. Limited or any of its affiliates/ group companies shall not be in any way
responsible for any loss or damage that may arise to any person from any inadvertent error in the information contained in this report.
Angel Broking Pvt. Limited has not independently verified all the information contained within this document. Accordingly, we cannot
testify, nor make any representation or warranty, express or implied, to the accuracy, contents or data contained within this document.
While Angel Broking Pvt. Limited endeavors to update on a reasonable basis the information discussed in this material, there may be
regulatory, compliance, or other reasons that prevent us from doing so.
This document is being supplied to you solely for your information, and its contents, information or data may not be reproduced,
redistributed or passed on, directly or indirectly.
Neither Angel Broking Pvt. Limited, nor its directors, employees or affiliates shall be liable for any loss or damage that may arise from
or in connection with the use of this information.
Note: Please refer to the important ‘Stock Holding Disclosure' report on the Angel website (Research Section). Also, please refer to the
latest update on respective stocks for the disclosure status in respect of those stocks. Angel Broking Pvt. Limited and its affiliates may
have investment positions in the stocks recommended in this report.
Disclosure of Interest Statement
VA Tech Wabag
1. Analyst ownership of the stock
No
2. Angel and its Group companies ownership of the stock
No
3. Angel and its Group companies' Directors ownership of the stock
No
4. Broking relationship with company covered
No
Note: We have not considered any Exposure below ` 1 lakh for Angel, its Group companies and Directors
Ratings (Based on expected returns
Buy (> 15%)
Accumulate (5% to 15%)
Neutral (-5 to 5%)
over 12 months investment period):
Reduce (-5% to -15%)
Sell (< -15%)
June 1, 2016
12