3QFY2016 Result Update | Capital Goods
March 18, 2016
VA Tech Wabag
NEUTRAL
CMP
`509
Performance Highlights
Target Price
-
Quarterly highlights - Standalone
Investment Period
-
Y/E March (` cr)
3QFY16 3QFY15 2QFY16
% chg (yoy)
% chg (qoq)
Stock Info
Net sales
371
293
325
26.6
14.4
Sector
Capital Goods
EBITDA
37
33
34
11.7
6.4
Market Cap (` cr)
2,771
Reported PAT
21
18
24
17.0
(13.4)
Net debt (` cr)
(131)
Source: Company, Angel Research;
Beta
1.1
VaTech Wabag (Wabag) reported a 26.6% yoy increase in sales to `371cr in
52 Week High / Low
957/409
3QFY2016, reflecting strong execution across its AP Genco project. The EBITDA
Avg. Daily Volume
141,944
for the quarter grew 11.7% yoy to `37cr. The EBITDA margin declined 132bp yoy
Face Value (`)
2
to 9.9%, owing to a sharp increase in other expenses to `22cr (vs `5cr in
BSE Sensex
24,953
3QFY2015). In-line with the EBITDA margin, the PAT margin declined from 6.0%
Nifty
7,604
in the corresponding quarter of the previous year to 5.6% in 3QFY2016.
Reuters Code
VATE.BO
International revenues declined 20.8% yoy to `258cr, on account of (1) Euro
Bloomberg Code
VATW@IN
depreciation, (2) some of the projects being at early stages of execution and not
contributing to revenues (inclusive of Nepal based projects), and (3) lower
Shareholding Pattern (%)
revenue from Al Gubrah project (nearing completion). A poor operating
Promoters
29.0
performance coupled with higher interest expenses (at `5.5cr) led to international
MF / Banks / Indian Fls
25.0
business losses.
FII / NRIs / OCBs
27.4
The order book as of 3QFY2016-end stood at `7,952cr, reflecting Order book /
Indian Public / Others
18.7
last twelve month (LTM) sales ratio of 3.1x.
Valuation: The stock trades at FY2017E/2018E P/E multiple of 26.1x/20.7x,
Abs. (%)
3m 1yr 3yr
which continues to be at the higher end of the historical band. On considering
Sensex
(3.0)
(44.2)
145.0
the 25% correction in the stock price in the last 3 months period, valuations in
Wabag
(25.8)
(12.4)
34.3
our view still do not factor in the muted order inflow environment, modest
earnings growth, and stretched working capital cycle. We assign a 20.0x P/E
multiple to our FY2017E EPS of `25 to arrive at a price target of `492. Given the
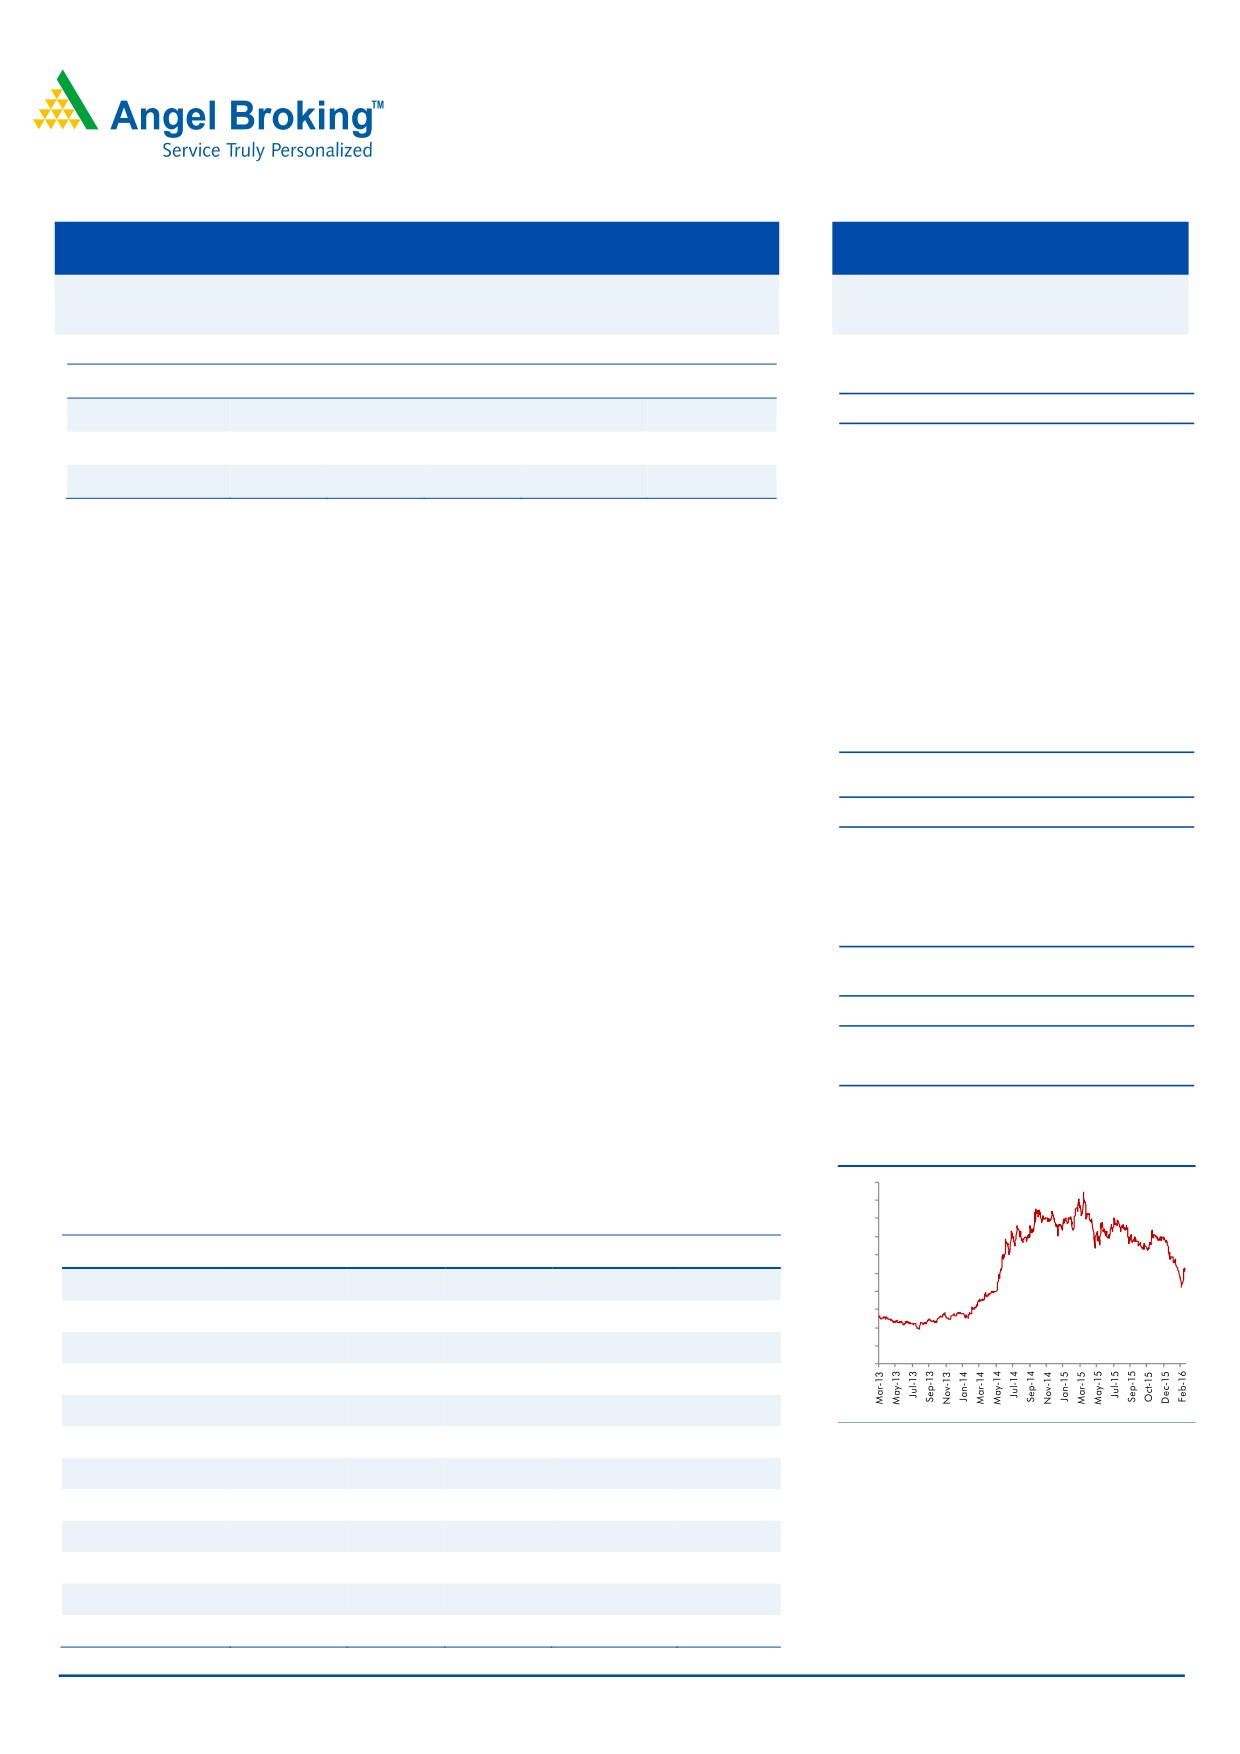
3-Year Daily Price Chart
limited upside potential, we recommend a Neutral rating on the stock.
1000
900
800
Key financials (Standalone)
700
Y/E March (` cr)
FY13
FY14
FY15
FY16E
FY17E
600
500
Net Sales
1,619
2,239
2,435
2,722
3,336
400
300
% chg
12.1
38.3
8.8
11.8
22.5
200
100
Net Profit
90
114
112
107
135
0
% chg
22.5
25.5
(2.9)
(3.8)
26.2
EBITDA (%)
9.6
8.4
8.6
7.9
8.1
EPS (`)
34
42
20
20
25
Source: Company, Angel Research
P/E (x)
15.1
12.1
25.2
26.1
20.7
P/BV (x)
1.9
1.6
3.1
2.7
2.4
RoE (%)
12.6
14.6
12.6
11.1
12.4
RoCE (%)
20.1
20.6
22.0
19.5
21.3
Yellapu Santosh
EV/Sales (x)
0.7
0.5
1.1
0.9
0.8
022 - 3935 7800 Ext: 6811
EV/EBITDA (x)
7.4
6.1
12.6
11.8
9.3
Source: Company, Angel Research; CMP as of March 18, 2016
Please refer to important disclosures at the end of this report
1
VA Tech Wabag | 3QFY2016 Result Update
Exhibit 1: Quarterly Performance (Standalone)
Particulars (` cr)
3QFY16
2QFY16
% chg (qoq) 3QFY15
% chg (yoy)
9mFY16
9mFY15
% chg
Net Sales
371
325
14.4
293
26.6
950
652
45.6
Total Expenditure
335
290
15.4
261
28.4
852
591
44.1
Cost of materials consumed
311
251
23.7
234
32.7
766
536
42.9
Change in Inventories
(22)
11
(298.7)
4
(722.3)
(38)
(46)
(16.2)
Employee benefits Expense
23
21
9.9
18
29.1
70
61
14.9
Other Expenses
22
7
231.3
5
368.3
54
40
35.9
EBITDA
37
34
6.4
33
11.7
98
61
59.7
EBIDTA %
9.9
10.6
11.2
10.3
9.4
Depreciation
3
3
(3.3)
3
(9.5)
9
4
119.3
EBIT
34
31
7.4
30
14.0
89
57
55.4
Interest and Financial Charges
5
3
38.1
2
nmf
9
5
71.6
Other Income & forex (gain)/loss
2
8
(80.0)
(1)
(327.0)
13
6
113.3
PBT before Exceptional Items
31
36
(15.6)
27
15.6
93
58
60.0
Exceptional Items
0
0
nmf
0
nmf
0
0
nmf
PBT after Exceptional Items
31
36
(15.6)
27
15.6
93
58
60.0
Tax
10
13
(20.0)
9
12.9
31
19
61.7
% of PBT
32.7
34.5
(5.1)
33.5
(2.4)
33.9
33.5
1.1
Net Profit/ (Loss) after taxes
21
24
(13.4)
18
17.0
61
38
59.1
PAT %
5.6
7.4
(24.3)
6.0
(7.5)
6.4
5.9
9.3
Dil. EPS (after extra-ord. Items)
3.79
4.38
(13.5)
3.26
16.3
11.23
7.10
58.2
Source: Company, Angel Research; Note: nmf- Not meaningful
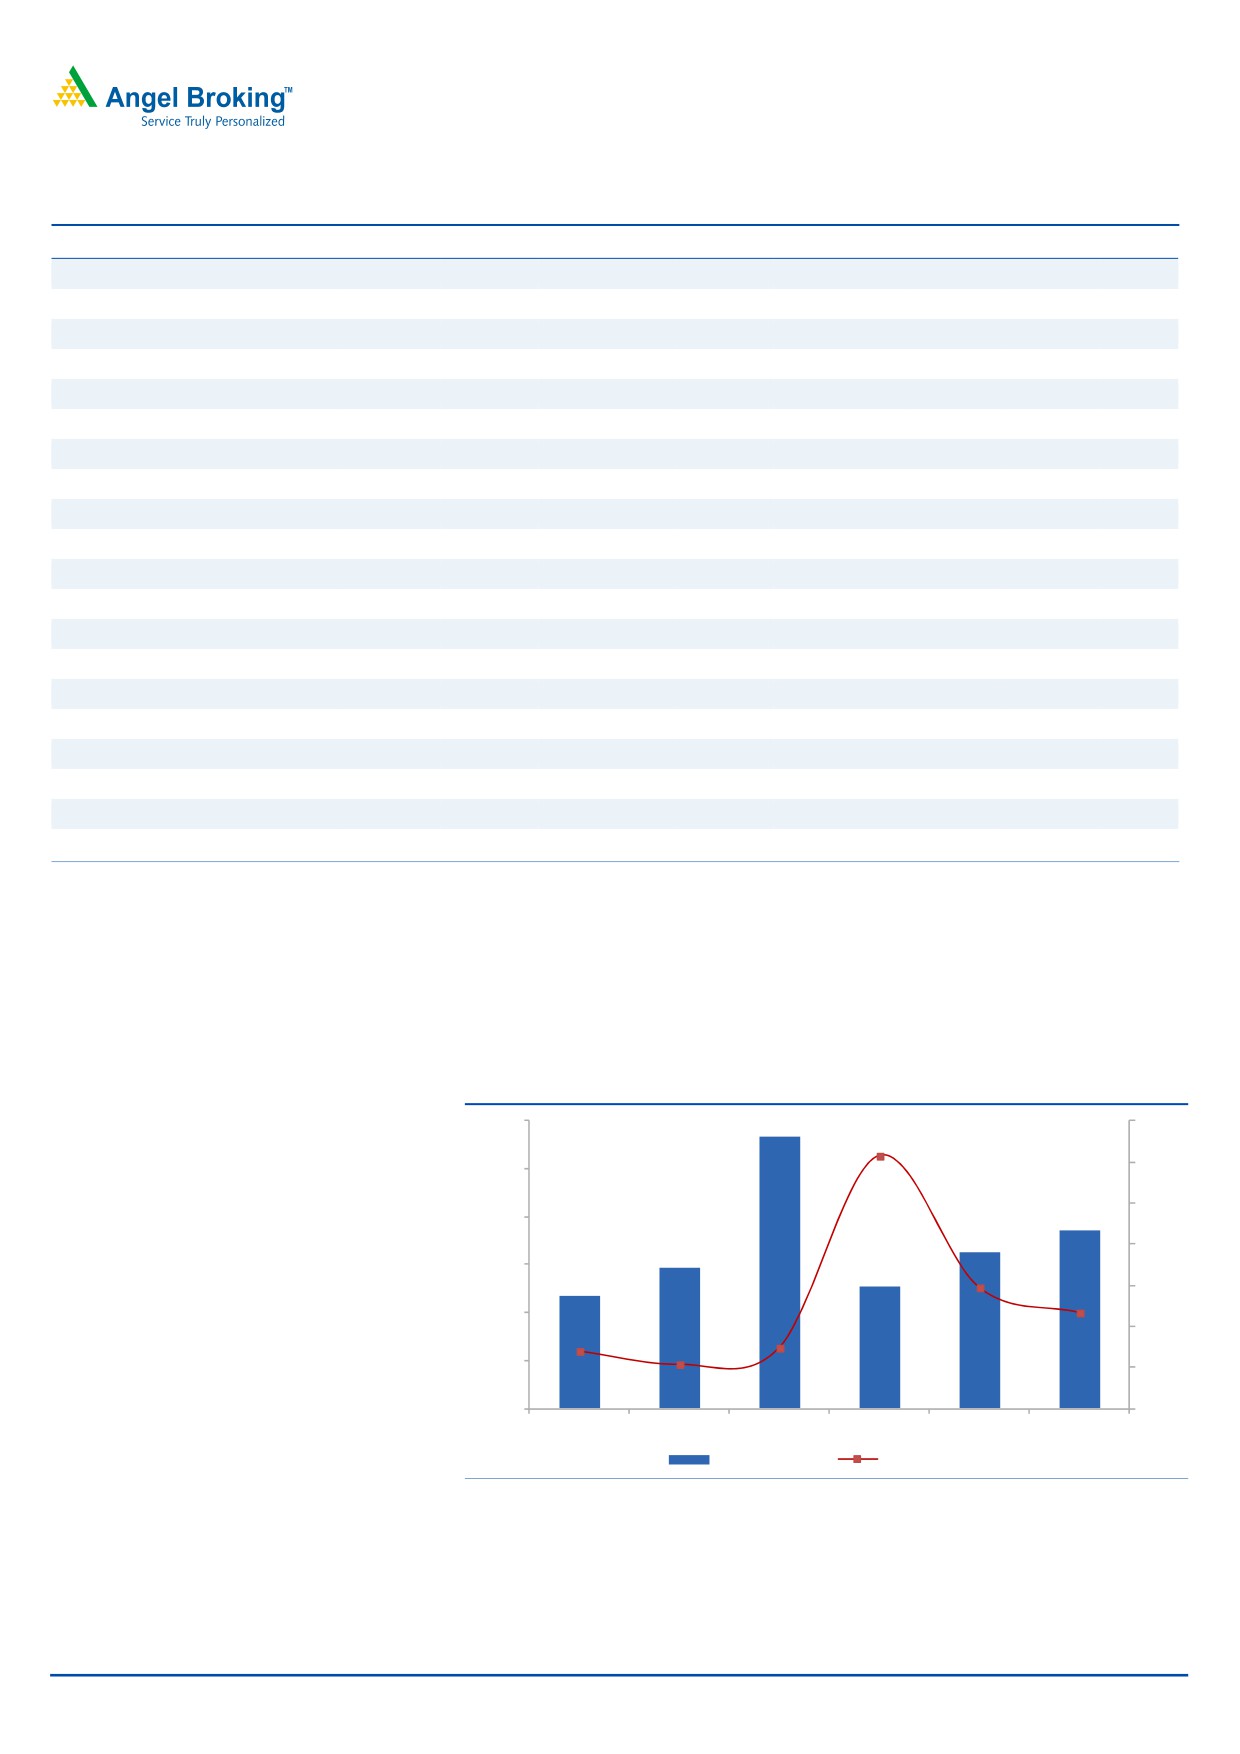
Revenues grow 26.6% yoy
VaTech Wabag reported a 26.6% yoy increase in sales to `371cr in 3QFY2016.
Revenue growth was mainly on account of strong execution seen across the AP
Genco project (has contributed `280cr to the top-line for 9MFY2016).
Exhibit 2: Quarterly revenue trend
600
568
120
100
500
102.8
80
400
371
325
60
293
300
254
234
40
200
38.8
20
26.6
100
9.5
0
7.9
1.5
0
-20
2QFY2015
3QFY2015
4QFY2015
1QFY2016
2QFY2016
3QFY2016
Revenues (` cr)
yoy growth (%)
Source: Company, Angel Research
February 18, 2015
2
VA Tech Wabag | 3QFY2016 Result Update
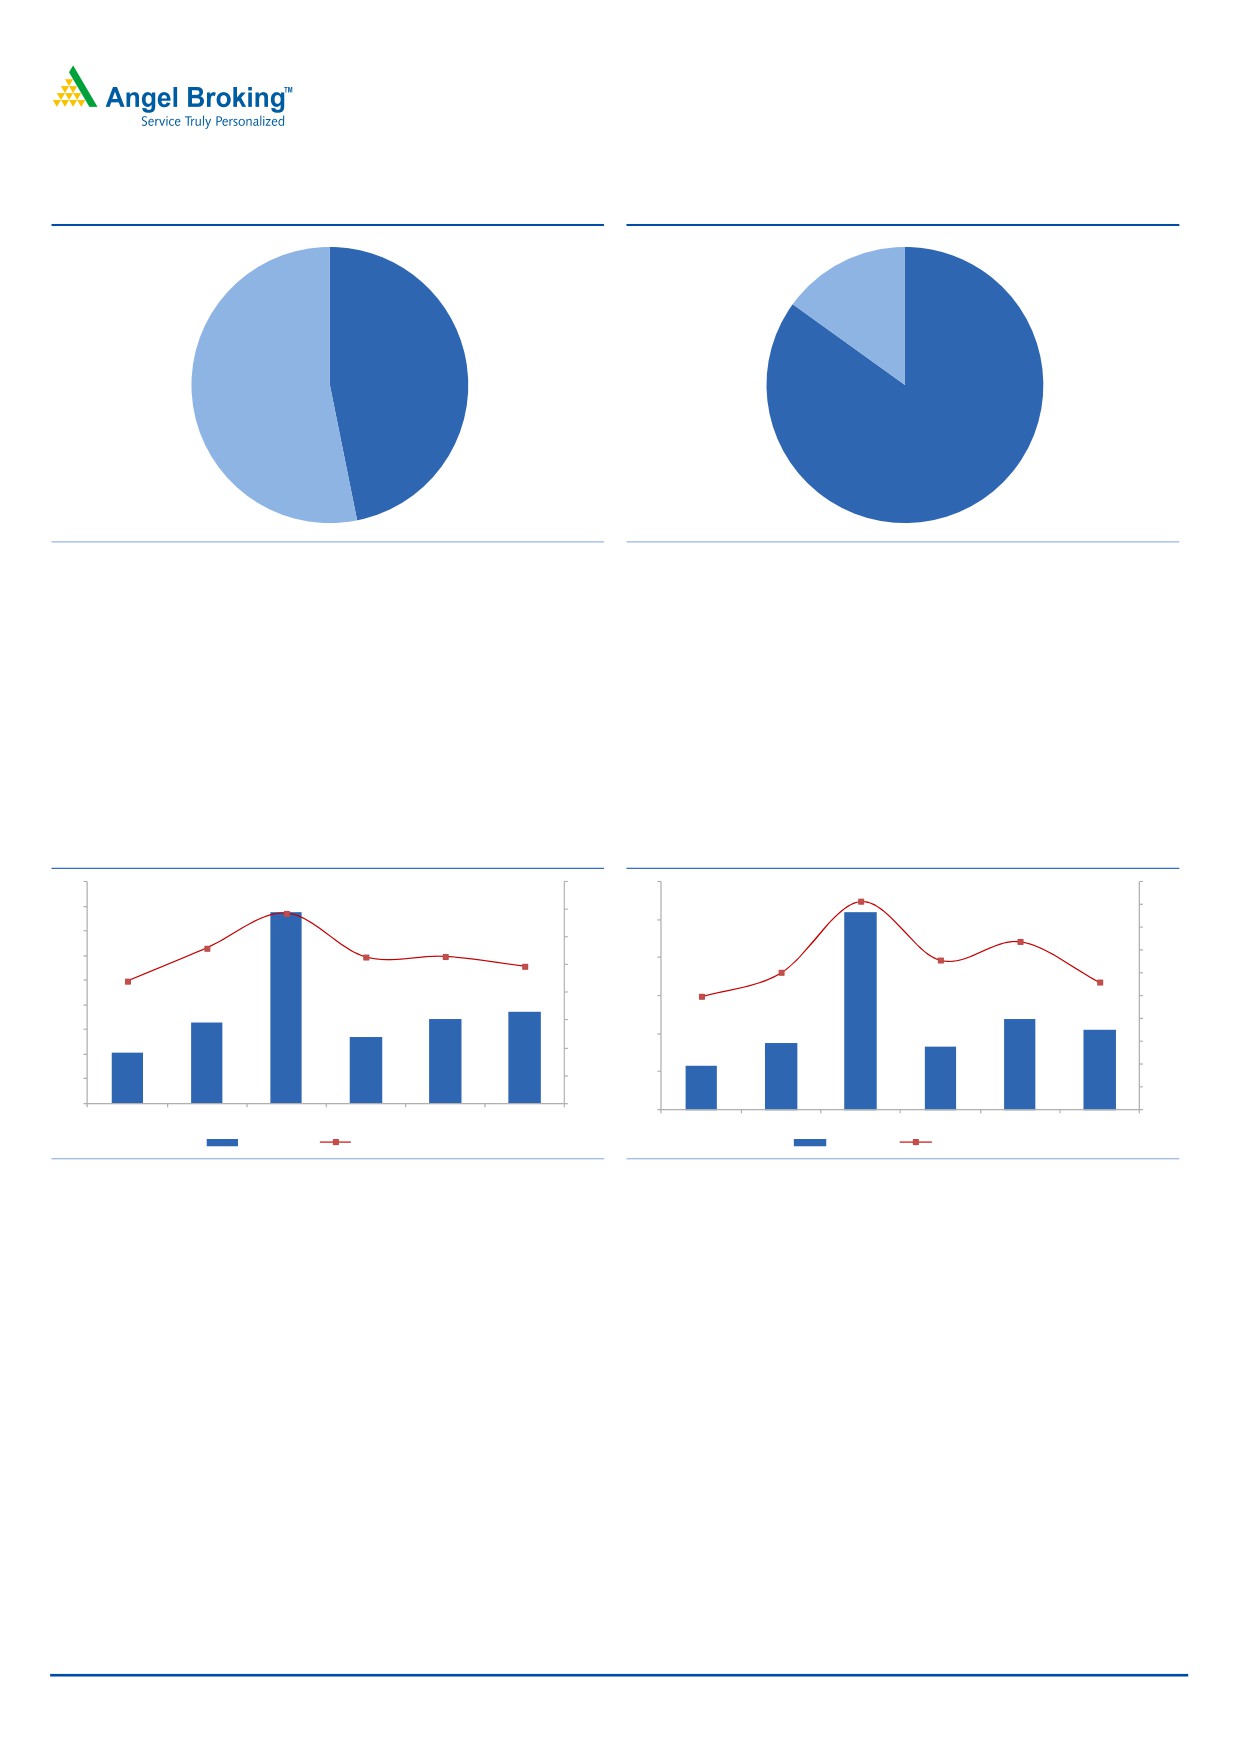
Exhibit 3: Business-wise 9MFY2016 Revenue split
Exhibit 4: Vertical-wise 9MFY2016 Revenue split
O&M, 15.1
Municipal,
46.8
Industrial,
53.2
EPC, 84.9
Source: Company, Angel Research
Source: Company, Angel Research
EBITDA margin declines yoy
Wabag reported an 11.7% yoy increase in EBITDA to `37cr while the EBITDA
margin declined 132bp yoy to 9.9%, in 3QFY2016. The compression in the
EBITDA margin is owing to a sharp increase in other expenses to `22cr (vs `5cr in
3QFY2015). Such increase in other expenses is attributable to higher doubtful
debts provisioning of `12cr, which is in-line with the company’s internal policy of
ageing debtors.
Exhibit 5: EBITDA margins compress yoy
Exhibit 6: PAT margins also decline...
90
16.0
60
10.0
80
14.0
9.0
50
9.1
70
13.7
8.0
12.0
60
7.0
40
7.4
11.2
10.0
10.6
10.6
6.6
6.0
50
9.9
8.0
6.0
8.8
30
5.6
5.0
40
5.0
6.0
4.0
30
20
3.0
4.0
20
2.0
2.0
10
10
21
33
78
27
34
37
1.0
12
18
52
17
24
21
0
0.0
0
0.0
2QFY2015
3QFY2015
4QFY2015
1QFY2016
2QFY2016
3QFY2016
2QFY2015
3QFY2015
4QFY2015
1QFY2016
2QFY2016
3QFY2016
EBITDA (` cr)
EBITDA margin (%)
PAT (` cr)
PAT Margin (%)
Source: Company, Angel Research
Source: Company, Angel Research
PAT margin down yoy
In-line with the EBITDA margin, the PAT margin declined from 6.0% in 3QFY2015
to 5.6% in 3QFY2016. This is in spite of a 9.5% decline in yoy depreciation
expenses (to `3cr) and a lower tax rate (at 32.7%).
February 18, 2015
3
VA Tech Wabag | 3QFY2016 Result Update
Update on subsidiaries’ performance
The company’s International subsidiaries’ revenues declined 20.8% on a yoy basis
to `258cr which is attributable to (1) Euro depreciation (over 10%), and (2) some
of the projects being at early stages of execution and not contributing to revenues
(inclusive of Nepal based projects), and (3) lower revenue booking from Al Gubrah
project (is nearing completion).
A poor operating performance coupled with higher interest expenses (at `5.5cr) led to
international business losses. Surge in yoy interest expenses is on account of Ujams
BOOT project, Namibia.
`276cr of Order Inflows in 3QFY2016
Wabag reported `276cr of order wins in 3QFY2016, which is down 59% yoy.
Wabag reported a key order win from Sanliurfa WWTP, Turkey. The Management
attributed client side delays on project finalization in domestic markets as the
key reason for decline in yoy order inflows. For 9MFY2016 Wabag reported
~130% yoy increase in order inflows to `3,356cr.
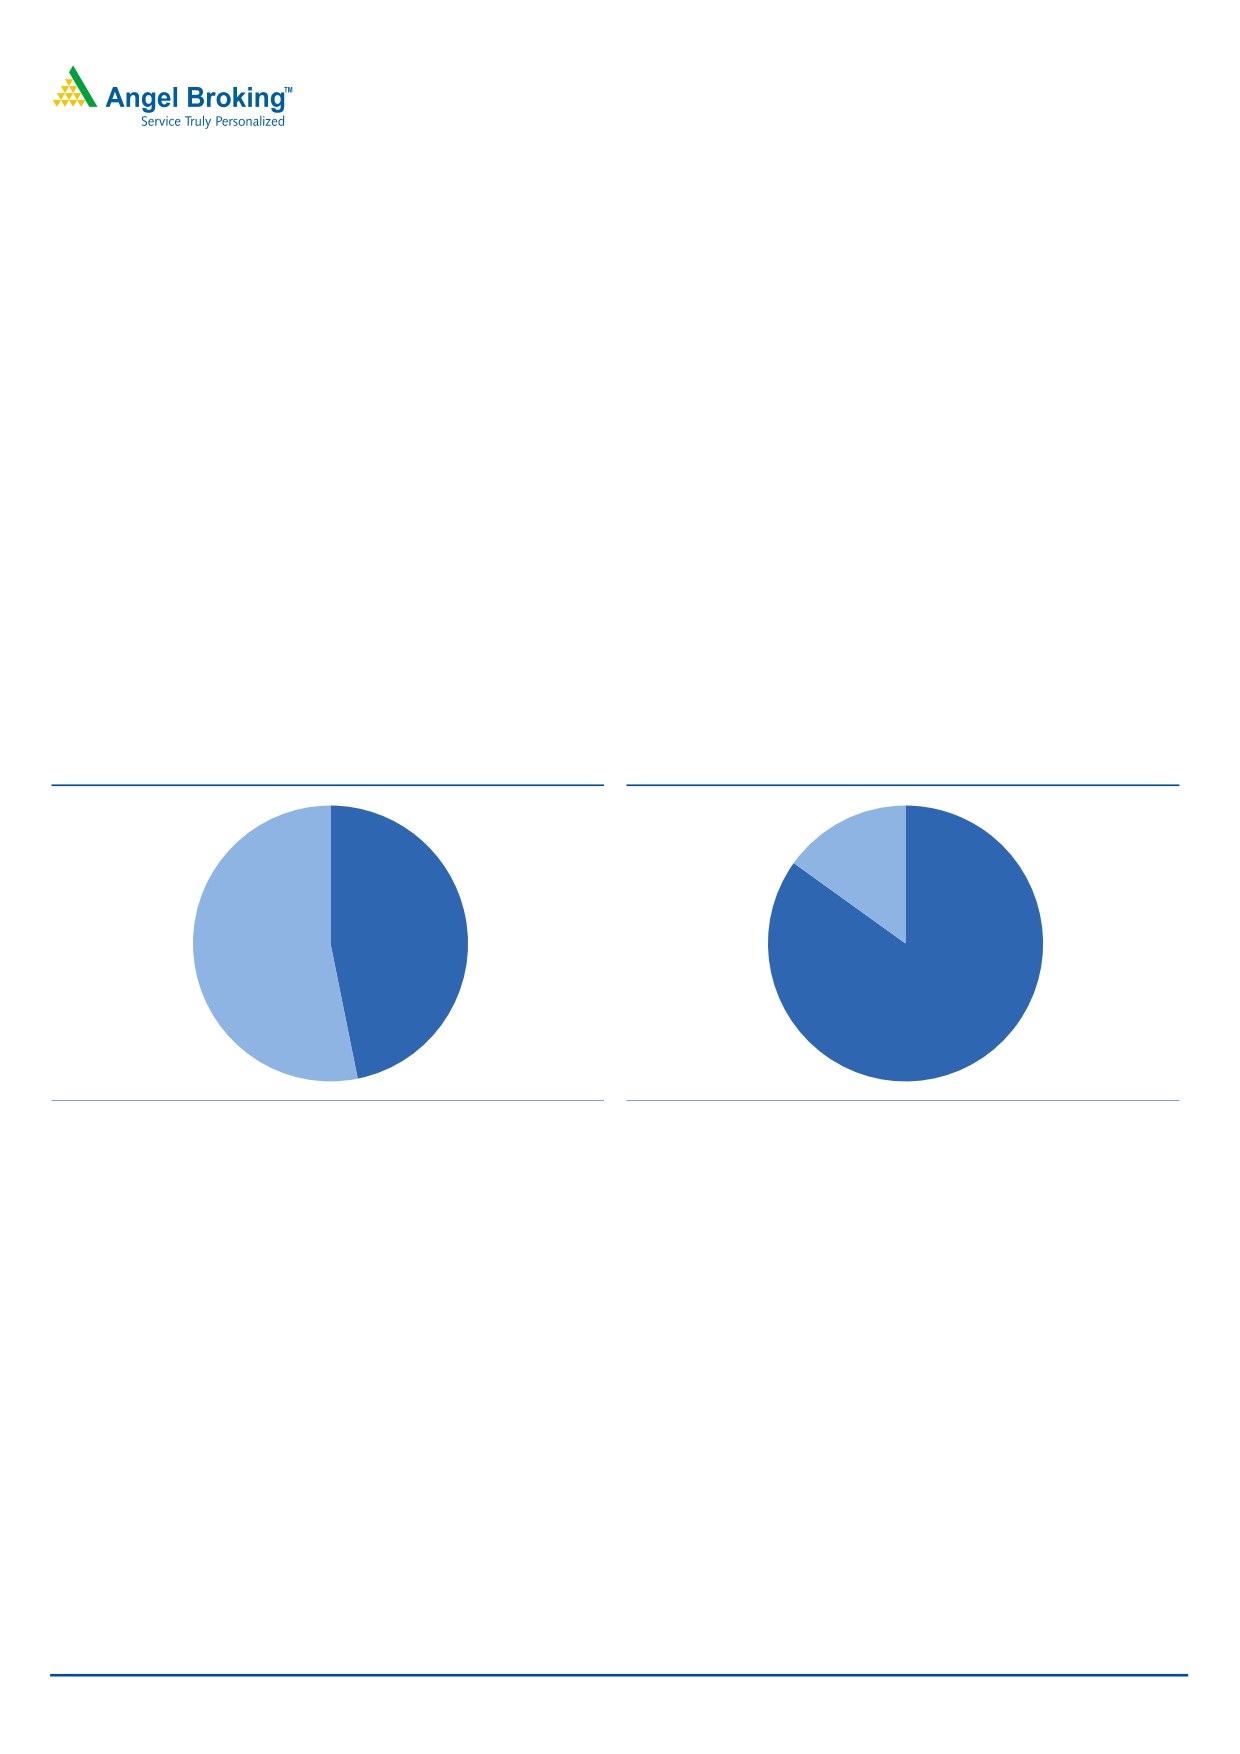
Exhibit 7: Business-wise 9MFY2016 Order Inflows split
Exhibit 8: Vertical-wise 9MFY2016 Order Inflows split
O&M, 15.1
Municipal,
46.8
Industrial,
53.2
EPC, 84.9
Source: Company, Angel Research
Source: Company, Angel Research
Order book as of 3QFY2016-end stood at `7,952cr, reflecting Order book / last
twelve month (LTM) sales ratio of 3.1x.
Management Guidance & Concall Updates
For FY2016, the company’s Management maintained its order inflow guidance of
`3,500-3,700cr (up 18-24% yoy). Considering Wabag having won `680cr of
Polghawella Water Supply scheme in Sri Lanka in 4QFY2016, and with `3,356cr
of order inflows for 9MFY2016, we believe that the company has a fair chance to
attain its order inflow guidance for FY2016.
Wabag’s Management has given a revenue guidance of `2,800-3,000cr (up 15-
24%) for FY2016.
The Management highlighted that it expects to maintain FY2016 EBITDA margins
on the lines of ~8.7%, as reported in FY2015. This in our view is a challenging
task, given that Wabag will have to report 12.6% margin in 4QFY2016 vs 5.9%
reported in 9MFY2016.
February 18, 2015
4
VA Tech Wabag | 3QFY2016 Result Update
Investment arguments
Strong market positioning: Wabag in our view has a strong portfolio of offerings in
the water treatment/ waste water/ desalination space. Unlike most of the domestic
EPC players, Wabag has a differentiated business model, given its in-house
technology. Strong technological know-how, coupled with large talent positions it
to successfully execute complex water projects.
Asset-light business model drives RoEs: Wabag pursues an asset-light business
model. Its strategy of keeping core areas of work in-house and outsourcing the
non-critical, low-value work helps it maintain high RoEs. Also, it takes on large
volume projects, thereby enabling it to generate high RoEs.
India & Emerging markets hold huge opportunity: India has low per capita water
supply vis-a-vis developed nations, indicating huge growth potential for the
company’s business. Also, with rising stringency in norms for waste water
treatment, scope for Wabag is huge, given that ~30% of industrial waste water is
not treated. Wabag has made strong in-roads in emerging markets like
Philippines, China, Saudi Arabia, Egypt, Spain and Turkey.
Risks & Concerns
Delays in revival of international business could impact our margin
assumptions.
Any significant loss of market share could be a risk to our assumptions.
Execution delays in the domestic markets could be a risk to our assumptions.
Valuation
The stock trades at FY2017E/2018E P/E multiple of 26.1x/20.7x, which continues
to be at the higher end of the historical band. On considering the 25% correction
in the stock price in the last 3 months period, valuations in our view still do not
factor in the muted order inflow environment, modest earnings growth, and
stretched working capital cycle. We assign a 20.0x P/E multiple to our FY2017E
EPS of `25 to arrive at a price target of `492. Given the limited upside potential,
we recommend Neutral rating on the stock.
February 18, 2015
5
VA Tech Wabag | 3QFY2016 Result Update
Company background
VA Tech Wabag is a multinational player in the water treatment industry with
presence across India, Middle East, North Africa, Central and Eastern Europe,
China and South East Asia. Wabag offers an entire range of solutions including
conceptualisation, design, engineering, procurement, supply, installation,
construction and O&M (operational and maintenance) services. The company also
provides range of EPC and O&M solutions for sewage treatment, processed &
drinking water treatment, effluents treatment, sludge treatment, desalination and
reuse for institutional clients like municipal corporations and companies in the
infrastructure sector.
February 18, 2015
6
VA Tech Wabag | 3QFY2016 Result Update
Profit and Loss Statement (Standalone)
Y/E March (` cr)
FY13
FY14
FY15
FY16E
FY17E
Net Sales
1,619
2,239
2,435
2,722
3,336
% Chg
12.1
38.3
8.8
11.8
22.5
Total Expenditure
1,464
2,050
2,226
2,506
3,066
Cost of sales & services
1,165
1,689
1,848
2,067
2,550
Changes in inventory
10
9
(15)
11
8
Employee benefits Expense
209
222
278
304
366
Other Expenses
80
130
115
123
142
EBITDA
155
189
209
216
270
% Chg
19.1
21.7
11.1
3.3
24.6
EBIDTA %
9.6
8.4
8.6
7.9
8.1
Depreciation
11
15
11
20
26
EBIT
144
173
199
197
243
% Chg
18.5
20.5
14.4
(1.0)
23.8
Interest and Financial Charges
22
25
39
45
50
Other Income
13
13
8
7
7
EBT & exceptional items
135
161
167
159
200
Exceptional Items
0
5
0
0
0
EBT
135
166
167
159
200
Tax Expenses
46
53
57
53
67
% of PBT
33.7
32.6
33.9
33.3
33.3
EAT before share of Profit in asso.
90
114
110
106
134
Share of profit in Associate
1
1
2
2
2
PAT before Minority Interest
90
114
112
107
135
Minority Interest
0
1
2
2
2
PAT
90
113
110
106
134
% Chg
22.5
25.5
(2.9)
(3.8)
26.2
PAT %
5.6
5.1
4.5
3.9
4.0
Diluted EPS
33.8
42.1
20.2
19.5
24.6
% Chg
21.2
24.8
(52.1)
(3.5)
26.2
February 18, 2015
7
VA Tech Wabag | 3QFY2016 Result Update
Balance Sheet (Standalone)
Y/E March (` cr)
FY13
FY14
FY15
FY16E
FY17E
Sources of Funds
Equity Capital
5
5
11
11
11
Reserves & Surplus
710
836
892
998
1,131
Networth
715
841
903
1,009
1,142
Total Debt
82
158
181
207
227
Minority Interest &
2
3
5
6
8
Share appl. pending allot.
Other Long-term Liabilities & Prov.
112
182
242
255
275
Total Liabilities
912
1,185
1,331
1,477
1,652
Application of Funds
Gross Block
107
175
252
277
302
Accumulated Depreciation
56
56
61
81
107
Net Block
51
119
191
197
195
Capital WIP & Intan.
48
69
1
0
0
Assets under Develop.
Investments
3
23
38
38
38
Current Assets
Inventories
41
35
47
60
73
Sundry Debtors
1,109
1,387
1,481
1,700
2,102
Cash and Bank Balance
287
370
311
414
469
Loans & Advances
116
100
116
125
129
Other Current Asset
225
320
361
370
375
Current Liabilities
979
1,251
1,237
1,454
1,764
Net Current Assets
798
962
1,078
1,215
1,384
Other Assets
11
11
23
28
35
Total Assets
912
1,185
1,331
1,477
1,652
February 18, 2015
8
VA Tech Wabag | 3QFY2016 Result Update
Cash Flow Statement
Y/E March (` cr)
FY13
FY14
FY15
FY16E
FY17E
Profit before tax
135
161
167
159
200
Depreciation & Other Non-cash Charges
89
85
135
80
72
Change in Working Capital
(115)
(84)
(257)
(34)
(114)
Interest & Financial Charges
7
7
15
16
17
Direct taxes paid
(34)
(57)
(55)
(53)
(67)
Cash Flow from Operations
82
112
6
168
109
(Inc)/ Dec in Fixed Assets
(41)
(103)
(28)
(24)
(25)
(Inc)/ Dec in Investments & Oth. Adj.
1
5
(39)
0
0
Cash Flow from Investing
(40)
(97)
(68)
(24)
(25)
Issue/ (Buy Back) of Equity
3
1
20
0
0
Inc./ (Dec.) in Borrowings
(43)
76
22
27
20
Dividend Paid (Incl. Tax)
(19)
(22)
(25)
(25)
(31)
Interest Expenses & Oth. Adj.
(7)
(8)
(15)
(16)
(17)
Cash Flow from Financing
(65)
48
2
(14)
(29)
Inc./(Dec.) in Cash & forex translation
(21)
86
(91)
130
55
Opening Cash balances
265
244
330
240
369
Closing Cash balances
244
330
240
369
424
February 18, 2015
9
VA Tech Wabag | 3QFY2016 Result Update
Ratio Analysis (x)
Y/E March
FY13
FY14
FY15
FY16E
FY17E
Valuation Ratio (x)
Adj. P/E (on FDEPS)
15.1
12.1
25.2
26.1
20.7
Adj. P/CEPS
13.3
10.5
22.8
22.0
17.2
Dividend yield (%)
1.2
1.4
0.8
0.8
1.0
EV/Sales
0.7
0.5
1.1
0.9
0.8
EV/EBITDA
7.4
6.1
12.6
11.8
9.3
EV / Total Assets
1.3
1.0
2.0
1.7
1.5
Per Share Data (`)
Adj. EPS (fully diluted)
33.8
42.1
20.2
19.5
24.6
Cash EPS
38.1
48.3
22.3
23.1
29.5
DPS
6.0
7.0
4.0
3.9
4.9
Book Value
269
316
166
186
210
Returns (%)
RoCE (Pre-tax)
20.1
20.6
22.0
19.5
21.3
Angel RoIC (Pre-tax)
14.1
13.3
12.0
10.3
11.7
RoE
12.6
14.6
12.6
11.1
12.4
Turnover ratios (x)
Asset Turnover (Gross Block) (x)
0.6
0.5
0.5
0.5
0.5
Inventory / Sales (days)
9
6
7
8
8
Receivables (days)
250
226
222
228
230
Payables (days)
221
204
185
195
193
WC (days)
39
28
44
41
45
Leverage Ratios (x)
D/E ratio (x)
0.1
0.2
0.2
0.2
0.2
February 18, 2015
10
VA Tech Wabag | 3QFY2016 Result Update
Research Team Tel: 022 - 39357800
DISCLAIMER
Angel Broking Private Limited (hereinafter referred to as “Angel”) is a registered Member of National Stock Exchange of India Limited,
Bombay Stock Exchange Limited and MCX Stock Exchange Limited. It is also registered as a Depository Participant with CDSL and
Portfolio Manager with SEBI. It also has registration with AMFI as a Mutual Fund Distributor. Angel Broking Private Limited is a
registered entity with SEBI for Research Analyst in terms of SEBI (Research Analyst) Regulations, 2014 vide registration number
INH000000164. Angel or its associates has not been debarred/ suspended by SEBI or any other regulatory authority for accessing
/dealing in securities Market. Angel or its associates including its relatives/analyst do not hold any financial interest/beneficial
ownership of more than 1% in the company covered by Analyst. Angel or its associates/analyst has not received any compensation /
managed or co-managed public offering of securities of the company covered by Analyst during the past twelve months. Angel/analyst
has not served as an officer, director or employee of company covered by Analyst and has not been engaged in market making activity
of the company covered by Analyst.
This document is solely for the personal information of the recipient, and must not be singularly used as the basis of any investment
decision. Nothing in this document should be construed as investment or financial advice. Each recipient of this document should
make such investigations as they deem necessary to arrive at an independent evaluation of an investment in the securities of the
companies referred to in this document (including the merits and risks involved), and should consult their own advisors to determine
the merits and risks of such an investment.
Reports based on technical and derivative analysis center on studying charts of a stock's price movement, outstanding positions and
trading volume, as opposed to focusing on a company's fundamentals and, as such, may not match with a report on a company's
fundamentals.
The information in this document has been printed on the basis of publicly available information, internal data and other reliable
sources believed to be true, but we do not represent that it is accurate or complete and it should not be relied on as such, as this
document is for general guidance only. Angel Broking Pvt. Limited or any of its affiliates/ group companies shall not be in any way
responsible for any loss or damage that may arise to any person from any inadvertent error in the information contained in this report.
Angel Broking Pvt. Limited has not independently verified all the information contained within this document. Accordingly, we cannot
testify, nor make any representation or warranty, express or implied, to the accuracy, contents or data contained within this document.
While Angel Broking Pvt. Limited endeavors to update on a reasonable basis the information discussed in this material, there may be
regulatory, compliance, or other reasons that prevent us from doing so.
This document is being supplied to you solely for your information, and its contents, information or data may not be reproduced,
redistributed or passed on, directly or indirectly.
Neither Angel Broking Pvt. Limited, nor its directors, employees or affiliates shall be liable for any loss or damage that may arise from
or in connection with the use of this information.
Note: Please refer to the important ‘Stock Holding Disclosure' report on the Angel website (Research Section). Also, please refer to the
latest update on respective stocks for the disclosure status in respect of those stocks. Angel Broking Pvt. Limited and its affiliates may
have investment positions in the stocks recommended in this report.
Disclosure of Interest Statement
VA Tech Wabag
1. Analyst ownership of the stock
No
2. Angel and its Group companies ownership of the stock
No
3. Angel and its Group companies' Directors ownership of the stock
No
4. Broking relationship with company covered
No
Note: We have not considered any Exposure below ` 1 lakh for Angel, its Group companies and Directors
Ratings (Based on expected returns
Buy (> 15%)
Accumulate (5% to 15%)
Neutral (-5 to 5%)
over 12 months investment period):
Reduce (-5% to -15%)
Sell (< -15%)
February 18, 2015
11