2QFY2016 Result Update | Agrichemical
November 4, 2015
United Phosphorus
ACCUMULATE
CMP
`451
Performance Highlights
Target Price
`510
Y/E March (` cr)
2QFY2016 1QFY2016
% chg (qoq) 2QFY2015
% chg (yoy)
Investment Period
12 Months
Net sales
2,729
3012
(9.4)
2618
4.2
Other income
51
27
89.3
62
(16.8)
Stock Info
Gross profit
1362
1510
(9.8)
1323
2.9
Sector
Agrichemical
Operating profit
450
535
(15.8)
436
3.3
Market Cap (` cr)
19,347
Adj. net profit
190
285
(33.2)
181
5.5
Source: Company, Angel Research
Net Debt (` cr)
1,113
Beta
0.9
For 2QFY2016, United Phosphorous (UPL) posted a 4.2% yoy growth in sales to
52 Week High / Low
576/300
`2,729cr. The volume growth during the period was of 13% yoy, while price increases
Avg. Daily Volume
184430
contributed around 2% yoy. The exchange rate on the other hand, impacted adversely
Face Value (`)
2
by 11% yoy. On the operating front, the gross margins came in at 49.9% V/s 50.5% in
2QFY2015, which led the OPM to come in at 16.5% V/s 16.7% in 2QFY2015. The
BSE Sensex
26,591
company posted a
12.3% yoy dip in its PAT for the quarter excluding the
Nifty
8,061
extra-ordinaries and profits from associates and subsidiaries. However, a higher share
Reuters Code
UNPO.BO
of profitability from associates and subsidiaries has enabled the company posted to post
Bloomberg Code
UNTP@IN
an Adj. PAT of `190cr V/s `180cr in 2QFY2015, a yoy growth of 5.5%. We maintain
our Accumulate rating on the stock with a price target of `510.
Shareholding Pattern (%)
Quarterly highlights: For 2QFY2016, the company posted a 4.2% yoy growth in sales to
Promoters
29.8
`2,729cr. Its key markets - India and Latin America, posted a 5% and 8% yoy growth,
MF / Banks / Indian Fls
14.1
respectively. ROW and USA posted a yoy growth of 12% and 10%, respectively. The
FII / NRIs / OCBs
49.1
only market to decline was Europe, which posted a 10% yoy dip in sales. The volume
Indian Public / Others
7.0
growth during the period was 13% yoy, while price increases contributed around
2% yoy. The exchange rate on the other hand impacted adversely by 11% yoy. On the
operating front, the gross margin came in at 49.9% V/s 50.5% in 2QFY2015, which led
Abs. (%)
3m 1yr
3yr
the OPM to come in at 16.5% V/s 16.7% in 2QFY2015. The company posted an Adj.
Sensex
(5.7)
(4.6)
41.8
PAT of `190cr V/s `180cr in 2QFY2015, a yoy growth of 5.5%.
UPL
(16.5)
31.6
282.9
Outlook and valuation: We expect UPL to post a CAGR of 15.0% and 20.0% in its sales
and PAT respectively, over FY2015-17E. At the current market price, we recommend an
3-year price chart
600
Accumulate on the stock with a price target of `510.
500
Key financials (Consolidated)
400
Y/E March (` cr)
FY2014
FY2015
FY2016E
FY2017E
300
200
Total revenue
10,580
11,911
13,698
15,752
100
% chg
17.4
12.6
15.0
15.0
0
2
2
3
3
4
4
4
5
5
Adj. profit
1,040
1,147
1,376
1,651
1
1
1
1
1c
y
1
ŧ
r
1
-
1c
y
1
ŧ
gu
e
a
c
a
uJ
e
a
c
A
D
M
O M
D
M
O
% chg
38.0
10.2
20.0
20.0
EBITDA (%)
17.3
18.3
17.6
17.6
Source: Company, Angel Research
EPS (`)
24.3
26.7
32.1
38.5
P/E (x)
18.5
16.8
14.0
11.6
P/BV (x)
3.7
3.3
2.7
2.3
RoE (%)
21.0
20.6
21.4
21.3
RoCE (%)
17.7
19.9
19.8
20.5
Sarabjit Kour Nangra
EV/Sales (x)
2.4
2.1
1.8
1.5
+91-22-3935 7800 ext. 6806
EV/EBITDA (x)
13.9
11.6
10.3
8.6
Source: Company, Angel Research; Note: CMP as of November 3, 2015
Please refer to important disclosures at the end of this report
1
United Phosphorus | 2QFY2016 Result Update
Exhibit 1: 2QFY2016 Performance (Consolidated)
Y/E March (` cr)
2QFY2016
1QFY2016
% chg (qoq) 2QFY2015
% chg (yoy) 1HFY2016 1HFY2015
% chg
Net sales
2,729
3,012
(9.4)
2,618
4.2
5,740
5,338
7.5
Other income
51
27
89.3
62
(16.8)
79
114
(31.1)
Total income
2,780
3,039
(8.5)
2,680
3.7
5,819
5,452
6.7
Gross profit
1362
1510
(9.8)
1323
2.9
2871
2723
5.5
Gross margin (%)
49.9
50.1
50.5
50.0
51.0
Operating profit
450
535
(15.8)
436
3.3
985
922
6.8
Operating margin (%)
16.5
17.8
16.7
17.2
17.3
Financial cost
135
102
33.0
140
(3.3)
237
257
Depreciation
111
108
2.8
109
2.1
220
213
3.1
PBT
255
352
(27.6)
249
2.5
607
566
7.2
Provision for taxation
77
69
11.4
46
67.4
146
134
9.1
PAT Before Exc. And MI
178
281
(36.7)
203
(12.3)
456
432
5.5
Minority Income/ ( Exp.)
(2)
2
29
1
17
Income from Associate/ (Exp)
13
5
10
18
20
Extra ordinary Income/( Exp.)
(8)
(13)
(18)
(20)
(19)
Reported PAT
185
275
(32.6)
166
11.5
453
416
8.9
Adjusted PAT
190
285
(33.2)
181
5.5
468
431
8.8
EPS (`)
4.4
6.7
4.1
10.9
10.0
Source: Company, Angel Research
Top-line growth mainly led by ROW and Latin America
For the quarter, the company posted sales (including export incentives) of `2,801cr
V/s `2,662cr in 2QFY2015, registering a yoy growth of 4.2%. Domestic sales
(`715cr) rose by 5% yoy, while exports, including related incentives (`2,086cr),
posted a growth of 5.4% yoy.
The growth was aided by volume growth of 13% yoy while pricing grew by 2% yoy.
An 11% yoy adverse impact on account of the exchange rate proportionately
weighed on growth.
In terms of geographies, RoW (`396cr) posted a 12.0% yoy growth, while India
(`715cr) posted a 5% yoy growth, during the quarter. Europe (`358cr) on the other
hand de-grew by 10% yoy, while Latin America (`958cr) grew by 8.0% yoy. USA
(`374cr), the key market for the company, posted a yoy growth
of 10.0%.
The Indian market posted a moderate growth owing to lower-than-expected
rainfall in the country, which is likely to impact the Rabi crop as well. Europe
witnessed dry and high temperatures and is likely to report flat growth or possibly
a decline.
November 4, 2015
2
United Phosphorus | 2QFY2016 Result Update
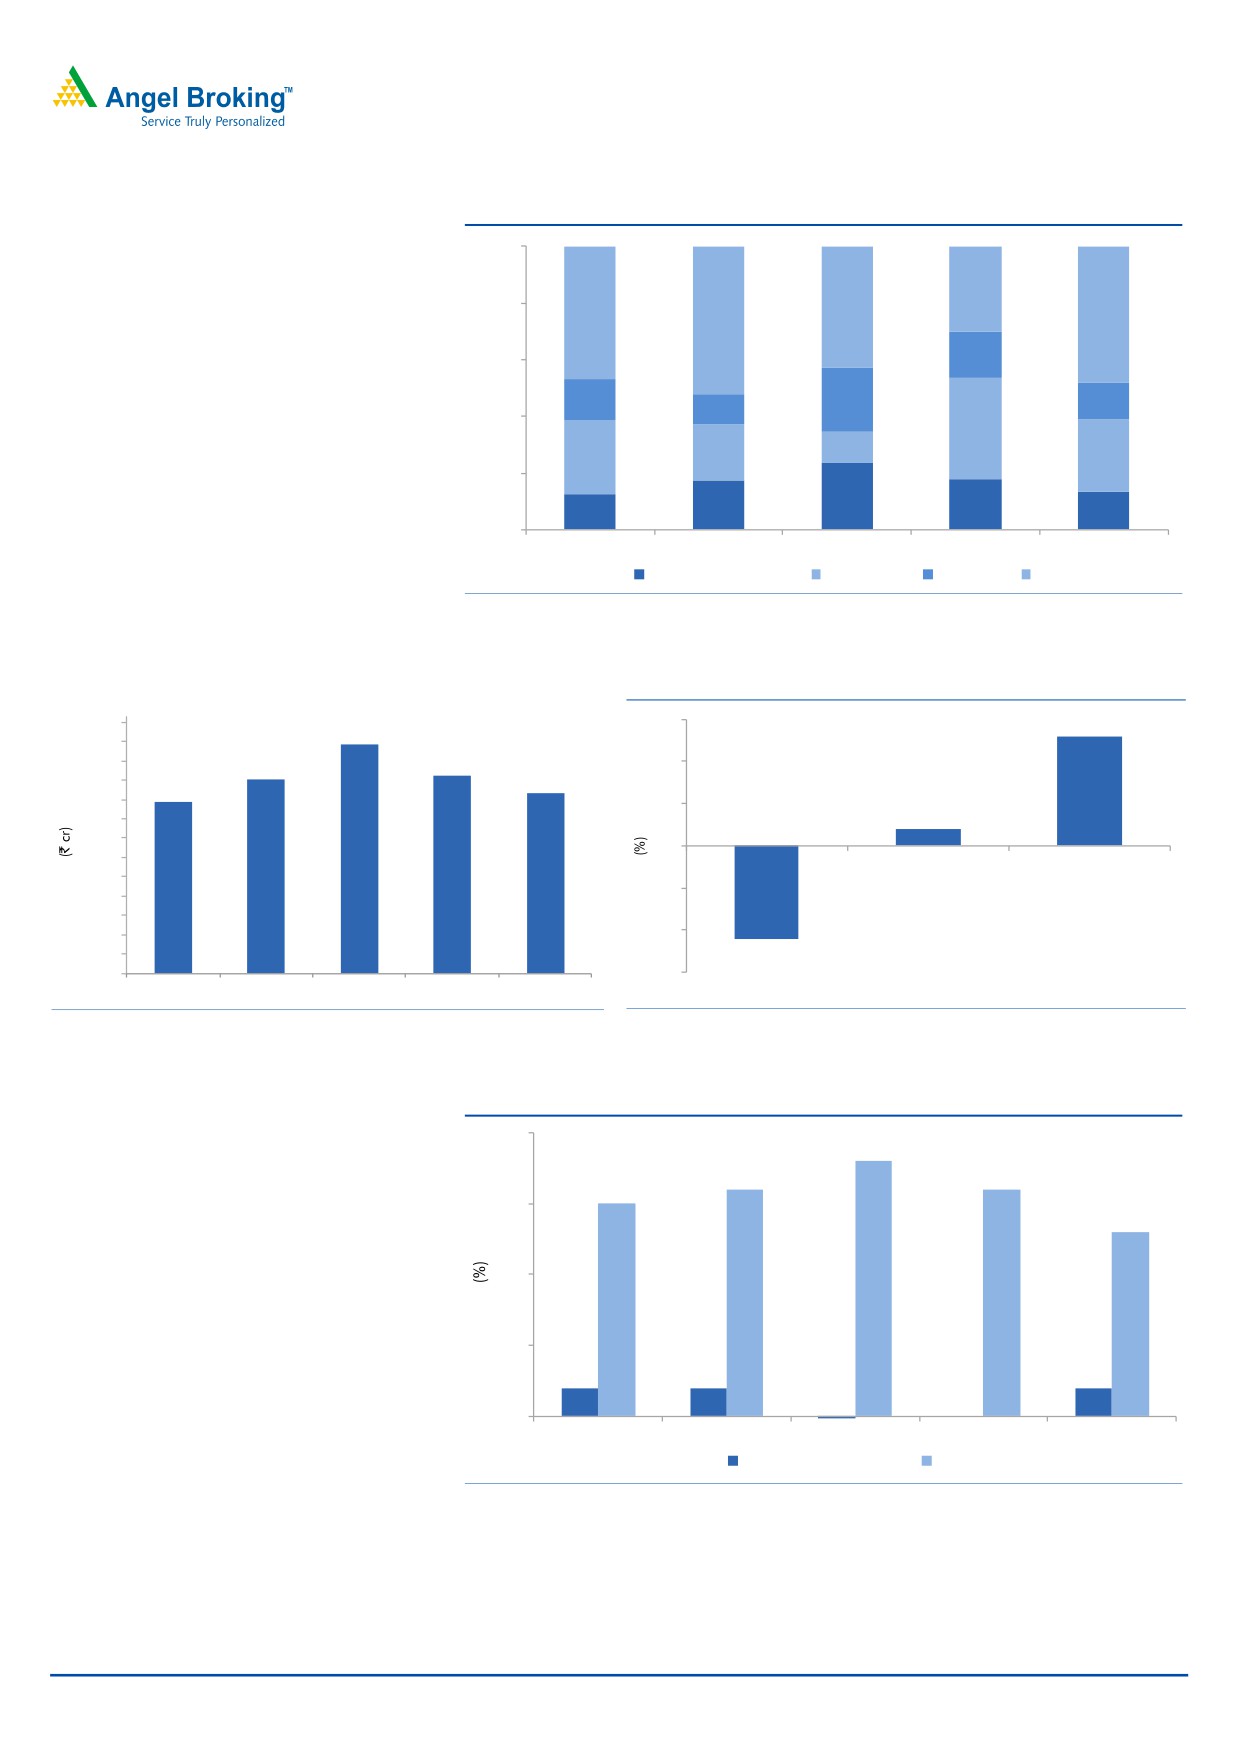
Exhibit 2: Sales Break-up (Marketwise)
100%
923
80%
1,557
1,250
1,354
1,594
60%
505
401
805
358
332
40%
1,083
401
686
603
715
20%
861
532
553
342
374
0%
2QFY2015
3QFY2015
4QFY2015
1QFY2016
2QFY2016
North America
India
EU
Others
Source: Company
Exhibit 3: Sales performance (including export incentives)
Exhibit 4: Growth break-up
3900
15
13
3,563
3600
3300
3,010
3,064
10
3000
2,801
2,662
2700
5
2
2400
2100
0
1800
1500
(5)
1200
900
600
(10)
300
(11)
0
(15)
2QFY2015
3QFY2015
4QFY2015
1QFY2016
2QFY2016
Exchange impact
Realisation
Volume
Source: Company, Angel Research
Source: Company, Angel Research
Exhibit 5: Volume and realisation break-up (yoy)
20
18
16
16
15
15
13
10
5
2
2
2
(2)
0
0
2QFY2015
3QFY2015
4QFY2015
1QFY2016
2QFY2016
Realisation
Volume
Source: Company, Angel Research
November 4, 2015
3
United Phosphorus | 2QFY2016 Result Update
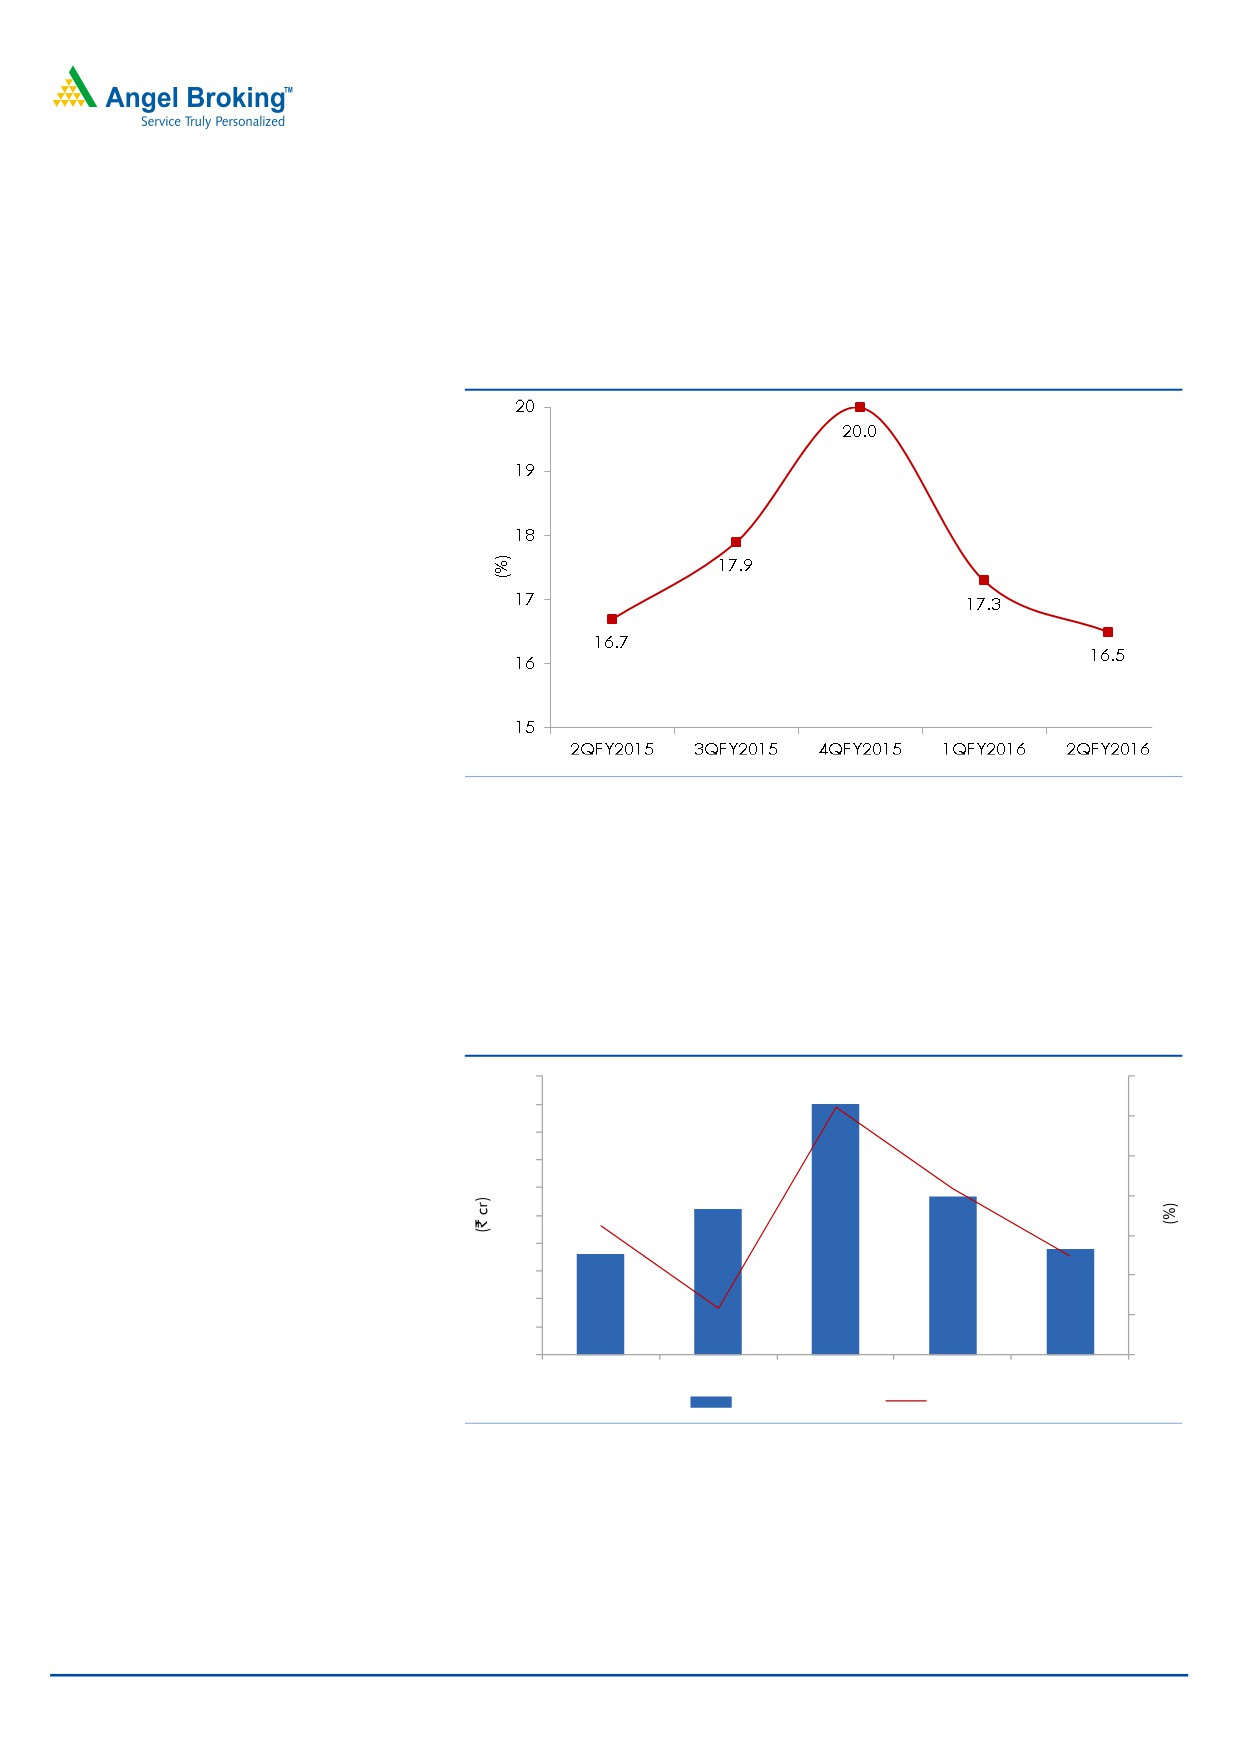
EBITDA margin remains stable
On the operating front, the gross margin came in at 49.9% V/s 50.5% in
2QFY2015, which aided the OPM for the quarter to come in at 16.5% V/s 16.7%
in 2QFY2015.
Exhibit 6: EBITDA margin trend
Source: Company, Angel Research
Adj net profit grew 5.5% yoy
The company posted a 12.3% yoy dip in its PAT excluding the extra-ordinaries and
profits from associates and subsidiaries. However, a higher share of profitability
from associates and subsidiaries, enabled the company to post an Adj. PAT of
`190cr V/s `180cr in 2QFY2015, a yoy growth of 5.5%.
Exhibit 7: Adjusted PAT trend
500
14
451
450
12
400
350
10
285
300
261
8
250
181
190
6
200
150
4
100
2
50
0
0
2QFY2015
3QFY2015
4QFY2015
1QFY2016
2QFY2016
Adj PAT
% YoY
Source: Company, Angel Research
November 4, 2015
4
United Phosphorus | 2QFY2016 Result Update
Invvestment arguments
Innovators dominant in the off-patent space; Generic firms in
a sweet spot
The global agrichem industry, valued at US$53bn (CY2014), is dominated by the
top six innovators, viz Bayer, Syngenta, Monsanto, BASF, DuPont and Dow, which
enjoy a large market share of the patented (28%) and off-patent (32%) market.
The top six innovators enjoy a large share of the off-patent market due to high
entry barriers for pure generic players. Thus, one-third of the total pie worth
US$18bn, which is controlled by the top six innovators through proprietary
off-patent products, provides a high-growth opportunity for larger integrated
generic players like UPL.
Generic segment’s market share to increase
Generic players have been garnering a high market share; their share has
increased from 32% levels in 1998 to 40% by 2006-end. The industry registered a
CAGR of 3% over 1998-2006, while generic players outpaced the industry with a
CAGR of 6%. Going ahead, given the opportunities and a drop in the rate of new
molecule introduction by innovators, we expect generic players to continue to
outpace the industry’s growth rate and augment their market share in the overall
pie. Historically, global agrichem players have been logging in-line growth with
global GDP. Going ahead, over CY2015-16, the global economy is expected to
grow by 3-4%. Assuming this trend plays out in terms of growth for the agrichem
industry, and the same rate of genericisation occurs, then the agrichemical generic
industry could log in 6-8% yoy growth during the period and garner a market
share of 44-45%.
A global generic play
UPL figures among the top five global generic agrichemical players with presence
across major markets including the US, EU, Latin America, and India. Given the
high entry barriers by way of high investments, entry of new players is restricted.
Thus, amidst this scenario and on account of having a low-cost base,
we believe UPL enjoys an edge over competition and is placed in a sweet spot to
leverage the upcoming opportunities in the global generic space.
November 4, 2015
5
United Phosphorus | 2QFY2016 Result Update
Outlook and valuation
Over the last few years, the global agriculture sector has been reviving on the back
of rising food prices. Food security is also a top priority for most governments;
reducing food loss is one of the easiest ways to boost food inventory. Hence, we
believe agrichemical companies would continue to do well in the wake of
heightened food security risks, and strong demand is likely to be witnessed across
the world. Overall, we expect the global agrichemical industry to perform well
from here on. Generics are expected to register a healthy growth due to a)
increasing penetration and wresting market share from innovators and b) patent
expiries worth US$3bn-4bn during the next five years.
We estimate UPL to post a 15.0% and 20.0% CAGR in sales and PAT, respectively,
over FY2015-17E. The stock is trading at 11.6x FY2017E EPS, which we believe,
provides some room for appreciation, hence we recommend an Accumulate rating
on the stock.
Exhibit 8: Key assumption
FY2016E
FY2017E
Sales growth
15.0
15.0
EBITDA margin
17.6
17.6
Tax rate
20.0
20.0
Source: Company, Angel Research
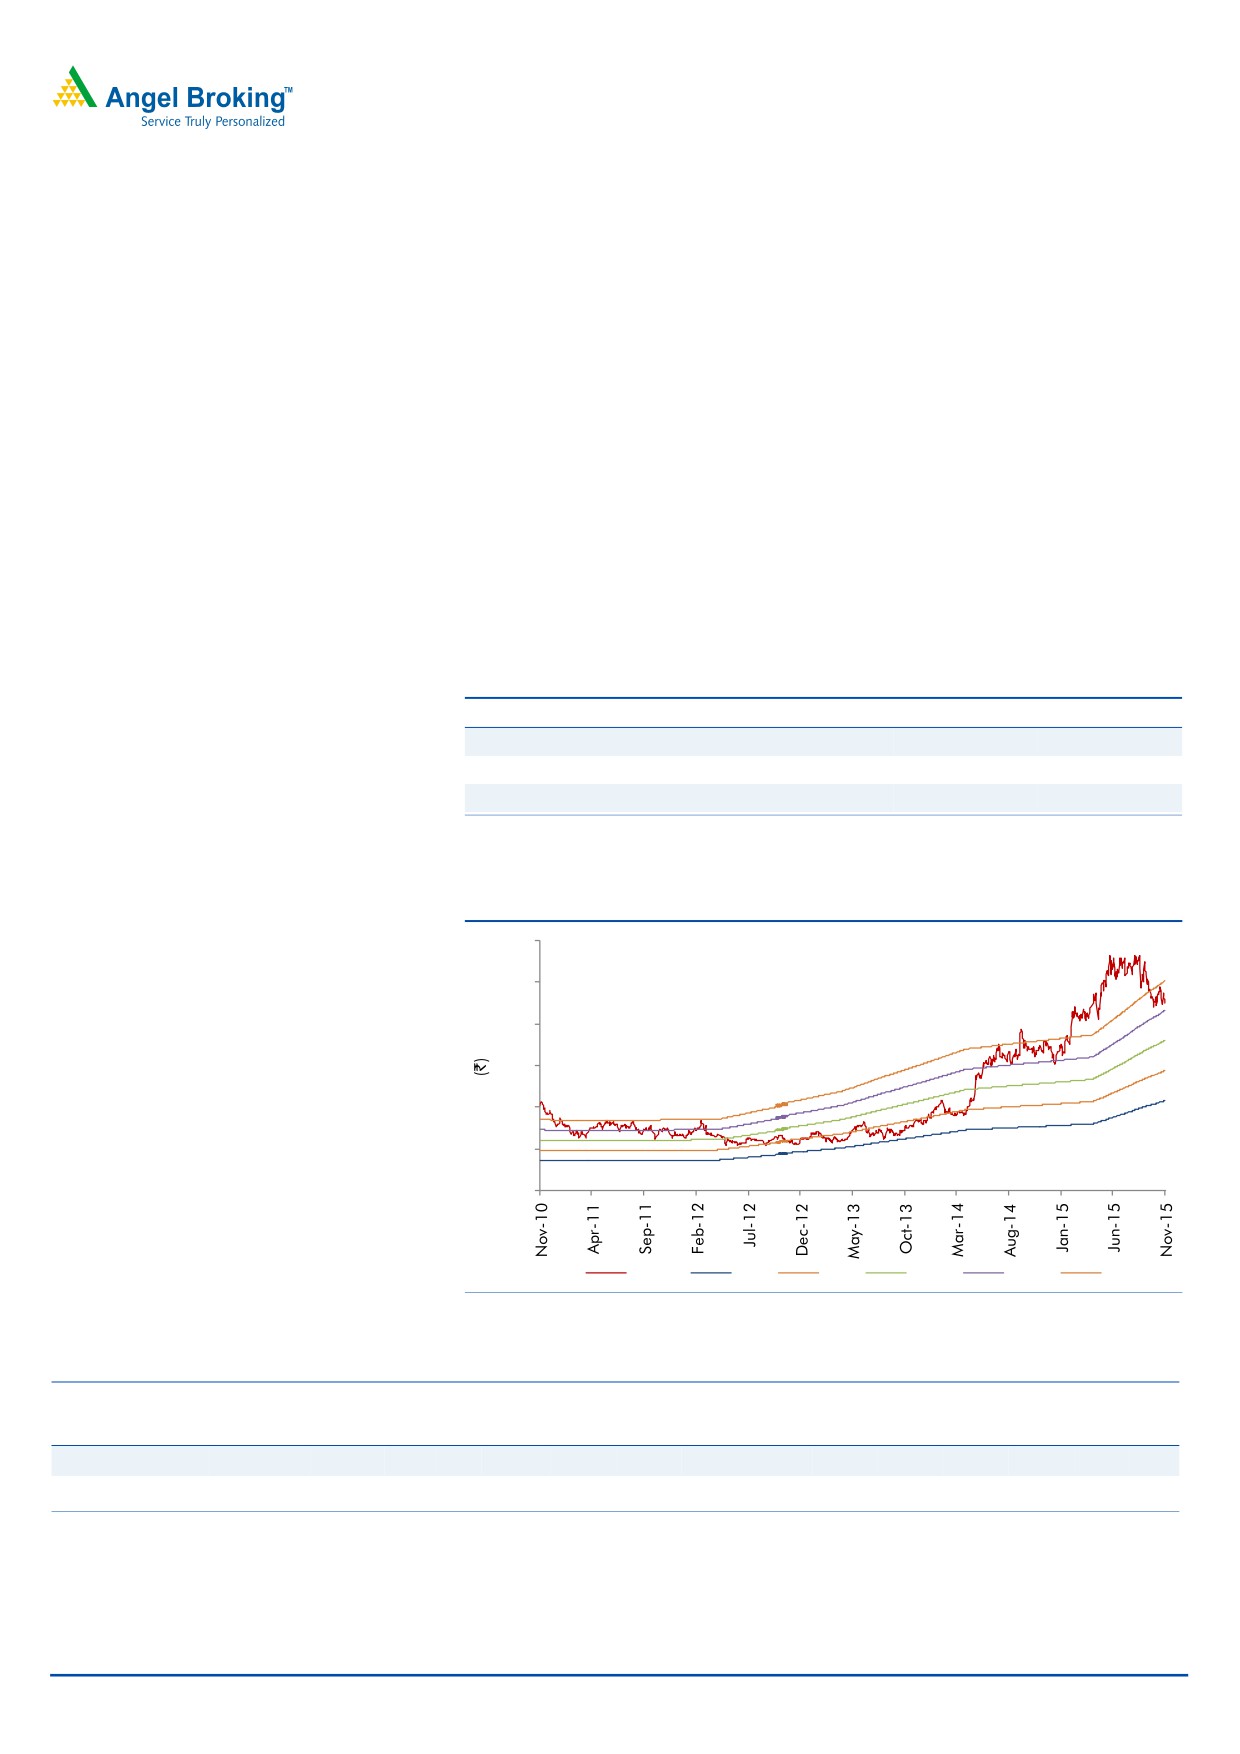
Exhibit 9: P/E band
600
500
400
300
200
100
0
Price
6x
8x
10x
12x
14x
Source: Company, Angel Research
Exhibit 10: Peer valuation
Company
Reco
Mcap CMP TP Upside
P/E (x)
EV/Sales (x)
EV/EBITDA (x)
RoE (%)
CAGR (%)
(` cr)
(`)
(`)
(%) FY16E FY17E FY16E FY17E FY16E FY17E FY16E FY17E Sales PAT
Rallis
Neutral
4,011
206
-
-
21.8
18.7
2.0
1.7
14.0
11.9
21.1
21.3
15.1
16.7
United Phosphorus Accumulate
19,347
451
510
13.1
14.0
11.6
1.8
1.5
10.3
8.6
21.4
21.3
15.0
20.0
Source: Company, Angel Research, Bloomberg
November 4, 2015
6
United Phosphorus | 2QFY2016 Result Update
Company background
United Phosphorus (UPL) is a global generic crop protection, chemicals and seeds
company. The company is fully backward and forward integrated by taking
advantage of the consolidation opportunities within the agrochemical industry. UPL
is the largest Indian agrochemical company and had revenue of about `11,911cr
for the year ended March 2015.
Profit & Loss Statement (Consolidated)
Y/E March (` cr)
FY2012
FY2013
FY2014
FY2015
FY2016E
FY2017E
Net Sales
7,534
9,010
10,580
11,911
13,698
15,752
Other operating income
137
184
191
45
45
45
Total operating income
7,671
9,195
10,771
11,956
13,743
15,798
% chg
33.2
19.9
17.1
11.0
14.9
15.0
Total Expenditure
6,328
7,568
8,751
9,736
11,281
12,973
Net Raw Materials
4,058
4,687
5,441
6,016
7,027
8,081
Other Mfg costs
590
741
1,034
1,164
1,315
1,512
Personnel
686
853
946
1,043
1,199
1,379
Other
994
1,287
1,330
1,513
1,740
2,001
EBITDA
1,206
1,442
1,829
2,175
2,417
2,780
% chg
28.1
19.6
26.8
19.0
11.1
15.0
(% of Net Sales)
16.0
16.0
17.3
18.3
17.6
17.6
Depreciation& Amortisation
292
354
407
425
486
507
EBIT
1,051
1,273
1,613
1,796
1,976
2,318
% chg
25.3
21.1
26.7
11.4
10.0
17.3
(% of Net Sales)
13.7
13.8
15.0
15.0
14.4
14.7
Interest & other Charges
415
429
487
517
362
362
Other Income
97
73
131
131
131
131
(% of PBT)
13
8
10
9
8
6
Recurring PBT
734
917
1,257
1,410
1,746
2,088
% chg
11.4
25.0
37.1
12.2
23.8
19.6
Extraordinary Expense/(Inc.)
(5)
27
85
(2)
-
-
PBT (reported)
729
944
1,172
1,413
1,746
2,088
Tax
128
203
222
244
349
418
(% of PBT)
17.6
21.5
18.9
17.3
20.0
20.0
PAT (reported)
601
741
950
1,169
1,397
1,670
Add: Share of earnings of asso.
(40)
32
30
21
23
26
Less: Minority interest (MI)
5
(2)
7
43
43
43
Prior period items
-
-
24
-
1
2
PAT after MI (reported)
556
775
950
1,144
1,376
1,651
ADJ. PAT
561
754
1,040
1,147
1,376
1,651
% chg
1.6
34.3
38.0
10.2
20.0
20.0
(% of Net Sales)
7.5
8.4
9.8
9.6
10.0
10.5
Basic EPS (`)
12.2
17.0
24.3
26.7
32.1
38.5
Fully Diluted EPS (`)
12.2
17.0
24.3
26.7
32.1
38.5
% chg
1.6
40.1
42.5
10.2
20.0
20.0
November 4, 2015
7
United Phosphorus | 2QFY2016 Result Update
Balance Sheet (Consolidated)
Y/E March (` cr)
FY2012
FY2013
FY2014
FY2015
FY2016E
FY2017E
SOURCES OF FUNDS
Equity Share Capital
92
89
86
86
86
86
Preference Capital
-
-
-
-
-
-
Reserves& Surplus
4,081
4,557
5,162
5,775
6,936
8,373
Shareholders’ Funds
4,173
4,645
5,247
5,860
7,022
8,459
Minority Interest
250
234
172
44
88
131
Total Loans
3,389
4,203
2,873
2,781
2,781
2,781
Other Long term liabilities
301
395
311
594
594
594
Long Term Provisions
51
51
53
53
53
53
Deferred Tax Liability
(6)
(13)
57
45
45
45
Total Liabilities
8,158
9,516
8,714
9,378
10,583
12,063
APPLICATION OF FUNDS
Gross Block
4,687
5,386
6,039
6,792
7,092
7,392
Less: Acc. Depreciation
2,605
3,173
3,580
4,005
4,491
4,998
Net Block
2,082
2,213
2,459
2,787
2,601
2,394
Capital Work-in-Progress
306
378
378
378
378
378
Goodwill / Intangilbles
1,141
1,277
1,212
1,449
1,449
1,449
Investments
795
1,025
737
764
764
764
Long Term Loan & Adv.
321
277
389
418
481
553
Current Assets
5,625
7,154
7,572
8,372
10,419
12,860
Cash
1,566
1,548
1,023
1,010
1,331
2,409
Loans & Advances
602
852
771
586
1,295
1,489
Other
3,458
4,754
5,779
6,776
7,793
8,961
Current liabilities
2,111
2,807
4,033
4,789
5,508
6,334
Net Current Assets
3,514
4,346
3,539
3,582
4,911
6,526
Others
-
-
-
-
-
-
Total Assets
8,158
9,516
8,714
9,378
10,583
12,063
November 4, 2015
8
United Phosphorus | 2QFY2016 Result Update
Cash Flow Statement (Consolidated)
Y/E March (` cr)
FY2012 FY2013 FY2014 FY2015 FY2016E FY2017E
Profit before tax
729
944
1,172
1,413
1,746
2,088
Depreciation
292
354
407
425
486
507
Change in Working Capital
318
(806)
171
(86)
(1,070)
(609)
Less: Other income
-
-
-
-
-
-
Direct taxes paid
(128)
(203)
(222)
(244)
(349)
(418)
Cash Flow from Operations
1,211
288
1,528
1,508
813
1,568
(Inc.)/ Dec. in Fixed Assets
(989)
(771)
(653)
(753)
(300)
(300)
(Inc.)/ Dec. in Investments
29
(231)
-
-
-
-
Inc./ (Dec.) in loans and adv.
-
-
-
-
-
-
Other income
-
-
-
-
-
-
Cash Flow from Investing
(961)
(1,002)
(653)
(753)
(300)
(300)
Issue of Equity
-
-
(3)
-
-
-
Inc./(Dec.) in loans
(989)
(908)
1,413
(192)
(0)
(0)
Dividend Paid (Incl. Tax)
(134)
(129)
(201)
(214)
(214)
(214)
Others
1,738
1,733
(2,612)
(362)
23
24
Cash Flow from Financing
615
696
(1,403)
(768)
(192)
(190)
Inc./(Dec.) in Cash
866
(18)
(525)
(13)
321
1,078
Opening Cash balances
700
1,566
1,548
1,023
1,010
1,331
Closing Cash balances
1,566
1,548
1,023
1,010
1,331
2,409
November 4, 2015
9
United Phosphorus | 2QFY2016 Result Update
Key Ratios
Y/E March
FY2012
FY2013
FY2014
FY2015
FY2016E
FY2017E
Valuation Ratio (x)
P/E (on FDEPS)
36.9
26.3
18.5
16.8
14.0
11.6
P/CEPS
24.3
17.9
13.3
12.2
10.3
8.9
P/BV
5.0
4.3
3.7
3.3
2.7
2.3
Dividend yield (%)
0.6
0.6
0.6
0.6
0.6
0.6
EV/Sales
3.4
2.9
2.4
2.1
1.8
1.5
EV/EBITDA
21.0
18.0
13.9
11.6
10.3
8.6
EV / Total Assets
3.1
2.7
2.9
2.7
2.4
2.0
Per Share Data (`)
EPS (Basic)
12.2
17.0
24.3
26.7
32.1
38.5
EPS (fully diluted)
12.2
17.0
24.3
26.7
32.1
38.5
Cash EPS
18.5
25.0
33.8
36.7
43.4
50.4
DPS
2.5
2.5
2.5
2.5
2.5
2.5
Book Value
90.4
105.0
122.4
136.7
163.8
197.4
DuPont Analysis
EBIT margin
13.7
13.8
15.0
15.0
14.4
14.7
Tax retention ratio
82.4
78.5
81.1
82.7
80.0
80.0
Asset turnover (x)
1.4
1.4
1.5
1.6
1.7
1.8
ROIC (Post-tax)
15.8
15.4
18.5
20.3
19.6
21.3
Cost of Debt (Post Tax)
11.3
8.9
11.2
15.1
10.4
10.4
Leverage (x)
0.5
0.5
0.5
0.3
0.3
0.1
Operating ROE
18.0
18.6
21.9
22.0
21.9
22.6
Returns (%)
ROCE (Pre-tax)
14.4
14.4
17.7
19.9
19.8
20.5
Angel ROIC (Pre-tax)
19.5
20.0
23.2
24.7
24.6
26.7
ROE
14.2
17.1
21.0
20.6
21.4
21.3
Turnover ratios (x)
Asset Turnover (Gross Block)
1.8
1.8
1.9
1.9
2.0
2.2
Inventory / Sales (days)
78
78
83
86
85
85
Receivables (days)
93
102
83
86
85
85
Payables (days)
102
108
69
72
70
70
WCcycle (ex-cash) (days)
105
96
92
78
82
89
Solvency ratios (x)
Net debt to equity
0.5
0.4
0.6
0.4
0.3
0.2
Net debt to EBITDA
2.1
1.5
1.8
1.0
0.8
0.6
Interest Coverage (EBIT / Int.)
2.5
3.0
3.3
3.5
5.5
6.4
November 4, 2015
10
United Phosphorus | 2QFY2016 Result Update
Research Team Tel: 022 - 39357800
DISCLAIMER
Angel Broking Private Limited (hereinafter referred to as “Angel”) is a registered Member of National Stock Exchange of India Limited,
Bombay Stock Exchange Limited and Metropolitan Stock Exchange of India Limited. It is also registered as a Depository Participant with
CDSL and Portfolio Manager with SEBI. It also has registration with AMFI as a Mutual Fund Distributor. Angel Broking Private Limited is
a registered entity with SEBI for Research Analyst in terms of SEBI (Research Analyst) Regulations, 2014 vide registration number
INH000000164. Angel or its associates has not been debarred/ suspended by SEBI or any other regulatory authority for accessing
/dealing in securities Market. Angel or its associates including its relatives/analyst do not hold any financial interest/beneficial
ownership of more than 1% in the company covered by Analyst. Angel or its associates/analyst has not received any compensation /
managed or co-managed public offering of securities of the company covered by Analyst during the past twelve months. Angel/analyst
has not served as an officer, director or employee of company covered by Analyst and has not been engaged in market making activity
of the company covered by Analyst.
This document is solely for the personal information of the recipient, and must not be singularly used as the basis of any investment
decision. Nothing in this document should be construed as investment or financial advice. Each recipient of this document should
make such investigations as they deem necessary to arrive at an independent evaluation of an investment in the securities of the
companies referred to in this document (including the merits and risks involved), and should consult their own advisors to determine
the merits and risks of such an investment.
Reports based on technical and derivative analysis center on studying charts of a stock's price movement, outstanding positions and
trading volume, as opposed to focusing on a company's fundamentals and, as such, may not match with a report on a company's
fundamentals.
The information in this document has been printed on the basis of publicly available information, internal data and other reliable
sources believed to be true, but we do not represent that it is accurate or complete and it should not be relied on as such, as this
document is for general guidance only. Angel Broking Pvt. Limited or any of its affiliates/ group companies shall not be in any way
responsible for any loss or damage that may arise to any person from any inadvertent error in the information contained in this report.
Angel Broking Pvt. Limited has not independently verified all the information contained within this document. Accordingly, we cannot
testify, nor make any representation or warranty, express or implied, to the accuracy, contents or data contained within this document.
While Angel Broking Pvt. Limited endeavors to update on a reasonable basis the information discussed in this material, there may be
regulatory, compliance, or other reasons that prevent us from doing so.
This document is being supplied to you solely for your information, and its contents, information or data may not be reproduced,
redistributed or passed on, directly or indirectly.
Neither Angel Broking Pvt. Limited, nor its directors, employees or affiliates shall be liable for any loss or damage that may arise from
or in connection with the use of this information.
Note: Please refer to the important ‘Stock Holding Disclosure' report on the Angel website (Research Section). Also, please refer to the
latest update on respective stocks for the disclosure status in respect of those stocks. Angel Broking Pvt. Limited and its affiliates may
have investment positions in the stocks recommended in this report.
Disclosure of Interest Statement
UPL
1. Analyst ownership of the stock
No
2. Angel and its Group companies ownership of the stock
No
3. Angel and its Group companies' Directors ownership of the stock
No
4. Broking relationship with company covered
No
Note: We have not considered any Exposure below ` 1 lakh for Angel, its Group companies and Directors
Ratings (Based on expected returns
Buy (> 15%)
Accumulate (5% to 15%)
Neutral (-5 to 5%)
over 12 months investment period):
Reduce (-5% to -15%)
Sell (< -15)
November 4, 2015
11