2QFY2016 Result Update | Logistics
October 31, 2015
Transport Corporation of India
NEUTRAL
CMP
`280
Performance Highlights
Target Price
-
Quarterly Data (Standalone)
Investment Period
-
(` cr)
2QFY16
2QFY15
% yoy
1QFY15
% qoq
Revenue
556
556
(0.0)
548
1.4
EBITDA
44
41
7.2
41
5.8
Stock Info
Margin (%)
7.9
7.3
53bp
7.5
33bp
Sector
Logistics
Reported PAT
23
21
9.0
19
24.1
Market Cap (` cr)
2,131
Source: Company, Angel Research
Net Debt (` cr)
286
Transport Corporation of India Ltd (TCIL)’s earnings has come in below our
Beta
1.6
estimates, for 2QFY2016. The top-line was flat on a yoy basis, mainly due to
52 Week High / Low
322 / 199
poor performance of all business segments, barring Seaways, which reported a
Avg. Daily Volume
42,736
growth of ~11% yoy. On the operating front, the company showed a slight
Face Value (`)
2
improvement in margins. Further, lower interest costs boosted the overall
BSE Sensex
26,838
profitability.
Nifty
8,112
Muted standalone top-line performance: TCIL’s earnings for the quarter
Reuters Code
TCIL.BO
have come in below our estimates. The top-line, at ~`556cr (our estimate was of
Bloomberg Code
TRPC@IN
~`625cr), is flat on a yoy basis, with all business segments posting poor
performances, barring Seaways, which reported a growth of ~11% yoy to `32cr.
Shareholding Pattern (%)
Slight improvement in operating margin and lower interest costs boost overall
Promoters
66.5
PAT: For the quarter, the company reported an operating profit of ~`44cr, up
MF / Banks / Indian Fls
6.5
~7% yoy. Further, the company’s operating margin expanded by 53bp yoy to
FII / NRIs / OCBs
2.9
7.9%, primarily on account of decline in operating expenses as a percentage of
Indian Public / Others
24.1
sales by 245bp yoy. The net profit grew by ~9% yoy to ~`23cr (which is below
our estimates of `25cr), mainly due to lower sales growth during the quarter.
Abs. (%)
3m 1yr
3yr
Outlook and valuation: TCIL benefits from its pan-India scale, which gives it
Sensex
2.3
10.3
44.0
competitive advantage in higher margin segments of the logistics industry; as well
as from its asset-light business model which cushions its profitability in cyclical
TCIL
9.2
28.0
340.5
downturns and gives it an attractive ROE profile. The company is well-placed to
be a key beneficiary of the anticipated implementation of the GST. However, in
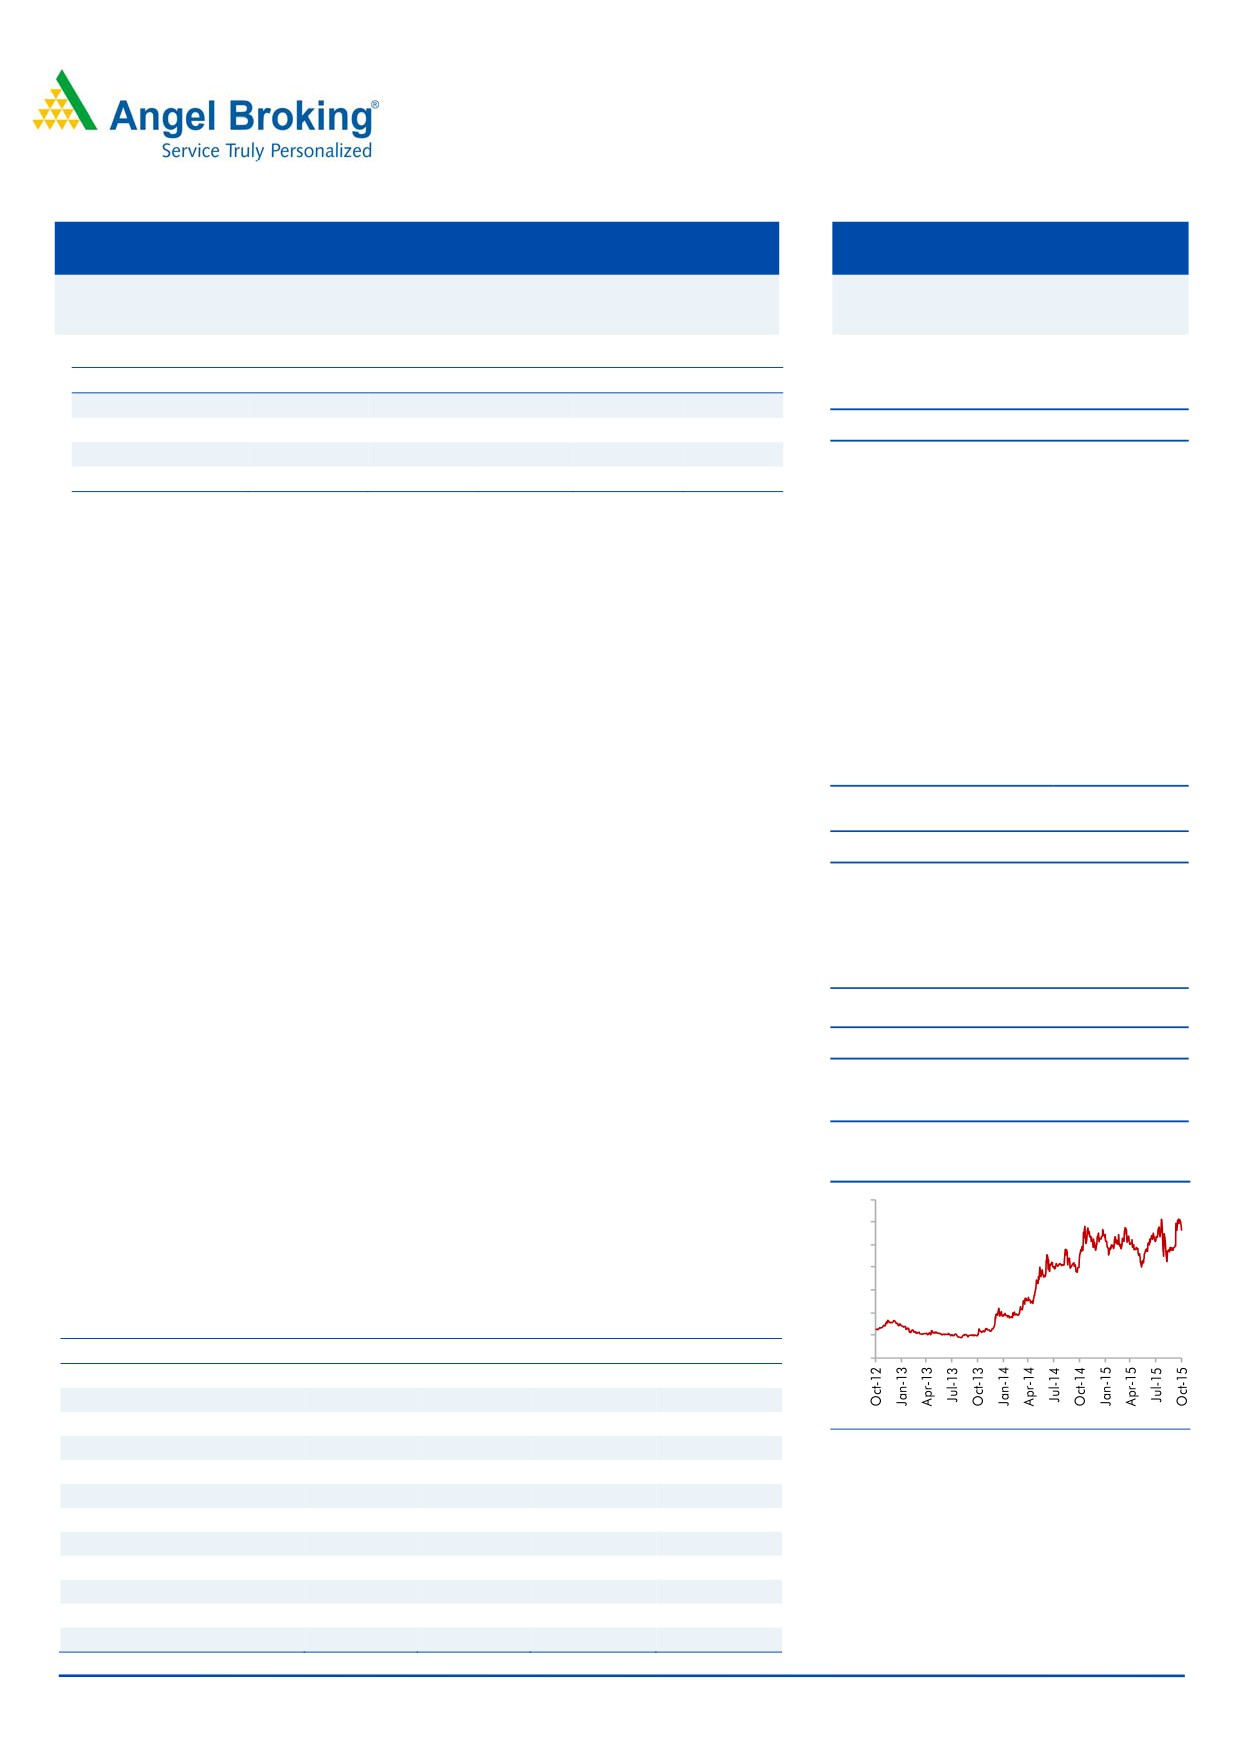
3-year price chart
the last few quarters, the company has not been able to report good numbers,
350
300
both on the top-line and bottom-line fronts, due to delay in pick-up in economic
250
activities. Hence we are downgrading our estimates. Currently, we have a
200
NEUTRAL rating on the stock.
150
100
Key financials (Consolidated)
50
Y/E March (` cr)
FY2014
FY2015
FY2016E
FY2017E
0
Net sales
2,228
2,417
2,570
2,851
% chg
4.5
8.4
6.3
10.9
Net profit
72
81
93
108
% chg
3.0
13.6
14.8
15.7
Source: Company, Angel Research
EBITDA margin (%)
7.6
8.0
8.3
8.5
EPS (`)
9.5
10.8
12.4
14.3
P/E (x)
29.9
26.3
22.9
19.8
P/BV (x)
4.4
3.5
3.1
2.8
RoE (%)
14.6
13.2
13.6
14.0
RoCE (%)
14.9
14.6
14.5
14.8
Amarjeet S Maurya
EV/Sales (x)
1.1
1.0
0.9
0.9
022-39357800 Ext: 6831
EV/EBITDA (x)
14.3
12.6
11.4
10.2
Source: Company, Angel Research, Note: CMP as of October 29, 2015
Please refer to important disclosures at the end of this report
1
Transport Corporation of India | 2QFY2016 Result Update
Exhibit 1: Standalone quarterly performance
Y/E March (` cr)
2QFY16
2QFY15
% yoy
1QFY15
% qoq
FY2015
FY2014
% chg
Net Sales
556
556
(0.01)
548
1.4
2,197
2,027
8.4
Operating Expense
437
451
(3.0)
439
(0.5)
1,765
1,641
7.5
(% of Sales)
78.6
81.1
80.1
80.3
81.0
Staff Costs
37
31
18.7
35
5.1
125
113
11.0
(% of Sales)
6.6
5.6
6.4
5.7
5.6
Other Expense
38
33
14.7
33
16.8
137
124
10.0
(% of Sales)
6.9
6.0
6.0
6.2
6.1
Total Expenditure
512
515
(0.6)
507
1.0
2,026
1,878
7.9
Operating Profit
44
41
7.2
41
5.8
170
149
14.1
OPM (%)
7.9
7.3
7.5
7.8
7.4
Interest
7
8
(15.4)
7
3.7
32
30
Depreciation
13
12
8.2
13
1.6
49
42
16.6
Other Income
6.2
6.7
(7.0)
4.0
55.1
12
6
116.4
PBT
30
27
10.2
26
16.0
101
83
22.2
Ext Income/(Expense)
0
-
PBT (incl. Ext Items)
30
27
10.2
26
(60.4)
101
83
22.0
(% of Sales)
5.4
4.9
4.7
4.6
4.1
Provision for Taxation
7
6
14.8
7
(5.4)
25
21
20.6
(% of PBT)
22.3
21.4
27.4
24.9
25.2
Minority Interest
Recurring PAT
23
21
9.0
19
24.1
76
62
22.5
PATM
4.2
3.8
3.4
3.5
3.1
Exceptional items
Reported PAT
23
21
9.0
19
24.1
76
62
22.5
Equity shares (cr)
7.6
7.6
7.6
7.6
7.6
FDEPS (`)
3.1
2.8
9.0
2.5
24.1
10.0
8.2
22.5
Source: Company, Angel Research
October 31, 2015
2
Transport Corporation of India | 2QFY2016 Result Update
Muted standalone top-line performance
For the quarter, TCIL reported a flat standalone top-line on a yoy basis of
~`556cr, owing to lower growth in Freight, XPS and Supply Chain Solutions
segments. The company’s Freight segment reported a growth of ~1% while the
XPS segment reported a de-growth of ~4% yoy. The Supply Chain Solutions
segment reported a subdued ~2% yoy growth due to slowdown in the automobile
sector (~75% of this segment’s business comes from the automobile sector).
However, TCIL reported a decent revenue growth of ~11% yoy in the Seaways
segment.
Exhibit 2: Top-line growth trend
Exhibit 3: Segment wise revenue trend
8
580
250
211
210
560
6
205
203.6
207.44
190
200
540
4
167
171
169
157
158
160.2
153151
147
151.3
520
2
150
159.5
159.0
500
-
100
480
(2)
50
30
34
36.9
32.0
460
(4)
28
29
2
3
1
1
1.8
2.6
0
1QFY15
2QFY15
3QFY15
4QFY15
1QFY16
2QFY16
Standalone Top-line
QoQ growth (%)
Freight
XPS Cargo
Wind Power
Supply Chain
Seaways
Source: Company, Angel Research
Source: Company, Angel Research
Operating margin expands due to lower operating expenses
For the quarter, the company reported an operating profit of ~`44cr, up ~7% yoy.
Further, the company’s operating margin expanded by 53bp yoy to
7.9%,
primarily on account of lower operating expenses, which declined by 245bp yoy as
a percentage of sales.
Exhibit 4: Operating profit and margin trend
50
9.0
45
8.0
40
7.0
35
6.0
30
5.0
25
4.0
20
3.0
15
2.0
10
5
1.0
0
0.0
Operating Profit
Margin (%)
Source: Company, Angel Research
October 31, 2015
3
Transport Corporation of India | 2QFY2016 Result Update
Slight improvement in operating margin and lower interest
costs boost overall PAT
In 2QFY2016, TCIL posted a earnings growth of ~9% yoy to ~`23cr, owing to
operating improvement and lower interest costs.
Exhibit 5: Net Profit and growth trend
25
50
40
20
30
15
20
10
10
-
(10)
5
(20)
0
(30)
PAT
QoQ growth (%)
Source: Company, Angel Research
October 31, 2015
4
Transport Corporation of India | 2QFY2016 Result Update
Investment rationale
Top-line to report 9% CAGR over FY2015-17E on economic
revival; eventual GST implementation would provide further
boost
We expect TCIL to report a healthy top-line growth of
~9% CAGR over
FY2015-17E on the back of revival in the Indian economy. Among TCIL’s four
business segments, we expect the Express segment to report ~12% CAGR. TCIL is
also well-placed to garner e-commerce business, as bulkier categories like
furniture and white goods see more traction in online sales. We expect the Supply
Chain Solutions segment to report a ~11% CAGR owing to recovery in the
automobile sector, growth in e-commerce fulfillment hubs, as well as new
customer wins due to increasing outsourcing of supply chain in other sectors like
FMCG, chemicals, cold storage, etc, especially once GST kicks in. The other two
segments, viz Freight and Seaways, are also likely to benefit from economic revival
and are expected to report ~5% and 13% CAGR respectively.
Stepped-up capex spending in higher margin businesses to aid
overall earnings growth trajectory
As the demand environment improves, we expect margins to improve across
segments for TCIL. Moreover, we expect the company to increase focus on higher
margin businesses like XPS and Supply Chain Solutions. As a result, the revenue
contribution of these businesses is expected to increase from ~56% in FY2014 to
~61% in FY2017E, with the company having aggressive expansion plans in these
businesses (`500cr capex over FY2015-17E). As a result, we expect overall
margins to improve from 8% in FY2015 to 9% in FY2017, thereby driving a
30% CAGR in net profits over the same period.
Well positioned due to its Asset light business model
TCIL operates on an asset light business model where it owns 20% of the total fleet
and leases the remaining 80%. The company has scaled its business model to
7,000 trucks/trailers/reefer vehicles as of today. On the same lines, TCIL has been
prudent in managing warehousing space, as a majority of its total 10mn sq ft of
warehousing space is on lease basis. With its focus to invest less on building the
asset base, the company has been able to generate healthy return ratios even in
the worst phases of business cycles. Given the company’s unlevered business
model, we are of the view that the long-term growth prospects of the company
would not be impacted due to lack of capital availability.
TCIL is one of the few companies in Surface Transportation & Logistics space,
which has consistently enjoyed a healthy asset turnover (FY2015 asset turnover
ratio at 4.8x) and ROE (FY2015 ROE at 13.3%). Given the strong matrices the
company displays, we are confident that TCIL at any phase of the business cycle
would be well positioned compared to its peers, which have levered business
models and have lower ROEs.
October 31, 2015
5
Transport Corporation of India | 2QFY2016 Result Update
Outlook and valuation
TCIL benefits from its pan-India scale, which gives it competitive advantage in
higher margin segments of the logistics industry; as well as from its asset-light
business model which cushions its profitability in cyclical downturns and gives it an
attractive ROE profile. The company is well-placed to be a key beneficiary of the
anticipated implementation of the GST. However, in the last few quarters the
company has not been able report good numbers, both on the top-line and
bottom-line fronts, due to delay in pick-up in economic activities. Hence we are
downgrading our estimates. Currently, we have a NEUTRAL rating on the stock.
Exhibit 6: One-year forward P/E band
600
500
400
300
200
100
0
Share Price
4x
8x
12x
16x
20x
Source: Company, Angel Research
Company Background
Transport Corporation of India Limited (TCI) is an integrated supply chain and
logistics solutions provider. The company operates in six business divisions: TCI
Freight, TCI XPS, TCI Supply Chain Solutions, TCI Seaways, TCI Global and TCI
Foundation. TCI Freight offers multimodal transport solutions for cargo of any
dimension. TCI XPS is a door-to-door express distribution specialist. TCI Supply
Chain Solutions provides supply chain solutions and services right from
conceptualization to implementation. TCI Seaways caters to the costal cargo
requirements for transporting container and bulk cargo from parts on the east
coast of India to Port Blair in the Andaman and Nicobar Islands and further
distribution within the islands. TCI Global provides a single window advantage to
its customers across all South East Asian countries.
October 31, 2015
6
Transport Corporation of India | 2QFY2016 Result Update
Consolidated Profit & Loss Statement
Y/E March (` cr)
FY2013
FY2014
FY2015
FY2016E
FY2017E
Total operating income
2,132
2,228
2,417
2,570
2,851
% chg
9.0
4.5
8.4
6.3
10.9
Total Expenditure
1,957
2,058
2,224
2,357
2,608
Personnel Expenses
112
117
130
146
171
Others Expenses
1,845
1,941
2,093
2,210
2,437
EBITDA
175
170
193
213
242
% chg
10.6
(2.7)
13.6
10.4
13.6
(% of Net Sales)
8.2
7.6
8.0
8.3
8.5
Depreciation & Amortisation
46
47
55
60
69
EBIT
128
123
139
153
174
% chg
10.3
(4.0)
12.5
10.3
13.6
(% of Net Sales)
6.0
5.5
5.7
6.0
6.1
Interest & other Charges
34
31
33
35
37
Other Income
6
7
9
14
16
(% of PBT)
6.3
7.2
7.9
10.6
10.5
Share in profit of Associates
-
-
-
-
-
Recurring PBT
101
99
114
132
153
% chg
18.1
(1.8)
15.2
15.3
15.6
Prior Period & Extra. Exp./(Inc.)
-
-
0
-
-
PBT (reported)
101
99
114
132
153
Tax
32
27
33
38
44
(% of PBT)
31.2
27.7
28.5
29.0
29.0
PAT (reported)
70
72
82
94
108
Add: Share of earnings of asso.
-
-
-
-
-
Less: Minority interest (MI)
0
0
0
0
0
PAT after MI (reported)
70
72
81
93
108
ADJ. PAT
70
72
82
93
108
% chg
16.8
3.0
13.6
14.8
15.7
(% of Net Sales)
3.3
3.2
3.4
3.6
3.8
Basic EPS (`)
9.2
9.5
10.8
12.4
14.3
Fully Diluted EPS (`)
9.2
9.5
10.8
12.4
14.3
% chg
16.8
3.0
13.6
14.8
15.7
October 31, 2015
7
Transport Corporation of India | 2QFY2016 Result Update
Consolidated Balance sheet
Y/E March (` cr)
FY2013
FY2014
FY2015
FY2016E FY2017E
SOURCES OF FUNDS
Equity Share Capital
15
15
15
15
15
Reserves& Surplus
422
476
601
674
756
Shareholders Funds
437
491
616
689
772
Minority Interest
1
3
3
3
3
Total Loans
354
336
336
366
406
Deferred Tax Liability
32
33
33
33
33
Total Liabilities
824
863
988
1,091
1,213
APPLICATION OF FUNDS
Gross Block
652
693
823
973
1,123
Less: Acc. Depreciation
234
262
316
376
445
Net Block
418
432
507
597
678
Capital Work-in-Progress
5
18
18
18
18
Investments
8
8
7
7
7
Current Assets
534
543
603
640
705
Inventories
2
2
2
2
2
Sundry Debtors
395
380
420
437
476
Cash
46
43
42
63
73
Loans & Advances
67
65
79
77
80
Other Assets
24
53
60
62
74
Current liabilities
141
138
148
171
195
Net Current Assets
393
405
455
469
510
Mis. Exp. not written off
-
-
-
-
-
Total Assets
824
863
988
1,091
1,213
October 31, 2015
8
Transport Corporation of India | 2QFY2016 Result Update
Consolidated Cash flow
Y/E March (` cr)
FY2013
FY2014
FY2015
FY2016E FY2017E
Profit before tax
101
99
114
132
153
Depreciation
46
47
55
60
69
Change in Working Capital
(46)
15
(51)
8
(31)
Interest / Dividend (Net)
29
25
33
35
37
Direct taxes paid
(26)
(28)
(33)
(38)
(44)
Others
0
0
-
-
-
Cash Flow from Operations
104
158
118
197
183
(Inc.)/ Dec. in Fixed Assets
(55)
(98)
(128)
(150)
(150)
(Inc.)/ Dec. in Investments
(6)
-
1
-
-
Cash Flow from Investing
(61)
(98)
(129)
(150)
(150)
Issue of Equity
1
1
60
-
-
Inc./(Dec.) in loans
13
(19)
-
30
40
Dividend Paid (Incl. Tax)
(8)
(12)
(16)
(21)
(26)
Interest / Dividend (Net)
(35)
(33)
(33)
(35)
(37)
Cash Flow from Financing
(28)
(63)
10
(26)
(23)
Inc./(Dec.) in Cash
15
(3)
(1)
21
10
Opening Cash balances
31
46
43
42
63
Closing Cash balances
46
43
42
63
73
October 31, 2015
9
Transport Corporation of India | 2QFY2016 Result Update
Key Ratios
Y/E March
FY2013
FY2014
FY2015
FY2016E
FY2017E
Valuation Ratio (x)
P/E (on FDEPS)
30.8
29.9
26.3
22.9
19.8
P/CEPS
18.5
18.1
15.7
13.9
12.1
P/BV
4.9
4.4
3.5
3.1
2.8
Dividend yield (%)
0.5
0.6
0.8
1.0
1.2
EV/Sales
1.1
1.1
1.0
0.9
0.9
EV/EBITDA
14.0
14.3
12.6
11.4
10.2
EV / Total Assets
2.5
2.4
2.1
1.9
1.8
Per Share Data (`)
EPS (Basic)
9.2
9.5
10.8
12.4
14.3
EPS (fully diluted)
9.2
9.5
10.8
12.4
14.3
Cash EPS
15.3
15.7
18.0
20.4
23.4
DPS
1.5
1.8
2.2
2.7
3.4
Book Value
57.8
64.9
81.4
91.1
102.0
Returns (%)
ROCE
16.2
14.9
14.6
14.5
14.8
Angel ROIC (Pre-tax)
17.4
15.9
15.4
15.5
15.8
ROE
15.9
14.6
13.2
13.6
14.0
Turnover ratios (x)
Asset Turnover (Gross Block)
5.1
5.2
4.8
4.3
4.2
Inventory / Sales (days)
0
0
0
0
0
Receivables (days)
68
62
63
62
61
Payables (days)
15
13
12
12
12
WC cycle (days)
53
50
52
50
49
Solvency ratios (x)
Net debt to equity
0.7
0.6
0.4
0.5
0.5
Net debt to EBITDA
1.7
1.7
1.3
1.5
1.4
Interest Coverage (EBIT / Int.)
3.8
4.0
4.4
4.8
5.7
October 31, 2015
10
Transport Corporation of India | 2QFY2016 Result Update
Research Team Tel: 022 - 39357800
DISCLAIMER
Angel Broking Private Limited (hereinafter referred to as “Angel”) is a registered Member of National Stock Exchange of India Limited,
Bombay Stock Exchange Limited and MCX Stock Exchange Limited. It is also registered as a Depository Participant with CDSL and
Portfolio Manager with SEBI. It also has registration with AMFI as a Mutual Fund Distributor. Angel Broking Private Limited is a
registered entity with SEBI for Research Analyst in terms of SEBI (Research Analyst) Regulations, 2014 vide registration number
INH000000164. Angel or its associates has not been debarred/ suspended by SEBI or any other regulatory authority for accessing
/dealing in securities Market. Angel or its associates including its relatives/analyst do not hold any financial interest/beneficial
ownership of more than 1% in the company covered by Analyst. Angel or its associates/analyst has not received any compensation /
managed or co-managed public offering of securities of the company covered by Analyst during the past twelve months. Angel/analyst
has not served as an officer, director or employee of company covered by Analyst and has not been engaged in market making activity
of the company covered by Analyst.
This document is solely for the personal information of the recipient, and must not be singularly used as the basis of any investment
decision. Nothing in this document should be construed as investment or financial advice. Each recipient of this document should
make such investigations as they deem necessary to arrive at an independent evaluation of an investment in the securities of the
companies referred to in this document (including the merits and risks involved), and should consult their own advisors to determine
the merits and risks of such an investment.
Reports based on technical and derivative analysis center on studying charts of a stock's price movement, outstanding positions and
trading volume, as opposed to focusing on a company's fundamentals and, as such, may not match with a report on a company's
fundamentals.
The information in this document has been printed on the basis of publicly available information, internal data and other reliable
sources believed to be true, but we do not represent that it is accurate or complete and it should not be relied on as such, as this
document is for general guidance only. Angel Broking Pvt. Limited or any of its affiliates/ group companies shall not be in any way
responsible for any loss or damage that may arise to any person from any inadvertent error in the information contained in this report.
Angel Broking Pvt. Limited has not independently verified all the information contained within this document. Accordingly, we cannot
testify, nor make any representation or warranty, express or implied, to the accuracy, contents or data contained within this document.
While Angel Broking Pvt. Limited endeavors to update on a reasonable basis the information discussed in this material, there may be
regulatory, compliance, or other reasons that prevent us from doing so.
This document is being supplied to you solely for your information, and its contents, information or data may not be reproduced,
redistributed or passed on, directly or indirectly.
Neither Angel Broking Pvt. Limited, nor its directors, employees or affiliates shall be liable for any loss or damage that may arise from
or in connection with the use of this information.
Note: Please refer to the important ‘Stock Holding Disclosure' report on the Angel website (Research Section). Also, please refer to the
latest update on respective stocks for the disclosure status in respect of those stocks. Angel Broking Pvt. Limited and its affiliates may
have investment positions in the stocks recommended in this report.
Disclosure of Interest Statement
Transport Corporation of India
1. Analyst ownership of the stock
No
2. Angel and its Group companies ownership of the stock
No
3. Angel and its Group companies' Directors ownership of the stock
No
4. Broking relationship with company covered
No
Note: We have not considered any Exposure below ` 1 lakh for Angel, its Group companies and Directors
Ratings (Based on expected returns
Buy (> 15%)
Accumulate (5% to 15%)
Neutral (-5 to 5%)
over 12 months investment period):
Reduce (-5% to -15%)
Sell (< -15%)
October 31, 2015
11