2QFY2016 Result Update | Steel
November 6, 2015
Tata Steel
NEUTRAL
CMP
`226
Performance Highlights
Target Price
-
Investment Period
-
Standalone (` cr)
2QFY16
2QFY15
yoy % 1QFY16
qoq %
Net revenue
9,531
10,785
(11.6)
9,094
4.8
EBITDA
1,862
3,094
(39.8)
1,689
10.2
Stock Info
Margin (%)
19.5
28.7
(916bp)
18.6
96bp
Sector
Steel
Adj. PAT
3,844
1,330
189.2
1,143
236.4
Market Cap (` cr)
21,911
Source: Company, Angel Research
Net Debt (` cr)
73,477
Raw Material purchases impact EBITDA: Tata Steel’s standalone revenues for
Beta
1.5
2QFY2016 declined
12% yoy to
`9,531cr
(7% ahead of our estimate of
52 Week High / Low
493/200
`8,879cr), led by better than expected volumes and pricing. However, increased
Avg. Daily Volume
87,13,227
raw material expenses on account of external purchases of iron ore resulted in the
Face Value (`)
10
EBITDA declining sharply by 40% yoy to `1,862cr, 3% below our expectation of
BSE Sensex
26,304
`1,918cr. The adjusted net profit nearly doubled to `3,844cr led by a sharp jump
Nifty
7,955
in other income on account of gains from sale of quoted investments of `3,505cr,
Reuters Code
TISC.BO
while interest expenses were lower on account of debt repayments in 1QFY2015.
Bloomberg Code
TATA IN
Consolidated (` cr)
2QFY16
2QFY15
yoy %
1QFY16
qoq %
Net revenue
29,305
35,777
(18.1)
30,300
(3.3)
Shareholding Pattern (%)
EBITDA
1,830
3,643
(49.8)
2,774
(34.0)
Margin (%)
6.2
10.2
(394bp)
9.2
(291bp)
Promoters
31.4
Adj. PAT
2,092
109
1,814.1
605
246.1
MF / Banks / Indian Fls
25.9
Source: Company, Angel Research
FII / NRIs / OCBs
11.8
Indian Public / Others
30.9
Overseas operations remain under pressure: The EBITDA of the European
operations turned negative, led by a steep decline in realisations and on account
of lower volumes. Tata Steel Europe (TSE)’s sales volumes declined 3% yoy to
Abs. (%)
3m 1yr
3yr
3.27MT, 7% below our expectation of 3.53MT. Realisation declined 20% yoy to
Sensex
(6.8)
(5.8)
40.2
$798/tonne, but 10% ahead of our estimate of $723/tonne. SEA volumes
Tata Steel
(14.0)
(52.8)
(43.3)
continued to remain under pressure, with deliveries declining 27% yoy to 0.69MT.
Outlook and valuation: Given the weak outlook on steel prices and with the
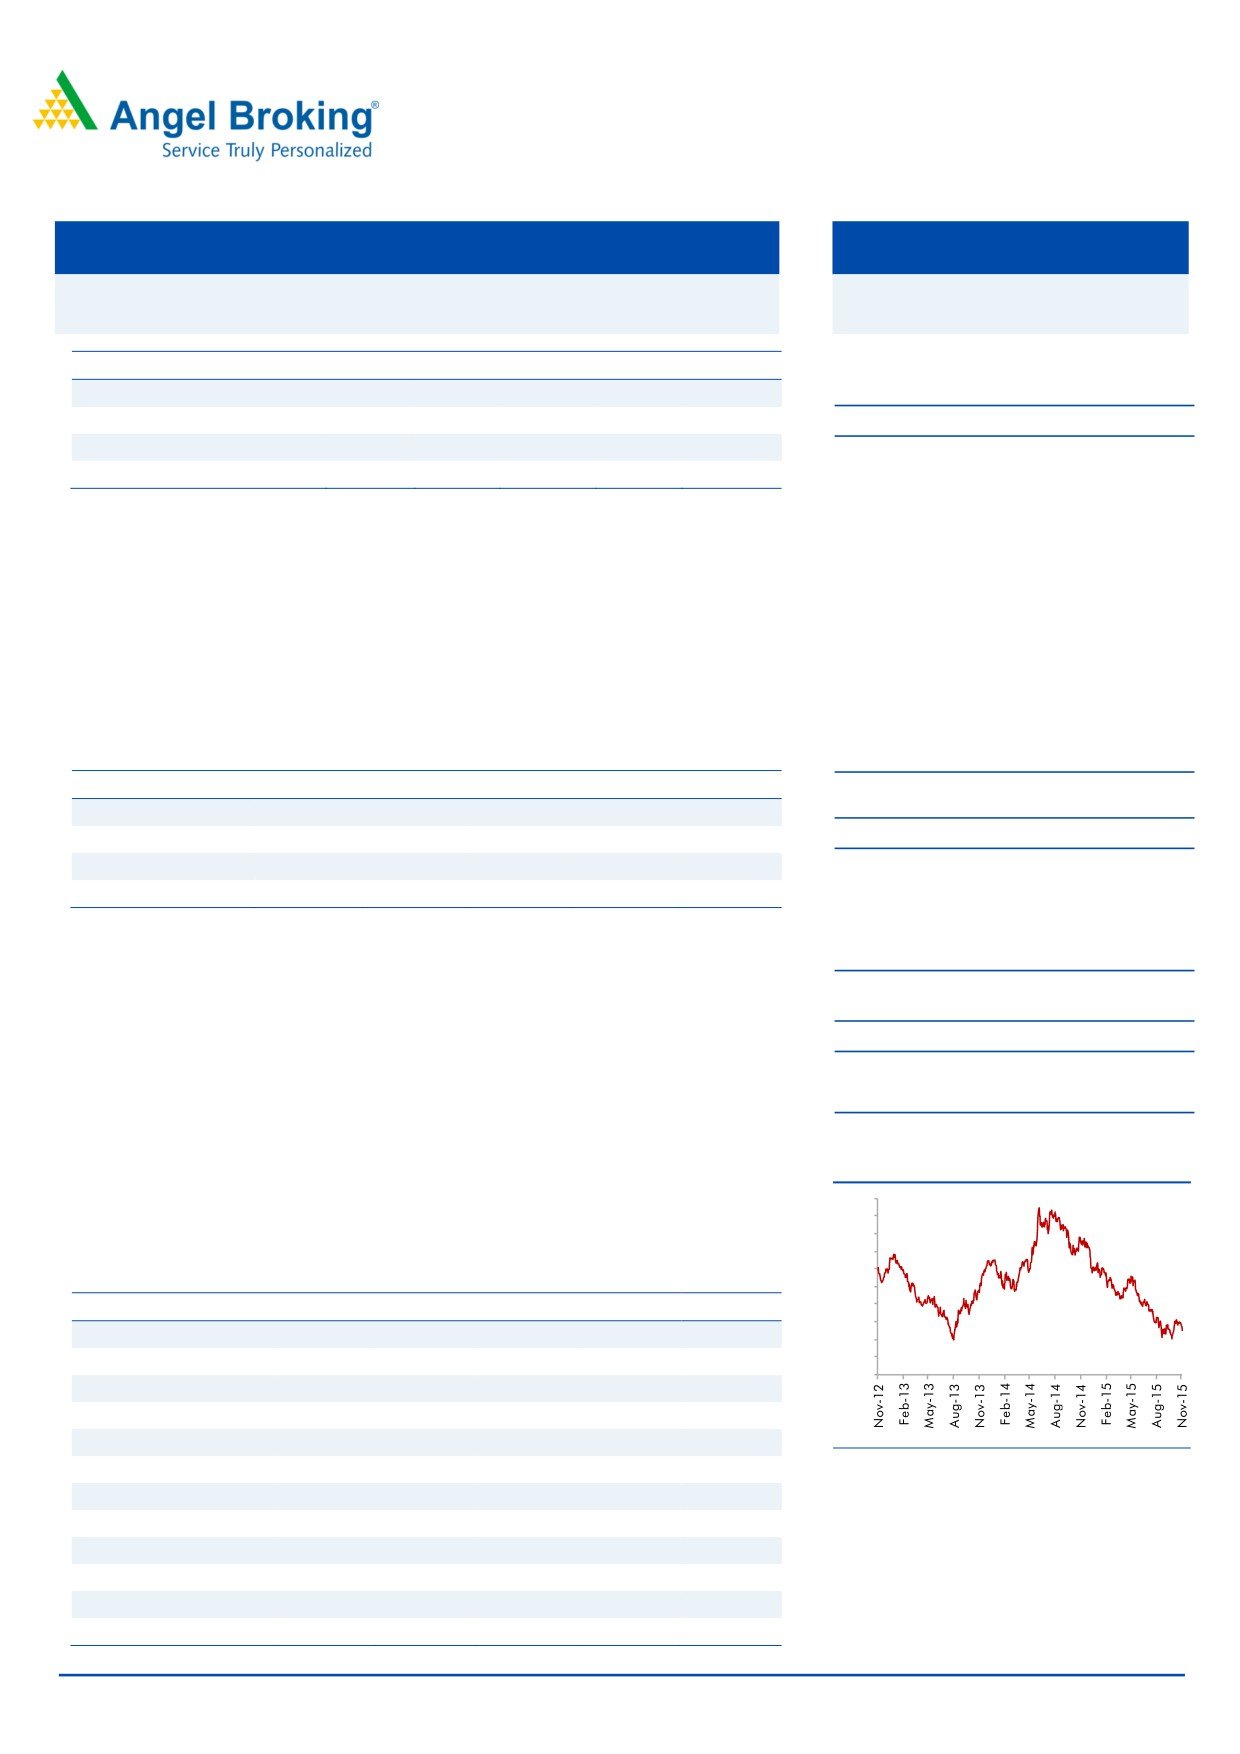
3-year price chart
European business already in the red at the operating level, we expect tough
600
times to continue for the stock. The stock is currently trading at an EV/EBITDA of
550
500
6.8x FY2017E EBITDA. We retain our Neutral rating on the stock.
450
400
Key financials (Consolidated)
350
Y/E March (` cr)
FY2013
FY2014
FY2015E FY2016E FY2017E
300
250
Net sales
1,34,712
1,48,614
1,39,504
1,23,985
1,30,520
200
150
% chg
1.4
10.3
(6.1)
(11.1)
5.3
100
Reported PAT
(7,058)
3,595
(3,926)
(2,473)
1,714
% chg
-
-
-
-
(169.3)
Adj. EPS (`)
3.4
37.3
0.0
(25.5)
17.6
Source: Company, Angel Research
EBITDA margin (%)
9.1
11.0
9.0
5.4
11.3
P/E (x)
66.0
6.0
-
(8.9)
12.8
P/BV (x)
0.6
0.5
0.7
0.8
0.8
RoE (%)
0.9
9.7
0.0
(8.4)
6.1
RoCE (%)
6.3
8.8
5.6
0.9
5.9
Rahul Dholam
EV/Sales (x)
0.6
0.6
0.6
0.8
0.8
Tel: 022- 3935 7800 Ext: 6847
EV/EBITDA (x)
6.3
5.5
7.2
14.7
6.8
Source: Company, Angel Research: Note CMP as of Nov 05, 2016
Please refer to important disclosures at the end of this report
1
Tata Steel | 2QFY2016 Result Update
Exhibit 1: 2QFY2016 performance (Standalone)
Y/E March (` Cr)
2QFY16
2QFY15
yoy %
1QFY16
qoq %
FY2015
FY2014
yoy %
Net Sales
9,531
10,785
(11.6)
9,094
4.8
41,785
41,711
0.2
- Consumption of Raw Material
2,936
2,594
13.2
2,368
24.0
11,651
9,875
18.0
(% of Net Sales)
30.8
24.0
26.0
27.9
23.7
- Power& Fuel
668
677
(1.3)
694
(3.7)
2,570
2,565
0.2
(% of Net Sales)
7.0
6.3
7.6
6.2
6.1
- Staff Costs
1,085
1,143
(5.1)
1,082
0.3
4,606
3,673
25.4
(% of Net Sales)
11.4
10.6
11.9
11.0
8.8
Freight & Handling
707
694
1.9
695
1.7
2,883
2,755
4.7
(% of Net Sales)
7.4
6.4
7.6
6.9
6.6
- Other expenses
2,272
2,582
(12.0)
2,565
(11.4)
10,065
10,026
0.4
(% of Net Sales)
23.8
23.9
28.2
24.1
24.0
Total Expenditure
7,670
7,691
(0.3)
7,405
3.6
31,776
28,894
10.0
EBITDA
1,862
3,094
(39.8)
1,689
10.2
10,009
12,817
(21.9)
EBITDA Margin (%)
19.5
28.7
18.6
24.0
30.7
Interest
331
489
(32.2)
396
(16.3)
1,976
1,821
8.5
Depreciation
481
475
1.4
468
2.7
1,998
1,929
3.6
Other Income
2,933
262
1,017.7
749
291.6
583
788
(26.0)
Exceptional Items
(1,322)
1,147
106
1,891
(142)
Profit before Tax
2,660
3,540
(24.8)
1,679
58.4
8,509
9,714
(12.4)
(% of Net Sales)
27.9
32.8
18.5
20.4
23.3
Tax
138
1,064
(87.1)
431
(68.1)
2,070
3,301
(37.3)
(% of PBT)
5.2
30.0
25.6
24.3
34.0
Net income
2,523
2,476
1.9
1,249
102.1
6,439
6,412
0.4
Adjusted net income
3,844
1,330
189.2
1,143
236.4
4,548
6,554
(30.6)
Source: Company, Angel Research
Exhibit 2: 2QFY2016 Standalone - Actual vs Angel estimates
(` cr)
Actual
Estimates
Variation (%)
Net sales
9,531
8,879
7.3
EBITDA
1,862
1,918
(2.9
EBITDA margin (%)
19.5
21.6
(207bp)
Source: Company, Angel Research
Result highlights - Standalone
External raw material purchases impact EBITDA
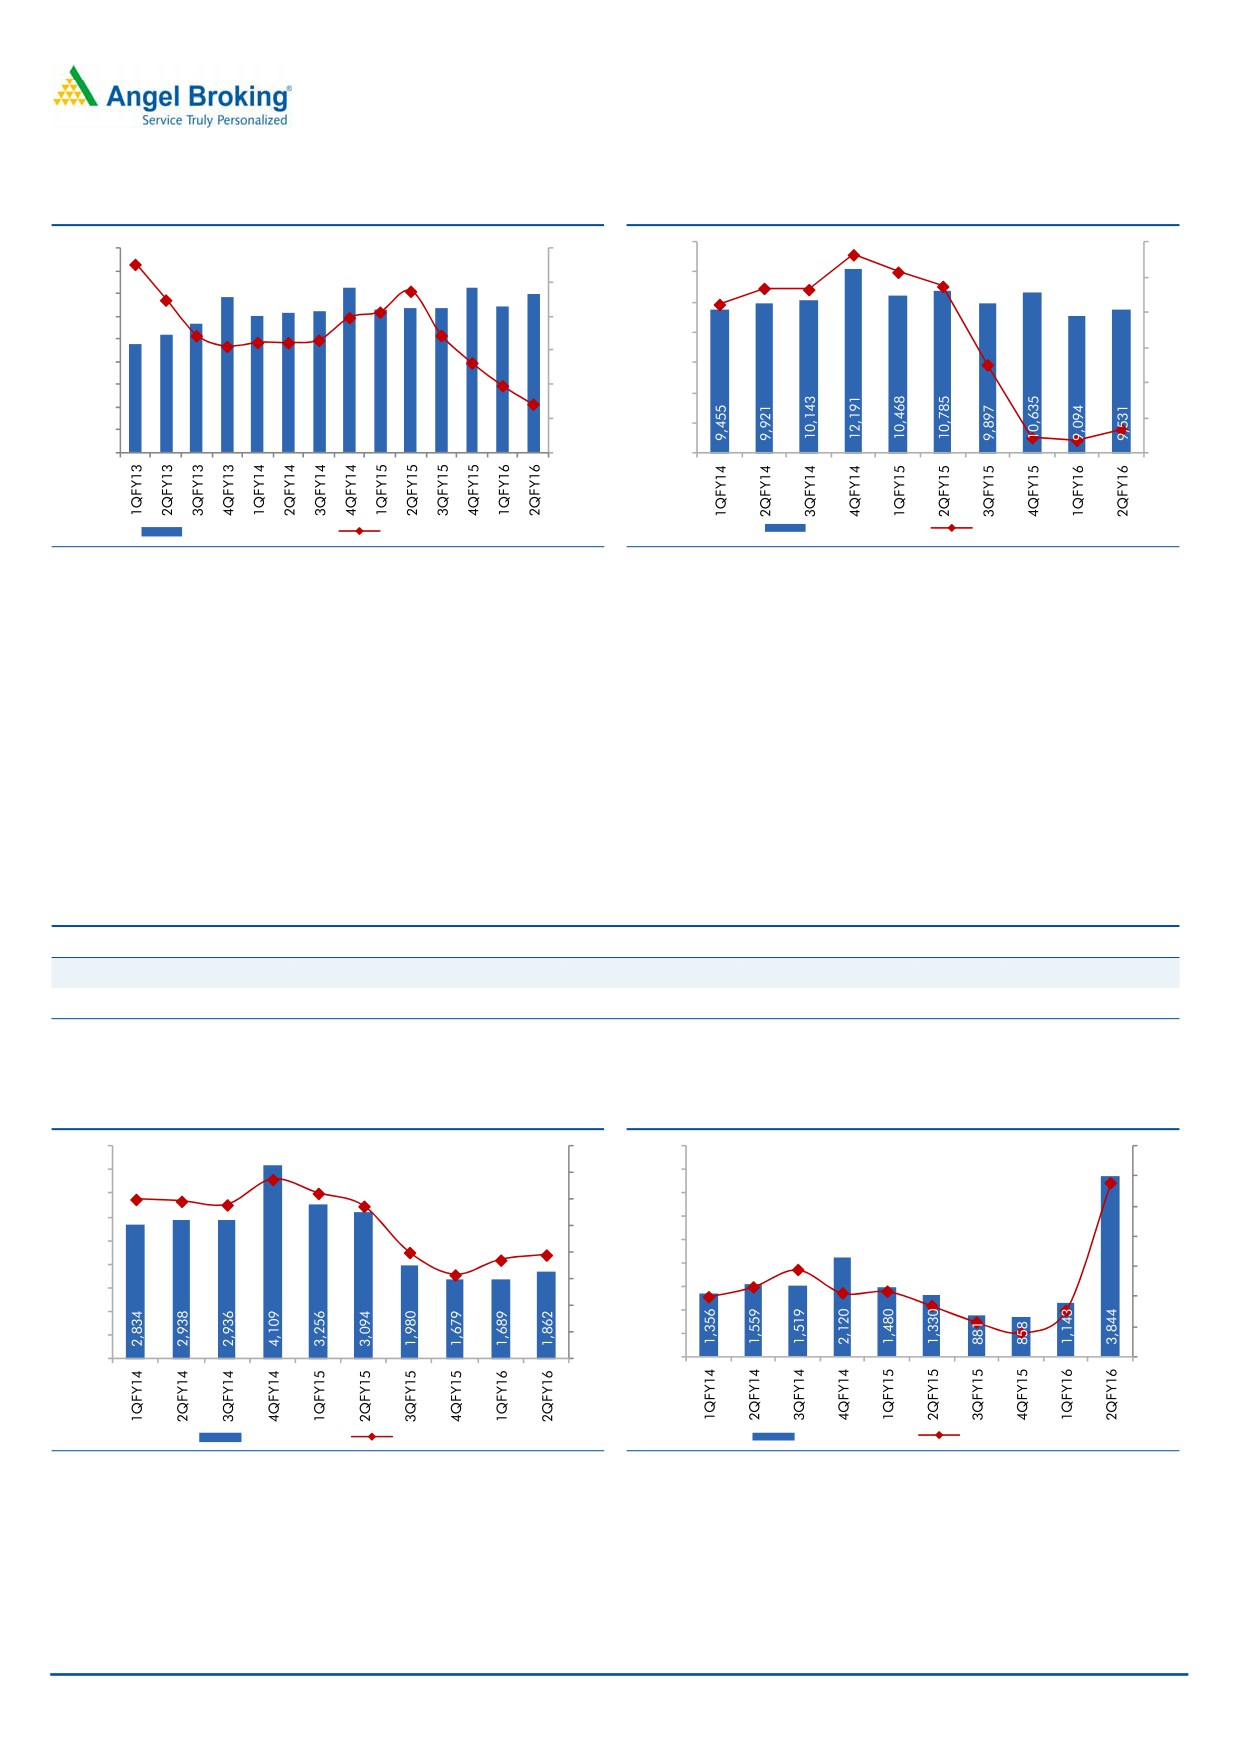
Standalone revenues declined by 12% yoy and 5% on a sequential basis to
`9,531cr (7% ahead of our estimate of `8,879cr). Standalone sales volume
increased 11% yoy to 2.33MT, well ahead of our expectation of 2.15MT, while
blended realisation declined by 20% to `40,853/tonne, but 7% higher than our
estimate of `38,058/tonne. Steel realisation declined 20% to `39,286, lower than
the decline in domestic average landed HRC prices, which declined 38% on a yoy
basis.
November 6, 2015
2
Tata Steel | 2QFY2016 Result Update
Exhibit 3: Blended realisation continues to fall
Exhibit 4: Top-line declines ~12% yoy
14,000
15
53,000
3.0
51,000
2.4
2.4
12,000
2.3
2.3
10
2.5
2.1
2.1
2.1
2.1
49,000
2.0
2.0
2.1
1.9
10,000
47,000
1.7
2.0
5
1.6
8,000
45,000
1.5
0
43,000
6,000
41,000
1.0
-5
4,000
39,000
0.5
2,000
-10
37,000
35,000
0.0
0
-15
Sales Volume (MT)
Realisation (`/tonne)
Revenue (` cr)
yoy change (%)
Source: Company, Angel Research
Source: Company, Angel Research
Raw material expenses, at `2,937cr (~31% of revenues), were ahead of our
estimates on account of external purchases of iron as operations at the Naomundi
mine were suspension for a major part of the quarter. Staff, power and freight
expenses too came in ahead of our expectations, resulting in the EBITDA seeing a
sharp decline of 40% yoy to `1,862cr, 3% below our expectation of `1,918cr,
despite revenue being ahead of our expectations. The adjusted net profit nearly
doubled to `3,844cr, led by a sharp jump in other income on account of gains
from sale of quoted investments of `3,505cr, while interest expenses were lower on
account of debt repayments in 1QFY2015.
Exhibit 5: Quarterly Performance Trend (Standalone)
1QFY14
2QFY14
3QFY14
4QFY14
1QFY15
2QFY15
3QFY15
4QFY15
1QFY16
2QFY16
Realisation (US$/tonne)
799
720
725
759
775
813
731
689
644
605
EBITDA (US$/tonne)
258
232
229
276
259
242
150
112
124
123
Source: Company, Angel Research
Exhibit 6: EBITDA margin inches up qoq to ~20%
Exhibit 7: Other income boosts net profit
4,500
40
4,500
250
33.7
189.2
4,000
31.1
35
4,000
30.0
29.6
200
28.9
28.7
3,500
3,500
30
150
3,000
3,000
20.0
25
18.6
19.5
100
2,500
2,500
15.8
20
45.1
2,000
2,000
16.2
6.4
9.1
50
15
(0.0)
1,500
1,500
(14.7)
(22.8)
(42.0)
0
1,000
10
1,000
(59.5)
(50)
500
5
500
0
0
0
(100)
EBITDA (` cr)
Margin (%)
Net Profit (` cr)
yoy change (%)
Source: Company, Angel Research
Source: Company, Angel Research
November 6, 2015
3
Tata Steel | 2QFY2016 Result Update
Exhibit 8: 2QFY2016 performance (Consolidated)
Y/E March (` Cr)
2QFY16
2QFY15
% chg (yoy)
1QFY16
% chg (qoq)
FY2015
FY2014
yoy %
Net Sales
29,305
35,777
(18.1)
30,300
(3.3)
1,39,504
1,48,614
(6.1)
- Consumption of Raw Material
11,290
14,096
(19.9)
11,045
2.2
55,667
62,737
(11.3)
(% of Net Sales)
38.5
39.4
36.5
39.9
42.2
- Power& Fuel
1,379
1,528
(9.7)
1,448
(4.8)
5,913
6,036
(2.0)
(% of Net Sales)
4.7
4.3
4.8
4.2
4.1
- Staff Costs
4,990
5,399
(7.6)
4,896
1.9
21,408
20,303
5.4
(% of Net Sales)
17.0
15.1
16.2
15.3
13.7
Freight & Handling
2,045
2,190
(6.6)
2,031
0.7
8,811
9,008
(2.2)
(% of Net Sales)
7.0
6.1
6.7
6.3
6.1
- Other expenses
7,770
8,920
(12.9)
8,106
(4.1)
35,168
34,119
3.1
(% of Net Sales)
26.5
24.9
26.8
25.2
23.0
Total Expenditure
27,474
32,134
(14.5)
27,526
(0.2)
1,26,968
1,32,203
(4.0)
EBITDA
1,830
3,643
(49.8)
2,774
(34.0)
12,536
16,411
(23.6)
EBITDA Margin (%)
6.2
10.2
9.2
9.0
11.0
Interest
1,049
1,233
(14.9)
1,098
(4.5)
4,848
4,337
11.8
Depreciation
1,371
1,430
(4.1)
1,347
1.8
5,944
5,841
1.8
Other Income
2,938
322
813.8
762
285.5
796
517
54.1
Exceptional Items
(564)
1,145
158
(3,929)
(28)
Profit before Tax
1,785
2,447
(27.0)
1,250
42.8
(1,388)
6,722
(120.6)
(% of Net Sales)
6.1
6.8
4.1
(1.0)
4.5
Tax
240
1,175
(79.6)
515
(53.4)
2,567
3,058
(16.0)
(% of PBT)
13.5
48.0
41.2
(185.0)
45.5
Profit after Tax
1,545
1,272
21.5
735
110.3
(3,955)
3,664
(208.0)
Share of profit
(16)
(15)
21
13
(70)
Minority interest
(1)
(3)
7
17
1
Profit after Tax
1,529
1,254
21.9
763
100.4
(3,926)
3,595
(209.2)
(% of Net Sales)
5.2
3.5
2.5
(2.8)
2.4
Adjusted net income
2,092
109
1,814.1
605
246.1
3
3,623
(99.9)
Source: Company, Angel Research
Exhibit 9: Consolidated - 2QFY2015 Actual vs Angel estimates
(` cr)
Actual
Estimates
Variation (%)
Net sales
29,305
28,504
2.8
EBITDA
1,830
2,632
(30.5)
EBITDA margin (%)
6.2
9.2
(299)bp
Source: Company, Angel Research
November 6, 2015
4
Tata Steel | 2QFY2016 Result Update
Result highlights - Consolidated
Overseas operations remain under pressure
On a consolidated basis, the company’s net sales declined by ~18% yoy to
`29,305cr (~3% ahead of our estimate of `28,504cr). The EBITDA however came
in much lower than expected at `1,830cr, 31% lower than our estimate of
`2,632cr, on account of the EBITDA loss at the European business.
Tata Steel Europe (TSE)’s sales volumes declined 3% yoy to 3.27MT, 7% below our
expectation of 3.53MT. Realisation declined 20% yoy to $798/tonne, but was 10%
ahead of our estimate of $723/tonne. TSE however reported an EBITDA level loss
of `139cr as against an EBITDA profit of `929cr in 2QFY2015 and vs our
expectation of a profit of `984cr. Europe EBITDA continued to get affected by
adverse currency movement of the GBP against the USD and EUR, and pressure
from imports. The Management indicated that steel demand in increasing at a
slower pace than expected and that most of the incremental demand would be
catered to by imports.
SEA volumes continued to remain under pressure, with deliveries declining 27%
yoy to
0.69MT. However, SEA operations posted an EBITDA of
`70cr for
2QFY2016, as against an EBITDA loss of `281cr in 2QFY2015. The other
subsidiaries saw a steep sequential decline in EBITDA at `91cr as against `476cr
in 1QFY2016.
Exhibit 10: Quarterly Performance Trend (Tata Steel Europe)
1QFY14
2QFY14
3QFY14
4QFY14
1QFY15
2QFY15
3QFY15
4QFY15
1QFY16
2QFY16
Deliveries (MT)
3.1
3.5
3.2
4.1
3.2
3.4
3.3
3.8
3.4
3.3
Realisation (US$/tonne)
2
2
2
2
2
2
2
2
2
2
EBITDA (US$/tonne)
777.0
554.0
860.0
817.0
995.0
929.0
1008.0
1053.0
575.0
-139.0
Source: Company, Angel Research
Exhibit 11: Quarterly Performance Trend (SEA)
1QFY14
2QFY14
3QFY14
4QFY14
1QFY15
2QFY15
3QFY15
4QFY15
1QFY16
2QFY16
Deliveries (MT)
0.86
0.96
1.09
1.07
1.08
0.95
0.80
0.76
0.69
0.69
Revenue (` Cr)
3,908
4,179
4,537
4,365
4,045
3,710
2,831
2,461
2,262
2,001
EBITDA (` Cr)
93
129
137
80
30
(281)
(18)
(232)
34
70
Source: Company, Angel Research
November 6, 2015
5
Tata Steel | 2QFY2016 Result Update
Investment arguments
Capacity expansion remains on track
Tata Steel is setting up a 6mn-tonne integrated steel plant (including cold rolling
mill) in two phases of 3mn tonne each. The Kalinganagar Steel Plant is a state-of-
the-art steel plant that will increase production capacity, widen the product
portfolio and help Tata Steel to diversify the customer base. Commercial
production at Phase-1 of the new Kalinganagar plant is expected to commence in
this quarter. The Management expects ramp up to remain slow as it is a greenfield
capacity. We factor in an additional production of just 0.5MT for FY2016, in-line
with the guidance. We expect an additional production of 1MT over each of the
next two fiscals, leading to a CAGR of ~10% in production volumes.
Outlook for steel prices continues to remain negative
Steel prices continue to remain under pressure led by Chinese exports and
depreciation of the Russian ruble. Demand continues to remain weak across the
world. The World Steel Association has forecasted steel demand to decline 1.7% in
CY2015 and increase marginally
(0.7%) in CY2016. Chinese demand is
forecasted to fall by 3.5% and 2% in CY2015 and CY2016 respectively. Global
supply of iron ore also continues to remain strong, with the iron ore majors
continuing to increase production. We therefore expect prices on the raw material
side to also remain under pressure resulting in downward pressure on product
prices.
November 6, 2015
6
Tata Steel | 2QFY2016 Result Update
Outlook and valuation
Given the weak outlook on steel prices and with the European business already in
the red at the operating level, we expect tough times to continue for the stock. The
stock is currently trading at an EV/EBITDA of 6.8x FY2017E EBITDA. We retain our
Neutral view on the stock.
Company background
Incorporated in 1907, Tata Steel is the world's tenth largest steel company and the
world's second most geographically diversified steel producer with major
operations in India and Europe. During April 2007, the company acquired Corus
(now Tata Steel Europe), the second largest steel producer in Europe, for a
consideration of US$12bn. Its India operations’ capacity stands at ~13mn tonne,
while its European operations’ capacity stands at ~17MT.
November 6, 2015
7
Tata Steel | 2QFY2016 Result Update
Profit & Loss Statement (Consolidated)
Y/E March (` Cr)
FY2013
FY2014
FY2015E
FY2016E
FY2017E
Total operating income
1,34,712
1,48,614
1,39,504
1,23,985
1,30,520
% chg
1.4
10.3
(6.1)
(11.1)
5.3
Total Expenditure
1,22,390
1,32,203
1,26,968
1,17,303
1,15,791
Net raw materials
60,536
62,737
55,667
44,050
43,946
Other mfg costs
12,988
15,044
14,725
11,159
11,747
Personnel
18,918
20,303
21,408
20,032
20,777
Other
29,948
34,119
35,168
42,062
39,320
EBITDA
12,321
16,411
12,536
6,682
14,729
% chg
(0.8)
33.2
(23.6)
(46.7)
120.4
(% of Net Sales)
9.1
11.0
9.0
5.4
11.3
Depreciation& Amortisation
5,575
5,841
5,944
6,897
8,024
EBIT
6,746
10,570
6,592
(215)
6,706
% chg
(14.6)
56.7
(37.6)
(103.3)
(3,224.7)
(% of Net Sales)
5.0
7.1
4.7
(0.2)
5.1
Interest & other Charges
3,968
4,337
4,848
4,854
4,973
Other Income
479
517
796
1,336
800
(% of PBT)
14.7
7.7
31.3
(35.8)
31.6
Share in profit of Associates
-
-
-
-
-
Recurring PBT
3,257
6,750
2,541
(3,733)
2,533
% chg
(37.6)
107.2
(62.4)
(246.9)
(167.9)
Extra. Inc/(Expense)
(7,390)
(28)
(3,929)
0
0
PBT (reported)
(4,133)
6,722
(1,388)
(3,733)
2,533
Tax
3,229
3,058
2,567
(1,232)
836
(% of PBT)
(78.1)
45.5
(185.0)
33.0
33.0
PAT (reported)
(7,362)
3,664
(3,955)
(2,501)
1,697
Add: Share of earnings of asso.
90
1
17
19
22
Less: Minority interest (MI)
214
(70)
13
8
(6)
PAT after MI (reported)
(7,058)
3,595
(3,926)
(2,473)
1,714
ADJ. PAT
332
3,623
3
(2,473)
1,714
% chg
(83.6)
990.3
(99.9)
(78,623.3)
(169.3)
(% of Net Sales)
0.2
2.4
0.0
(2.0)
1.3
November 6, 2015
8
Tata Steel | 2QFY2016 Result Update
Balance Sheet (Consolidated)
Y/E March (` Cr)
FY2013
FY2014
FY2015E
FY2016E
FY2017E
SOURCES OF FUNDS
Equity Share Capital
971
984
984
984
984
Reserves & Surplus
33,201
39,561
30,378
26,768
27,343
Shareholders Funds
34,172
40,532
31,349
27,740
28,314
Share Warrants
21
20
20
20
20
Hybrid perpetual securities
2,275
2,275
2,275
2,275
2,275
Minority Interest
1,669
1,738
1,704
1,695
1,701
Total Loans
68,507
81,609
80,701
83,201
84,701
Deferred Tax Liability
3,155
2,596
2,885
2,885
2,885
Other LT liabilities
6,477
7,994
9,211
9,211
9,211
Total Liabilities
1,16,277
1,36,764
1,28,145
1,27,027
1,29,107
APPLICATION OF FUNDS
Gross Block
1,34,774
1,56,143
1,77,511
1,90,331
2,00,588
Less: Acc. Depreciation
79,838
96,984
1,02,928
1,09,825
1,17,849
Net Block
54,937
59,158
74,583
80,506
82,740
Capital Work-in-Progress
14,277
26,822
8,788
8,110
9,996
Goodwill
13,065
15,749
13,408
13,408
13,408
Investments
3,258
5,093
3,455
3,063
2,106
Current Assets
53,464
55,321
52,220
45,746
46,401
Cash
9,834
8,605
8,750
3,674
3,952
Loans & Advances
4,061
3,193
4,603
4,603
4,603
Other
38,085
42,886
38,460
37,062
37,439
Current liabilities
30,636
34,881
30,800
30,298
32,035
Net Current Assets
22,829
20,440
21,420
15,448
14,366
Mis. Exp. not written off
0
0
0
0
0
Total Assets
1,16,277
1,36,764
1,28,145
1,27,027
1,29,107
November 6, 2015
9
Tata Steel | 2QFY2016 Result Update
Cash flow statement (Consolidated)
Y/E March (` Cr)
FY2013
FY2014
FY2015E FY2016E FY2017E
Profit before tax
(4,133)
6,722
(1,388)
(3,733)
2,533
Depreciation
5,575
5,841
5,944
6,897
8,024
Change in Working Capital
3,841
(1,270)
(834)
895
1,361
Less: Other income
11,321
4,865
2,712
-
-
Direct taxes paid
(2,569)
(3,013)
(2,567)
1,232
(836)
Cash Flow from Operations
14,035
13,146
3,866
5,291
11,081
(Inc.)/ Dec. in Fixed Assets
(15,222)
(16,126)
(3,334)
(12,143)
(12,143)
(Inc.)/ Dec. in Investments
1,926
(326)
1,638
393
957
(Inc.)/ Dec. in loans and advances
-
-
-
-
-
Other income
Cash Flow from Investing
(13,297)
(16,451)
(1,696)
(11,750)
(11,186)
Issue of Equity
262
12
-
-
-
Inc./(Dec.) in loans
2,918
5,875
(908)
2,500
1,500
Dividend Paid (Incl. Tax)
(1,359)
(924)
(1,117)
(1,117)
(1,117)
Others
(3,602)
(3,948)
-
-
-
Cash Flow from Financing
(1,780)
1,015
(2,025)
1,383
383
Other Adjustments
198
1,073
-
-
-
Inc./(Dec.) in Cash
(844)
(1,218)
145
(5,076)
278
Opening Cash balances
10,513
9,669
8,605
8,750
3,674
Closing Cash balances
9,669
8,451
8,750
3,674
3,952
November 6, 2015
10
Tata Steel | 2QFY2016 Result Update
Key ratios
Y/E March
FY2013
FY2014
FY2015E
FY2016E
FY2017E
Valuation Ratio (x)
P/E (on FDEPS)
66.0
6.0
6,957.1
(8.9)
12.8
P/CEPS
-
2.3
10.9
5.0
2.3
P/BV
0.6
0.5
0.7
0.8
0.8
P/BV (ex Goodwill)
1.0
0.9
1.2
1.5
1.5
Dividend yield (%)
-
4.4
4.4
4.4
4.4
EV/Sales
0.6
0.6
0.6
0.8
0.8
EV/EBITDA
6.3
5.5
7.2
14.7
6.8
EV/Total Assets
0.7
0.7
0.7
0.8
0.8
Per Share Data (`)
EPS (Basic)
3.4
37.3
(40.4)
(25.5)
17.6
Adjusted EPS (fully diluted)
3.4
37.3
0.0
(25.5)
17.6
Cash EPS
(15.3)
97.1
20.8
45.5
100.2
DPS
8.0
10.0
10.0
10.0
10.0
Book Value
351.8
417.2
322.7
285.6
291.5
Book Value (adj. for Goodwill)
217.3
255.1
184.7
147.5
153.5
Dupont Analysis
EBIT margin
5.0
7.1
4.7
(0.2)
5.1
Tax retention ratio (%)
178.1
54.5
285.0
67.0
67.0
Asset turnover (x)
1.4
1.4
1.2
1.0
1.1
ROIC (Post-tax)
12.0
5.4
15.9
(0.1)
3.6
Cost of Debt (Post Tax)
13.1
3.6
19.1
4.3
4.2
Leverage (x)
1.7
1.8
2.3
2.9
2.9
Operating ROE
10.2
8.8
8.8
(12.8)
2.1
Returns (%)
ROCE (Pre-tax)
6.3
8.8
5.6
0.9
5.9
Angel ROIC (Pre-tax)
23.8
27.3
20.3
14.1
23.5
ROE
0.9
9.7
0.0
(8.4)
6.1
Turnover ratios (x)
Asset Turnover (Gross Block)
1.1
1.0
0.8
0.7
0.7
Inventory (days)
73
69
74
74
74
Receivables (days)
39
36
38
38
38
Payables (days)
53
51
54
54
54
WC cycle (ex-cash) (days)
34
30
32
36
31
Solvency ratios (x)
Net debt to equity
1.7
1.8
2.3
2.9
2.9
Net debt to EBITDA
4.8
4.4
5.7
11.9
5.5
Interest Coverage (EBIT / Int.)
1.7
2.4
1.4
(0.0)
1.3
November 6, 2015
11
Tata Steel | 2QFY2016 Result Update
Research Team Tel: 022 - 39357800
DISCLAIMER
Angel Broking Private Limited (hereinafter referred to as “Angel”) is a registered Member of National Stock Exchange of India Limited,
Bombay Stock Exchange Limited and MCX Stock Exchange Limited. It is also registered as a Depository Participant with CDSL and
Portfolio Manager with SEBI. It also has registration with AMFI as a Mutual Fund Distributor. Angel Broking Private Limited is a
registered entity with SEBI for Research Analyst in terms of SEBI (Research Analyst) Regulations, 2014 vide registration number
INH000000164. Angel or its associates has not been debarred/ suspended by SEBI or any other regulatory authority for accessing
/dealing in securities Market. Angel or its associates including its relatives/analyst do not hold any financial interest/beneficial
ownership of more than 1% in the company covered by Analyst. Angel or its associates/analyst has not received any compensation /
managed or co-managed public offering of securities of the company covered by Analyst during the past twelve months. Angel/analyst
has not served as an officer, director or employee of company covered by Analyst and has not been engaged in market making activity
of the company covered by Analyst.
This document is solely for the personal information of the recipient, and must not be singularly used as the basis of any investment
decision. Nothing in this document should be construed as investment or financial advice. Each recipient of this document should
make such investigations as they deem necessary to arrive at an independent evaluation of an investment in the securities of the
companies referred to in this document (including the merits and risks involved), and should consult their own advisors to determine
the merits and risks of such an investment.
Reports based on technical and derivative analysis center on studying charts of a stock's price movement, outstanding positions and
trading volume, as opposed to focusing on a company's fundamentals and, as such, may not match with a report on a company's
fundamentals.
The information in this document has been printed on the basis of publicly available information, internal data and other reliable
sources believed to be true, but we do not represent that it is accurate or complete and it should not be relied on as such, as this
document is for general guidance only. Angel Broking Pvt. Limited or any of its affiliates/ group companies shall not be in any way
responsible for any loss or damage that may arise to any person from any inadvertent error in the information contained in this report.
Angel Broking Pvt. Limited has not independently verified all the information contained within this document. Accordingly, we cannot
testify, nor make any representation or warranty, express or implied, to the accuracy, contents or data contained within this document.
While Angel Broking Pvt. Limited endeavors to update on a reasonable basis the information discussed in this material, there may be
regulatory, compliance, or other reasons that prevent us from doing so.
This document is being supplied to you solely for your information, and its contents, information or data may not be reproduced,
redistributed or passed on, directly or indirectly.
Neither Angel Broking Pvt. Limited, nor its directors, employees or affiliates shall be liable for any loss or damage that may arise from
or in connection with the use of this information.
Note: Please refer to the important ‘Stock Holding Disclosure' report on the Angel website (Research Section). Also, please refer to the
latest update on respective stocks for the disclosure status in respect of those stocks. Angel Broking Pvt. Limited and its affiliates may
have investment positions in the stocks recommended in this report.
Disclosure of Interest Statement
Tata Steel
1. Analyst ownership of the stock
No
2. Angel and its Group companies ownership of the stock
No
3. Angel and its Group companies' Directors ownership of the stock
No
4. Broking relationship with company covered
No
Note: We have not considered any Exposure below ` 1 lakh for Angel, its Group companies and Directors
Ratings (Based on expected returns
Buy (> 15%)
Accumulate (5% to 15%)
Neutral (-5 to 5%)
over 12 months investment period):
Reduce (-5% to -15%)
Sell (< -15)
November 6, 2015
12