3QFY2016 Result Update | Automobile
February 1, 2016
TVS Motor Company
ACCUMULATE
CMP
`295
Performance Highlights
Target Price
`322
Y/E Mar. (` cr) - Standalone 3QFY16 3QFY15
% chg (yoy) 2QFY16
% chg (qoq)
Investment Period
12 Months
Net Sales
2,940
2,639
11.4
2,881
2.0
EBITDA
202
160
26.3
212
(4.6)
Stock Info
EBITDA margin (%)
6.9
6.1
80 bp
7.4
(50 bp)
Sector
Automobile
Net Profit
113
90
25.7
116
(2.6)
Market Cap (` cr)
14,032
Source: Company, Angel Research
Net Debt (` cr)
965
In line numbers adjusted for one offs: TVS Motor Company (TVSM)’s 3QFY2016
Beta
0.9
results adjusted for one-off items have come in in line with our estimates.
52 Week High / Low
315/201
Revenues grew 11% yoy to `2,940cr, driven majorly by an 8% yoy growth in
Avg. Daily Volume
236,430
volumes. Market share gains on back of success of new launches enabled TVSM
Face Value (`)
1.0
to post healthy volume growth during the quarter. Realisation/vehicle grew about
BSE Sensex
24,825
3% yoy to `41,868 driven by a better product mix. During the quarter TVSM
Nifty
7,556
reported one-off expenses of `12.4cr (`7.5cr towards damages caused by
Reuters Code
TVSM.BO
Chennai floods and `4.9cr towards increase in bonus expenses retrospectively
Bloomberg Code
TVSL@IN
from April 2015). Adjusted for one-off items, the operating margin came in at
7.3% which is in line with our estimate. The adjusted net profit at `120.7cr was
in line with our estimates.
Shareholding Pattern (%)
Promoters
57.4
Outlook and valuation: The two wheeler industry is expected to recover in
MF / Banks / Indian Fls
15.4
FY2017 on back of implementation of Seventh pay commission and recovery in
FII / NRIs / OCBs
13.4
the rural demand. Also, TVS Motor is likely to continue gaining market share on
Indian Public / Others
13.8
back of new product launches and expanding geographical presence. Further,
the realization/vehicle is likely to improve given the increased proportion of the
non-moped segment. TVSM margins are also likely to improve as volumes pick
Abs. (%)
3m 1yr 3yr
up, given the benefits of operating leverage, gradual reduction in marketing
Sensex
(6.9)
(14.9)
25.5
expenses and reduction in material prices due to better vendor negotiations. We
TVS Motor
11.3
(4.2)
593.3
expect TVS Motor to report revenue and Net profit growth of 16% and 53%
respectively in FY2017. We maintain our positive view on the stock and assign
“Accumulate” rating on the stock with a revised price target of `322 (based on
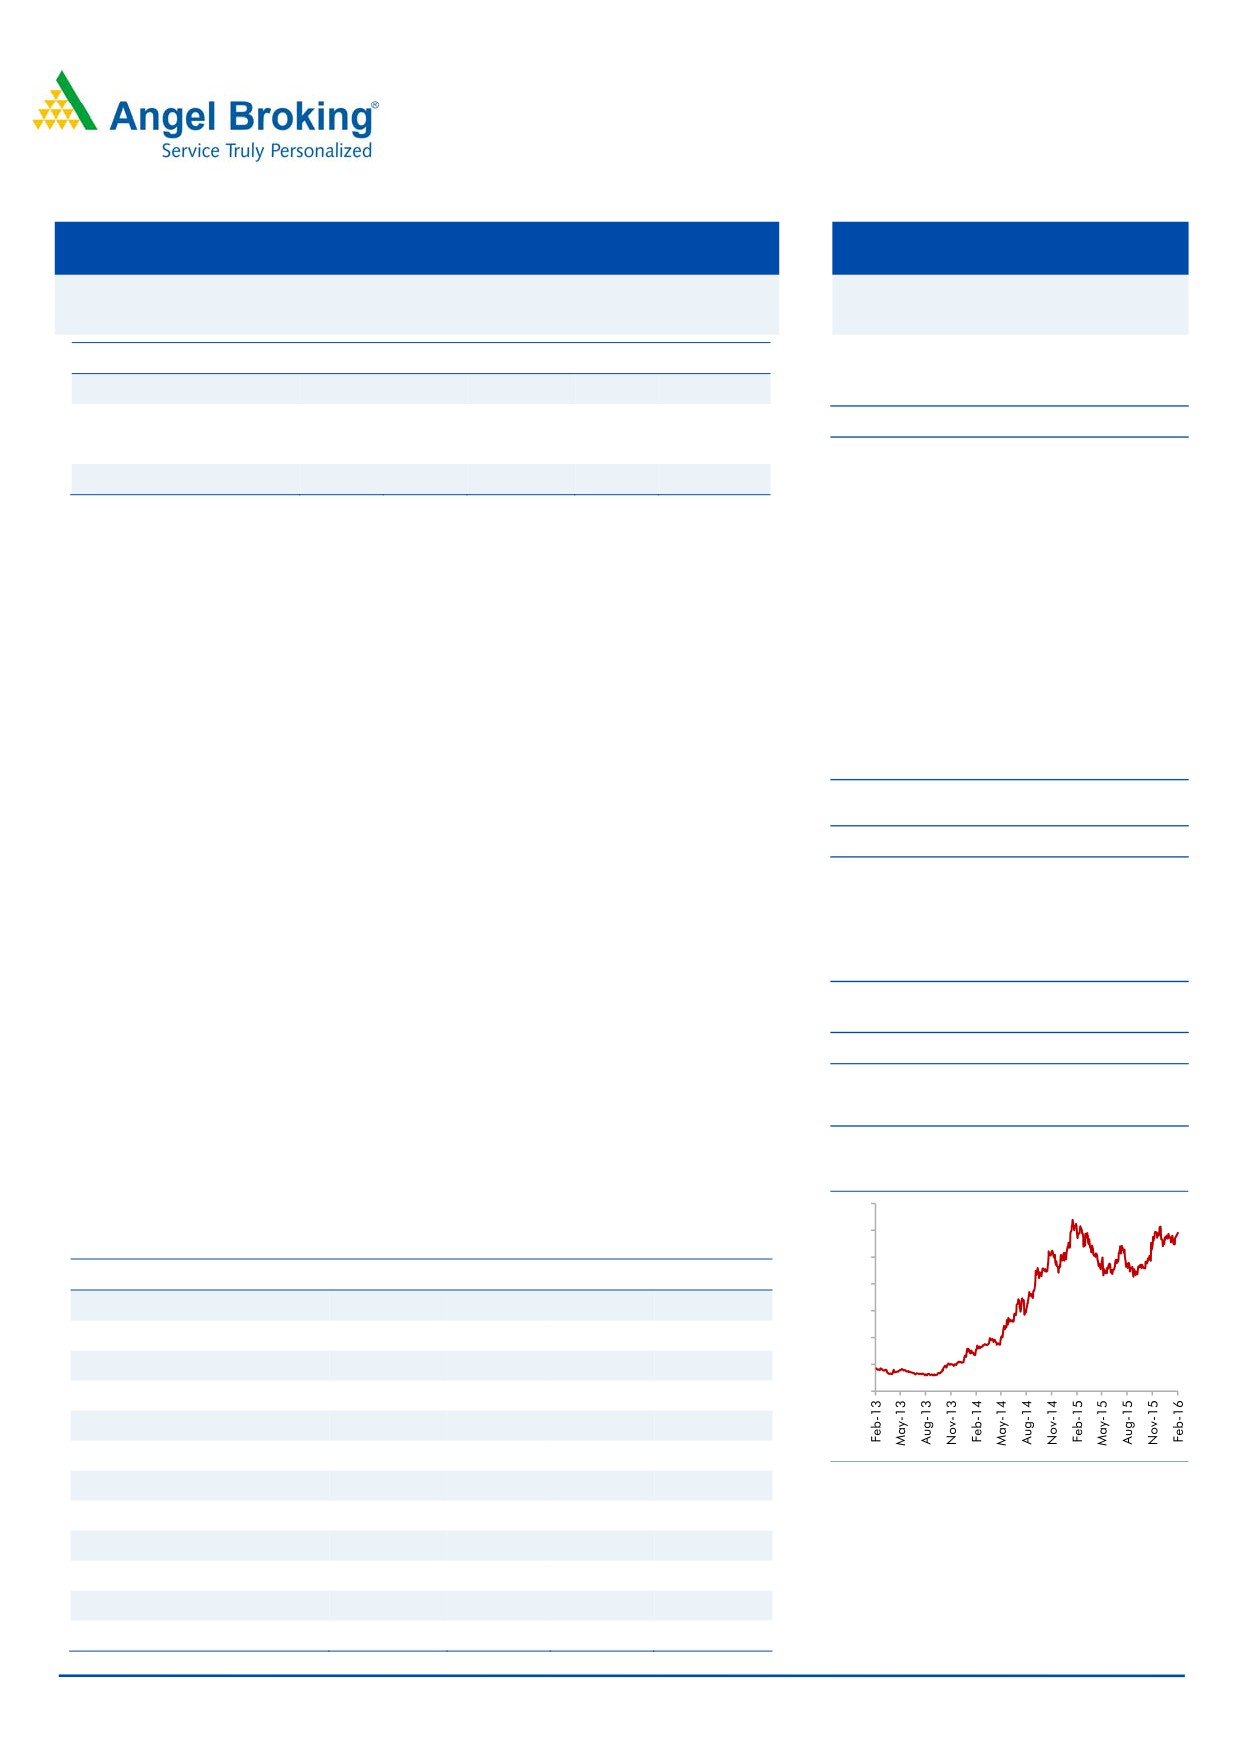
3-year price chart
350
22x FY2017 earnings).
300
Key financials (Standalone)
250
Y/E March (` cr)
FY2014
FY2015 FY2016E
FY2017E
200
Net Sales
7,962
10,069
11,263
13,106
150
% chg
11.1
26.4
11.9
16.4
100
Adj. net Profit
260
356
436
696
50
0
% chg
25.9
35.3
22.3
59.7
EBITDA (%)
6.1
6.1
6.9
8.3
EPS (`)
5.5
7.5
9.2
14.6
Source: Company, Angel Research
P/E (x)
53.2
39.3
32.2
20.1
P/BV (x)
9.9
8.5
7.3
4.8
RoE (%)
18.6
21.7
22.7
29.1
RoCE (%)
13.6
13.7
15.5
20.3
Bharat Gianani
EV/Sales (x)
1.8
1.5
1.3
1.1
022-3935 7800 Ext: 6817
EV/EBITDA (x)
29.9
24.6
19.1
13.5
Source: Company, Angel Research
Please refer to important disclosures at the end of this report
1
TVS Motor Company | 3QFY2016 Result Update
Exhibit 1: Quarterly financial performance (Standalone)
Y/E March (` cr)
3QFY16
3QFY15
% chg (yoy)
2QFY16
% chg (qoq)
9MFY16 9MFY15
% chg (yoy)
Net Sales
2,940
2,639
11.4
2,881
2.0
8,429
7,612
10.7
Consumption of RM
2,106
1,938
8.7
2,054
2.5
6,048
5,576
8.5
(% of Sales)
71.6
73.4
71.3
71.8
73.3
Staff Costs
169
155
9.1
166
2.0
490
450
9.1
(% of Sales)
5.8
5.9
5.8
5.8
5.9
Other Expenses
463
386
19.8
449
3.1
1,312
1,129
16.2
(% of Sales)
15.7
14.6
15.6
15.6
14.8
Total Expenditure
2,737
2,479
10.4
2,669
2.6
7,851
7,155
9.7
Operating Profit
202
160
26.3
212
(4.6)
578
457
26.4
OPM (%)
6.9
6.1
7.4
6.9
6.0
Interest
10
5
89.0
10
(1.6)
33
15
125.9
Depreciation
49
37
32.9
47
5.8
138
107
28.7
Other Income
12
6
100.0
6
104.9
27
20
33.4
Profit Before Tax
155
124
25.1
161
(3.9)
434
356
22.0
(% of Sales)
5.3
4.7
5.6
5.1
4.7
Provision for Taxation
41
34
23.3
45
(7.1)
114
98
15.7
(% of PBT)
26.7
27.1
27.7
26.2
27.6
Reported PAT
108
90
19.4
116
(7.5)
314
257
22.2
Exceptional items
(6)
-
-
(6)
-
PAT after exceptionals
113
90
25.7
116
(2.6)
320
257
24.4
Adj. PATM
3.9
3.4
4.0
3.8
3.4
Equity capital (cr)
47.5
47.5
-
47.5
-
47.5
47.5
-
Reported EPS (`)
2.3
1.9
19.4
2.5
(7.5)
6.6
5.4
22.2
Adjusted EPS (`)
2.4
1.9
25.7
2.5
(2.6)
6.7
5.4
24.4
Source: Company, Angel Research
Exhibit 2: 3QFY2016 - Actual vs Angel estimates
Y/E March (` cr)
Actual
Estimates
Variation (%)
Net Sales
2,940
2,935
0.2
EBITDA
202
215
(5.9)
EBITDA margin (%)
6.9
7.3
(40 bp)
Net Profit
113
124
(8.5)
Source: Company, Angel Research
Exhibit 3: Quarterly volume performance
Volumes
3QFY16
3QFY15
yoy%
2QFY16
qoq%
9MFY16
9MFY15
yoy%
Domestic motorcycles
190,195
171,786
10.7
172,713
10.1
538,331
514,806
4.6
Domestic scooters
220,352
181,361
21.5
205,579
7.2
582,906
517,058
12.7
Domestic Mopeds
179,594
190,608
(5.8)
169,554
5.9
532,568
562,990
(5.4)
Domestic two wheelers
590,141
543,755
8.5
547,846
7.7
1,653,805
1,594,854
3.7
Exports two wheelers
85,743
83,778
2.3
97,231
(11.8)
275,042
240,505
14.4
Total two wheelers
675,884
627,533
7.7
645,077
4.8
1,928,847
1,835,359
5.1
Three wheelers
26,225
28,015
(6.4)
32,922
(20.3)
89,376
80,943
10.4
Total volumes
702,109
655,548
7.1
677,999
3.6
2,018,223
1,916,302
5.3
Source: Company, Angel Research
February 1, 2016
2
TVS Motor Company | 3QFY2016 Result Update
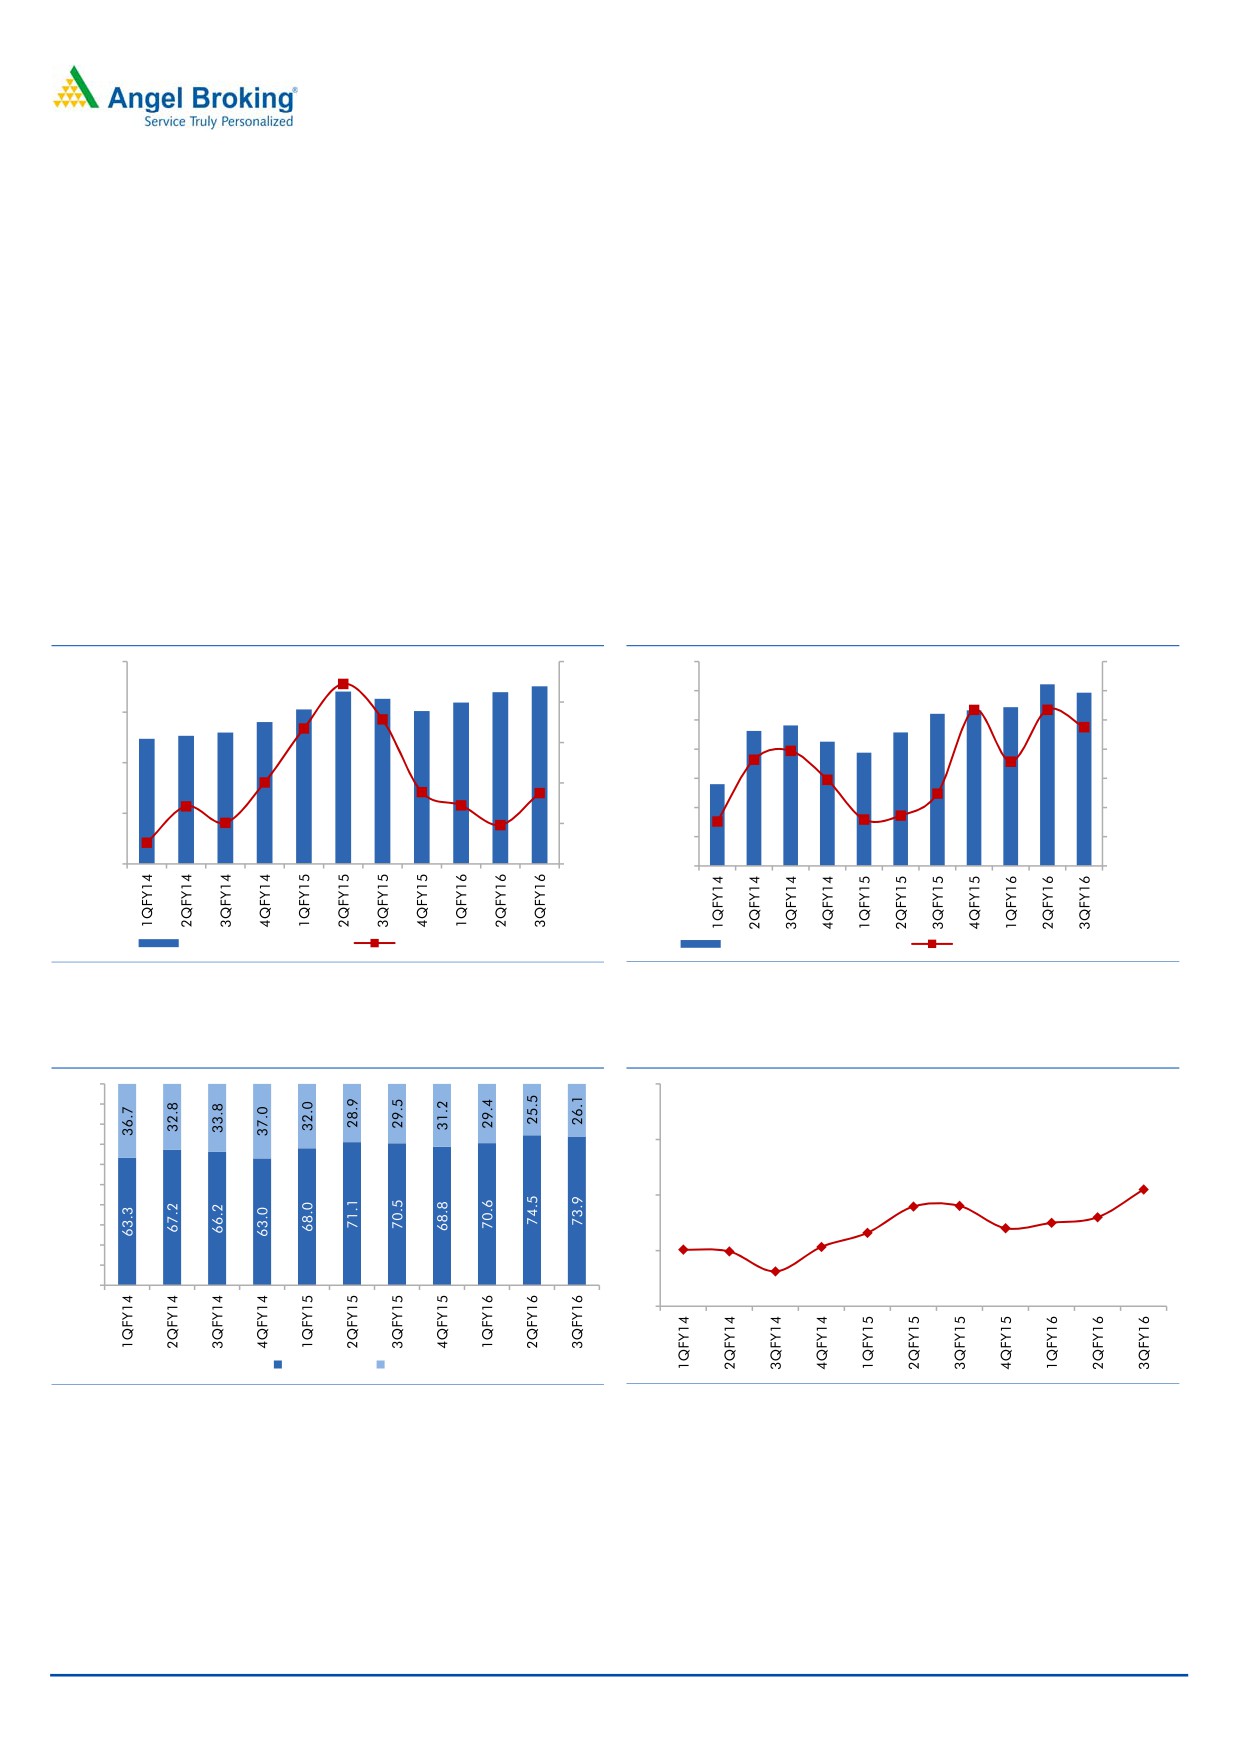
TVSM reported a healthy volume growth of 7% yoy in 3QFY2016. Growth was
once again led by the scooter and the motorcycle segments which grew by
22% and 11% yoy, respectively. The moped segment however posted a decline
of 6% yoy, being severely impacted by a hit in rural demand.
Realisation/vehicle grew 4% yoy to `41,868, led by a better product mix and
price hikes. The share of the high realisation non-moped segment in overall
volumes improved to
73% in 9MFY2016 as against
69.9% in the
corresponding period last year. Contribution/vehicle improved by 11% yoy
due to better product mix and soft commodity prices.
TVSM continued to outperform the domestic two-wheeler industry on back of
success of its new launches. In 9MFY2016, TVSM’s market share improved by
30bp yoy to 13.5%.
Exhibit 4: Volumes led by scooters and motorcycles
Exhibit 5: Realisation and contribution/vehicle trend
800,000
40
44,000
13,000
42,000
12,500
30
600,000
40,000
12,000
20
38,000
11,500
400,000
36,000
11,000
10
34,000
10,500
200,000
0
32,000
10,000
0
(10)
30,000
9,500
Overall volumes (LHS)
yoy growth (%) (RHS)
Realisation/vehicle (`)
Contribution/vehicle (`)
Source: Company, Angel Research
Source: Company, Angel Research
Exhibit 6: Share of non-mopeds rise
Exhibit 7: Domestic market share improves yoy
100%
18
90%
80%
70%
16
60%
14.2
50%
13.6
13.6
14
13.2
40%
12.8
13.0
12.6
30%
12.1
12.0
12.0
20%
12
11.3
10%
0%
10
Non moped Moped
Source: Company, Angel Research
Source: Company, SIAM, Angel Research
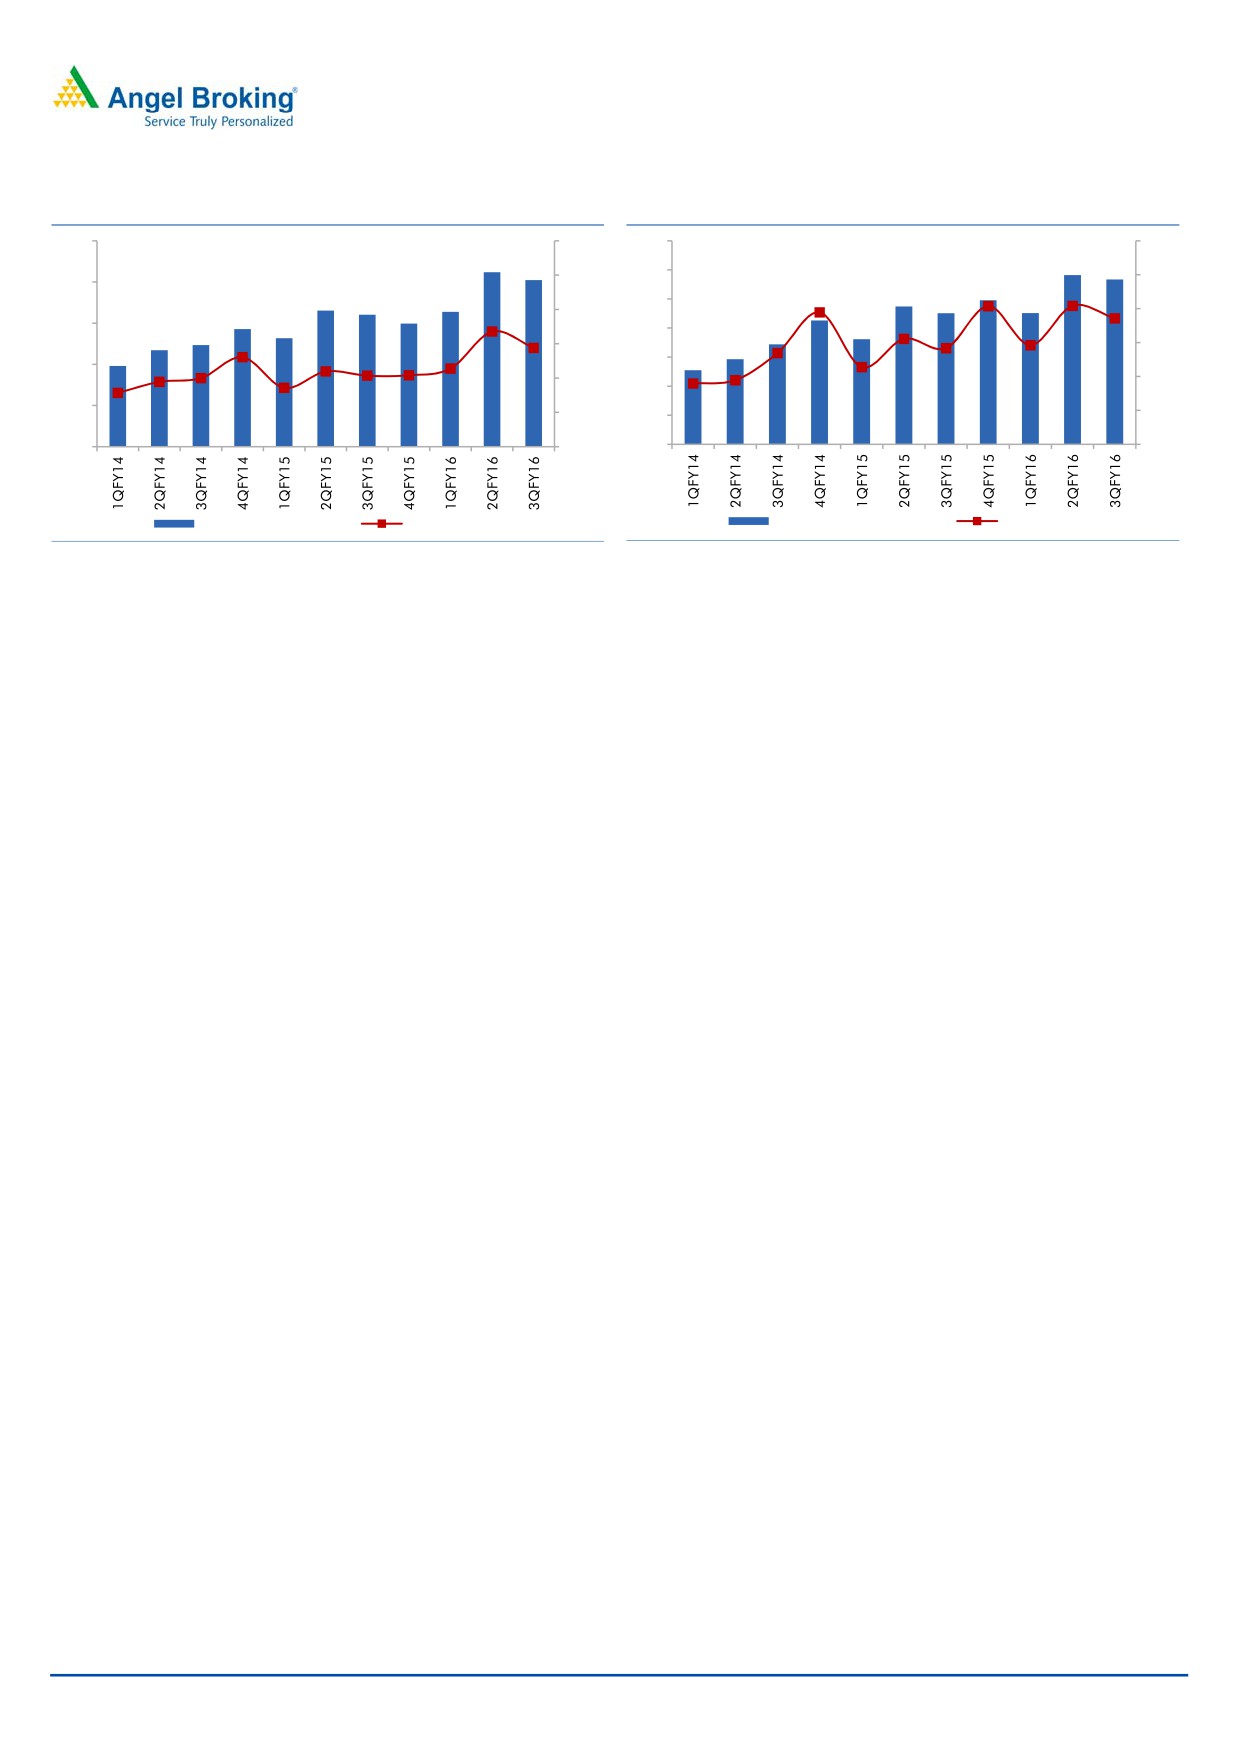
TVSM’s margins, adjusted for net one-off provisions of `12cr, stood at 7.3%.
The margins improved sharply by 120bp yoy, led by improving volumes and
realisation and soft commodity prices.
Adjusting for the one-off items, the net profit at `120.7cr was in line with our
estimates.
February 1, 2016
3
TVS Motor Company | 3QFY2016 Result Update
Exhibit 8: EBITDA margins improve yoy
Exhibit 9: Net profit meets estimates
250
10.0
140
5.0
120
9.0
4.5
200
100
8.0
4.0
150
80
7.0
3.5
60
100
6.0
3.0
40
50
5.0
20
2.5
0
4.0
0
2.0
EBIDTA (` cr) (LHS)
Margin (RHS)
Net Profit (` cr) (LHS)
Margin (RHS)
Source: Company, Angel Research
Source: Company, Angel Research
Conference Call - Key highlights
TVSM expects the two-wheeler industry demand to remain lackluster in the
near term given the weak rural sentiments. Two consecutive years of deficient
rainfall coupled with moderate growth in MSPs have impacted the incomes in
rural areas which account for about 40% of the two-wheeler demand.
For 4QFY2016, TVSM expects the industry to grow in low single digits
(about 3-4%).
TVSM is aiming to continue outpacing the industry growth on back of new
product launches. TVSM recently reintroduced “Victor” motorcycle in the
executive segment where it has relatively weak presence. TVSM is aiming to
reach market share of 16% by the end of FY2016 as against its current market
share of 14%. Further TVSM is aiming to reach 18% market share by the end
of FY2017.
TVSM export volumes have been impacted with the company reporting low
single digit growth of 2% during 3QFY2016 as against healthy double digit
growth in 1HFY2016. Exports have been impacted in the near term given the
lower availability of USD in key markets of Africa which forms about half of
export volumes. Slide in crude prices have led to severe devaluation of the
local African currencies (such as Nigeria) thereby impacting the demand.
TVSM expects the export segment to remain under pressure in the near term
and expects a recovery in the next two to three quarters.
Given the focus on increasing volumes, TVSM has maintained the target of
reaching double-digit operating margins by FY2018. As per the Management,
creation of strong brands would lead to higher volumes and eventually lead to
operating leverage which would drive margins.
In view of demand potential domestically and expected recovery in the export
markets, TVSM is increasing its three-wheeler capacity from 1.5 lakh units to 2
lakh units in the next two quarters.
TVSM Indonesian operations profitability improved with the EBIDTA losses
reducing from 7 mn USD in 2014 to 5 mn USD in 2015. Improved product
mix coupled with cost control measures have led to operational improvement.
TVSM expects commodity prices to remain stable in the near term.
TVSM has guided for an overall capex of `350cr in FY2016.
February 1, 2016
4
TVS Motor Company | 3QFY2016 Result Update
Investment arguments
Success of new launches and increased penetration to help outpace industry
growth: TVS Motor outpaced the domestic two-wheeler industry, reporting a
growth of 20% in FY2015 as against an industry growth of 9%. Success of new
products such as Jupiter, Star City+ and Scooty Zest enabled the company to
gain market share. We believe TVS Motor is well poised to outpace the
industry over FY2015-2017 given the increasing penetration (expansion in
dealer network) and a strong product pipeline. We expect TVS Motor to report
a healthy 10% volume CAGR over the FY2015-2017 period.
Operating margins to improve going ahead: We expect the operating margin
to gradually inch upwards in FY2016 and FY2017, driven by improving
product-mix, operating leverage benefits and raw material cost reduction
efforts. With the company establishing strong brands, TVS Motor has scope to
raise product prices going ahead (TVS Motor’s products are currently priced at
a discount to larger peers such as Hero Motocorp and Honda) which would be
a strong margin driver going ahead. We expect the company’s margin to
improve by ~220bp over the next two years.
Tie-up with BMW positive in the long run: TVS Motor has entered into a long
term co-operation agreement with BMW's motorcycle division, BMW Motorrad,
to develop and produce a new series of motorcycles that will cater to the sub-
500cc segment. As a part of the deal, TVS Motor will invest EUR20mn in the
collaboration, which is expected to introduce a new product in 2016. We see
this as a positive development for TVS Motor and a step in the right direction
as the BMW association will provide technological access to the company. The
tie-up is also expected to help TVS Motor expand its presence in the premium
motorcycle space, where it currently offers the Apache (160cc and 180cc)
series. In the near term though, we believe that this agreement is unlikely to
alter the current positioning of the company in the domestic motorcycle
industry.
Outlook and valuation
The two wheeler industry is expected to recover in FY2017 on back of
implementation of Seventh pay commission and recovery in the rural demand.
Also, TVS Motor is likely to continue gaining market share on back of new product
launches and expanding geographical presence. Further, the realization/vehicle is
likely to improve given the increased proportion of the non-moped segment. TVSM
margins are also likely to improve as volumes pick up, given the benefits of
operating leverage, gradual reduction in marketing expenses and reduction in
material prices due to better vendor negotiations. We expect TVS Motor to report
revenue and Net profit growth of 16% and 53% respectively in FY2017. We
maintain our positive view on the stock and assign “Accumulate” rating on the
stock with a revised price target of `322 (based on 22x FY2017 earnings).
February 1, 2016
5
TVS Motor Company | 3QFY2016 Result Update
Exhibit 10: Key assumptions
Y/E March
FY2012
FY2013
FY2014
FY2015
FY2016E
FY2017E
Total volume (units)
2,197,017
2,032,622
2,081,220
2,549,321
2,692,670
3,045,115
Motorcycles
843,114
749,806
793,480
960,602
1,027,844
1,161,464
Scooters
529,316
441,557
476,428
707,537
813,668
935,718
Mopeds
785,942
792,069
729,672
773,220
734,559
808,015
Three-Wheelers
38,645
49,190
81,640
107,962
116,599
139,919
Change yoy (%)
8.1
(7.5)
2.4
22.5
5.6
13.1
Motorcycles
0.8
(11.1)
5.8
21.1
7.0
13.0
Scooters
17.1
(16.6)
7.9
48.5
15.0
15.0
Mopeds
11.7
0.8
(7.9)
6.0
(5.0)
10.0
Three-Wheelers
(3)
27.3
66
32.2
8.0
20.0
Domestic (units)
1,910,551
1,786,994
1,769,037
2,133,477
2,226,924
2,495,536
Exports (units)
286,466
245,628
312,183
415,844
465,745
549,579
Source: Company, Angel Research
Company background
TVS Motor Company, the flagship company of the TVS Group, is the third largest
2W manufacturer in India. The company is present across the motorcycles,
scooters, and mopeds segments, having a market share of ~7%, ~15% and
100%, respectively. The company successfully ventured into the 3W segment in
FY2009 and garnered a market share of 11% as of March 31, 2015. The
company has three manufacturing facilities in India, located at Hosur (Tamil
Nadu), Mysore (Karnataka) and Solan (Himachal Pradesh) with 2W and 3W
capacity of 3mn and 150,000 units, respectively. The company is also the second
largest exporter of two-wheelers in the country.
February 1, 2016
6
TVS Motor Company | 3QFY2016 Result Update
Profit and loss statement (Standalone)
Y/E March (` cr)
FY2012
FY2013
FY2014
FY2015
FY2016E
FY2017E
Total operating income
7,142
7,065
7,962
10,098
11,263
13,106
% chg
13.6
(1.1)
11.1
26.8
11.9
16.4
Total expenditure
6,672
6,656
7,484
9,494
10,486
12,012
Net raw material costs
5,261
5,097
5,673
7,297
8,058
9,207
Employee expenses
370
407
476
585
645
735
Others
1,041
1,153
1,335
1,611
1,782
2,070
EBITDA
469
409
478
616
777
1,094
% chg
19.7
(12.9)
16.9
27.8
25.6
40.7
(% of total op. income)
6.6
5.8
6.0
6.1
6.9
8.3
Depreciation & amortization
118
130
132
153
185
201
EBIT
352
279
377
496
635
978
% chg
23.5
(20.8)
24.5
30.2
28.1
54.1
(% of total op. income)
5.0
4.0
4.7
4.9
5.6
7.5
Interest and other charges
57
48
25
27
40
25
Other income
22
25
30
33
42
85
Recurring PBT
316
255
351
468
595
953
% chg
27.6
(19.4)
38.1
31.7
27.0
60.3
Tax
67
48
91
108
159
257
(% of PBT)
21.3
28.9
25.9
23.1
26.7
27.0
Extraordinary income/(exp.)
-
91
1
0
0
0
PAT (reported)
249
117
262
348
436
696
ADJ. PAT
249
208
260
356
436
696
% chg
25.3
(16.5)
25.9
35.3
22.3
59.7
(% of total op. income)
3.5
3.0
3.3
3.5
3.9
5.3
Basic EPS (`)
5.2
2.5
5.5
7.3
9.2
14.6
Adj. EPS (`)
5.2
4.4
5.5
7.5
9.2
14.6
% chg
25.3
(16.5)
25.9
35.3
22.3
59.7
February 1, 2016
7
TVS Motor Company | 3QFY2016 Result Update
Balance sheet statement (Standalone)
Y/E March (` cr)
FY2012 FY2013 FY2014 FY2015 FY2016E FY2017E
SOURCES OF FUNDS
Equity share capital
48
48
48
48
48
48
Reserves & surplus
1,122
1,177
1,368
1,598
1,868
2,344
Shareholders’ Funds
1,169
1,225
1,415
1,645
1,916
2,391
Total loans
715
546
528
970
930
800
Deferred tax liability
98
93
125
153
153
153
Other long term liabilities
-
-
-
Long term provisions
49
53
53
44
79
92
Total Liabilities
2,031
1,917
2,121
2,812
3,077
3,436
APPLICATION OF FUNDS
Gross block
2,154
2,248
2,472
2,822
3,172
3,522
Less: Acc. depreciation
1,129
1,236
1,347
1,492
1,677
1,877
Net Block
1,026
1,011
1,126
1,330
1,495
1,645
Capital work-in-progress
53
36
48
89
89
89
Investments
931
869
896
1,012
1,112
1,212
Long term loans and adv.
57
73
86
144
113
131
Current assets
1,048
1,130
1,409
2,029
2,257
2,634
Cash
13
17
83
5
30
61
Loans & advances
243
302
364
633
676
786
Other
793
810
962
1,391
1,551
1,786
Current liabilities
1,083
1,202
1,444
1,792
1,989
2,275
Net current assets
(35)
(73)
(35)
237
268
358
Total Assets
2,031
1,917
2,121
2,812
3,077
3,436
February 1, 2016
8
TVS Motor Company | 3QFY2016 Result Update
Cash flow statement (Standalone)
Y/E March (` cr)
FY2012 FY2013 FY2014 FY2015 FY2016E FY2017E
Profit before tax
316
254
351
468
595
953
Depreciation
118
108
110
146
185
201
Change in working capital
63
83
112
(350)
(6)
(60)
Others
33
(115)
30
(59)
66
(6)
Direct taxes paid
(67)
(48)
(91)
(108)
(159)
(257)
Cash Flow from Operations
441
282
513
97
681
831
(Inc.)/Dec. in fixed assets
(177)
(77)
(236)
(391)
(350)
(350)
(Inc.)/Dec. in investments
(270)
62
(27)
(117)
(100)
(100)
Cash Flow from Investing
(425)
(15)
(263)
(507)
(450)
(450)
Issue of equity
-
-
-
Inc./(Dec.) in loans
(72)
(197)
(107)
443
(40)
(130)
Dividend paid (Incl. Tax)
72
(66)
(77)
(110)
(165)
(220)
Others
(150)
-
-
Cash Flow from Financing
(150)
(263)
(184)
333
(206)
(350)
Inc./(Dec.) in cash
(135)
4
65
(78)
25
31
Opening Cash balances
6
13
17
83
6
30
Closing Cash balances
13
17
83
6
30
61
February 1, 2016
9
TVS Motor Company | 3QFY2016 Result Update
Key ratios
Y/E March
FY2012
FY2013
FY2014
FY2015
FY2016E
FY2017E
Valuation Ratio (x)
P/E (on FDEPS)
56.7
67.8
53.2
39.3
32.2
20.1
P/CEPS
38.3
41.6
35.5
27.5
22.6
15.6
P/BV
12.0
11.4
9.9
8.5
7.3
4.8
Dividend yield (%)
0.5
0.4
0.5
0.7
1.0
1.0
EV/Sales
2.1
2.0
1.8
1.5
1.3
1.1
EV/EBITDA
30.0
35.7
29.9
24.6
19.1
13.5
EV / Total Assets
6.9
7.3
6.8
5.3
4.8
4.3
Per Share Data (`)
EPS (Basic)
5.2
4.4
5.5
7.5
9.2
14.6
EPS (fully diluted)
5.2
4.4
5.5
7.5
9.2
14.6
Cash EPS
7.7
7.1
8.3
10.7
13.1
18.9
DPS
1.3
1.2
1.4
2.0
3.0
4.0
Book Value
24.6
25.8
29.8
34.6
40.3
50.3
Returns (%)
ROCE (Pre-tax)
18.5
12.7
13.6
13.7
15.5
20.3
Angel ROIC (Pre-tax)
17.4
15.2
18.7
17.7
20.8
29.0
ROE
22.9
16.9
18.6
21.7
22.7
29.1
Turnover ratios (x)
Asset Turnover (Gross Block)
3.5
3.2
3.2
3.6
3.6
3.7
Inventory / Sales (days)
29
26
25
30
29
28
Receivables (days)
12
16
15
18
18
18
Payables (days)
54
55
63
61
61
60
WC cycle (ex-cash) (days)
(1)
(13)
(23)
(13)
(14)
(14)
Solvency ratios (x)
Net debt to equity
(0.2)
0.5
0.3
0.6
0.5
0.3
Net debt to EBITDA
(0.5)
1.5
0.9
1.6
1.2
0.7
Interest Coverage (EBIT / Int.)
6.2
6.3
15.0
18.1
15.9
39.1
February 1, 2016
10
TVS Motor Company | 3QFY2016 Result Update
Research Team Tel: 022 - 39357800
DISCLAIMER
Angel Broking Private Limited (hereinafter referred to as “Angel”) is a registered Member of National Stock Exchange of India Limited,
Bombay Stock Exchange Limited and Metropolitan Stock Exchange of India Limited. It is also registered as a Depository Participant with
CDSL and Portfolio Manager with SEBI. It also has registration with AMFI as a Mutual Fund Distributor. Angel has received in-principal
approval from SEBI for registering as a Research Entity in terms of SEBI (Research Analyst) Regulations, 2014. Angel or its associates
has not been debarred/ suspended by SEBI or any other regulatory authority for accessing /dealing in securities Market. Angel or its
associates including its relatives/analyst do not hold any financial interest/beneficial ownership of more than 1% in the company
covered by Analyst. Angel or its associates/analyst has not received any compensation / managed or co-managed public offering of
securities of the company covered by Analyst during the past twelve months. Angel/analyst has not served as an officer, director or
employee of company covered by Analyst and has not been engaged in market making activity of the company covered by Analyst.
This document is solely for the personal information of the recipient, and must not be singularly used as the basis of any investment
decision. Nothing in this document should be construed as investment or financial advice. Each recipient of this document should
make such investigations as they deem necessary to arrive at an independent evaluation of an investment in the securities of the
companies referred to in this document (including the merits and risks involved), and should consult their own advisors to determine
the merits and risks of such an investment.
Reports based on technical and derivative analysis center on studying charts of a stock's price movement, outstanding positions and
trading volume, as opposed to focusing on a company's fundamentals and, as such, may not match with a report on a company's
fundamentals.
The information in this document has been printed on the basis of publicly available information, internal data and other reliable
sources believed to be true, but we do not represent that it is accurate or complete and it should not be relied on as such, as this
document is for general guidance only. Angel Broking Pvt. Limited or any of its affiliates/ group companies shall not be in any way
responsible for any loss or damage that may arise to any person from any inadvertent error in the information contained in this report.
Angel Broking Pvt. Limited has not independently verified all the information contained within this document. Accordingly, we cannot
testify, nor make any representation or warranty, express or implied, to the accuracy, contents or data contained within this document.
While Angel Broking Pvt. Limited endeavors to update on a reasonable basis the information discussed in this material, there may be
regulatory, compliance, or other reasons that prevent us from doing so.
This document is being supplied to you solely for your information, and its contents, information or data may not be reproduced,
redistributed or passed on, directly or indirectly.
Neither Angel Broking Pvt. Limited, nor its directors, employees or affiliates shall be liable for any loss or damage that may arise from
or in connection with the use of this information.
Note: Please refer to the important ‘Stock Holding Disclosure' report on the Angel website (Research Section). Also, please refer to the
latest update on respective stocks for the disclosure status in respect of those stocks. Angel Broking Pvt. Limited and its affiliates may
have investment positions in the stocks recommended in this report.
Disclosure of Interest Statement
TVS Motor Company
1. Analyst ownership of the stock
No
2. Angel and its Group companies ownership of the stock
No
3. Angel and its Group companies' Directors ownership of the stock
No
4. Broking relationship with company covered
No
Note: We have not considered any Exposure below ` 1 lakh for Angel, its Group companies and Directors
Ratings (Based on expected returns
Buy (> 15%)
Accumulate (5% to 15%)
Neutral (-5 to 5%)
over 12 months investment period):
Reduce (-5% to -15%)
Sell (< -15%)
February 1, 2016
11