Initiating coverage | Cons. Durable
April 29, 2015
Surya Roshni
BUY
CMP
`109
Initiating Coverage - A Brighter Future
Target Price
`149
Surya Roshni Ltd is a 38 year old conglomerate with its core business comprising
Investment Period
12 Months
of lighting and steel tube products. The Lighting business has superior profitability
than the latter and the company is among the largest players in the lighting
Stock Info
industry with a market share in excess of 25%. The company has a pan India
Sector
Cons. Durable
presence spanning a network of ~2 lakh retailers. Although the Steel business is
expected to grow at a muted pace, the division will perform well owing to
Market Cap (` cr)
480
increased spend on Infra projects and with government initiatives like building
Beta
1.5
smart cities across India.
52 Week High / Low
81/143
Structural shift in the Lighting industry presents new growth opportunity: The
Avg. Daily Volume
96,896
Lighting business is primed for a good performance owing to the structural shift in
Face Value (`)
10.00
the industry towards LED (Light Emitting Diodes) lights. Citing cost efficient nature
BSE Sensex
27,226
of LEDs, Electric Lamp and Components Manufacturers Association (ELCOMA)
projects the share of LEDs in the Lighting industry to increase substantially. Major
Nifty
8,230
initiatives like changing all street lights and lights in public spaces to LED lights, by
Reuters Code
SURR.BO
the government, are expected to fuel growth of LEDs. As a result, the lighting
Bloomberg Code
SYR@IN
industry is expected to grow at a CAGR of 22.8% over FY2014-17E to `25,000cr
and reach the `37,000cr mark by FY2021E. This bodes well for the Lighting
division of the company which is likely to contribute more significantly to the
Shareholding Pattern (%)
overall top-line, mainly due to its vast retail presence. We expect the Lighting
Promoters
64.0
business’ revenues to grow at a CAGR of 13.1% over FY2015E-17E to `1,400cr
MF / Banks / Indian Fls
0.1
and this will have a favourable impact on the overall margins due to better
profitability of the business.
FII / NRIs / OCBs
0.0
Indian Public / Others
35.9
Exploring newer avenues: Thanks to its strong network of retailers, the Fan
business (which was launched in January 2014) has received a good response in
a relatively shorter period of time; clocking revenues of ~`60cr in FY2015.
Encouraged by the good response, the company has entered the Home
Abs. (%)
3m 1yr
3yr
Appliances business and will also be venturing into the business of providing solar
Sensex
(7.3)
21.1
59.4
based lighting systems for rural and urban use. Leveraging upon its strong
Surya Roshni
(14.8)
22.1
87.9
network, we expect the company to successfully scale up its new ventures.
Outlook and Valuation: With higher contribution from the Lighting business and
entry into newer businesses, we expect the company to post a CAGR of 6.2% in
3-year daily price chart
the top-line over FY2015E-17E to `3,216cr. Owing to better margin profile of the
160
Lighting business, the EBITDA margins are estimated to improve from 8.1% in
140
FY2015E to 8.6% in FY2017E. Consequently, the net profit is expected to post a
120
CAGR of 27.7% over FY2015E-17E to `80cr. At the current market price, the
100
80
stock is trading at 6.0x its FY2017E earnings. We initiate coverage on the company
60
with a Buy rating and target price of `149 based on SOTP valuation.
40
20
SOTP Valuation
0
Particulars
Remarks
Exp. Mcap (` cr)
`/Share
Steel Business
3x its FY2017E EBIT (minus `913cr of debt)
(749)
(171)
Lighting Business
9x its FY2017E EBIT
1,405
320
Total
149
Source: Company, Angel Research
Source: Company, Angel Research
Financials
Y/E
Sales OPM PAT
EPS
RoE P/E P/BV EV/BITDA EV/Sales
March
(` cr)
(%)
(` cr)
(`)
(%)
(x)
(x)
(x)
(x)
FY2015E
2,853
8.1
49
11.2
8.0
9.8
0.8
5.9
0.5
Milan Desai
FY2016E
2,990
8.3
63
14.3
9.4
7.6
0.7
5.4
0.5
022 4000 3600
FY2017E
3,216
8.6
80
18.3
10.9
6.0
0.6
4.8
0.4
Source: Company, Angel Research
Please refer to important disclosures at the end of this report
1
Initiating coverage | Surya Roshni
Investment Arguments
Structural shift in the Industry presents growth opportunity.
In-line with the industry trend, the company has added a wide range of LED
products to its offering. LED bulbs are a newer innovation in the lighting industry
and they differ in technology from CFL and GLS bulbs. Although cost of initial
purchase is far higher than CFL and GLS bulbs, LEDs prove to be most cost
efficient over the life of the bulb in comparison to the latter two. Below table
highlights the approximate cost savings by switching to LEDs.
Exhibit 1: Comparison (GLS-CFL-LED)
Particulars
GLS
CFL
LED
Average Life Span (Hours)
1,200
8,000
35,000
Watts (equivalent 60 watts)
60
14
8
Cost Per Bulb
20
150
480
Electricity cost (`/kWh) - Residential
3.5
3.5
3.5
Daily Cost (Assuming 5 hours/day)
1.1
0.245
0.14
Bulbs needed for 50k hours
41.7
6.3
1.4
Cost for 50k hours of use
10,500
2,450
1,400
Cost of Bulbs
833
938
686
Total Spend
11,333
3,388
2,086
Source: Company, Angel Research
As per industry reports, there will be a structural shift in the lighting industry
towards LEDs owing to several measures taken by the government like, changing
all street lights and lights in public spaces to LED lights, making all LED
specifications mandatory, and providing free LED lamps instead of CFL bulbs to
below poverty line (BPL) families.
Of the potential drivers for the segment listed above, we believe that switchover to
LED lighting for street and public lighting provides significant opportunity to the
company in the segment. Energy Efficiency Services Ltd (EESL), in its toolkit for
street light energy efficiency, has projected that retrofitting conventional streetlight
with LED could result in potential savings of 4,300mn kWh of energy. As per the
revisited BEE (Bureau of Energy Efficiency) supported project report, there are
269 municipal corporations having 33.65 lakh streetlights, that could be replaced
at an investment of `2,500cr.
April 29, 2015
2
Initiating coverage | Surya Roshni
Exhibit 2: Street light segment opportunities
State and # of Municipalities
Investment (` cr)
No. of Lights
Andhra Pradesh (9)
360.0
3,56,162
Assam (6)
1.9
4,372
Bihar (6)
12.4
11,129
Chattisgarh (4)
32.4
54,811
Haryana (9)
45.9
54,151
Himachal Pradesh (4)
2.0
5,913
Kerala (9)
99.3
1,44,515
Maharashtra (10)
428.3
4,01,303
Madhya Pradesh (13)
120.6
4,01,303
Punjab (6)
8.3
1,16,291
Rajasthan (6)
105.9
1,82,117
Uttar Pradesh (11)
296.5
3,48,332
Uttarakhand (1)
21.2
23,367
West Bengal (17)
294.4
3,99,457
Gujarat (159)
637.9
8,62,000
Total
2,466.8
33,65,223
Source: EESL, BEE, Angel Research
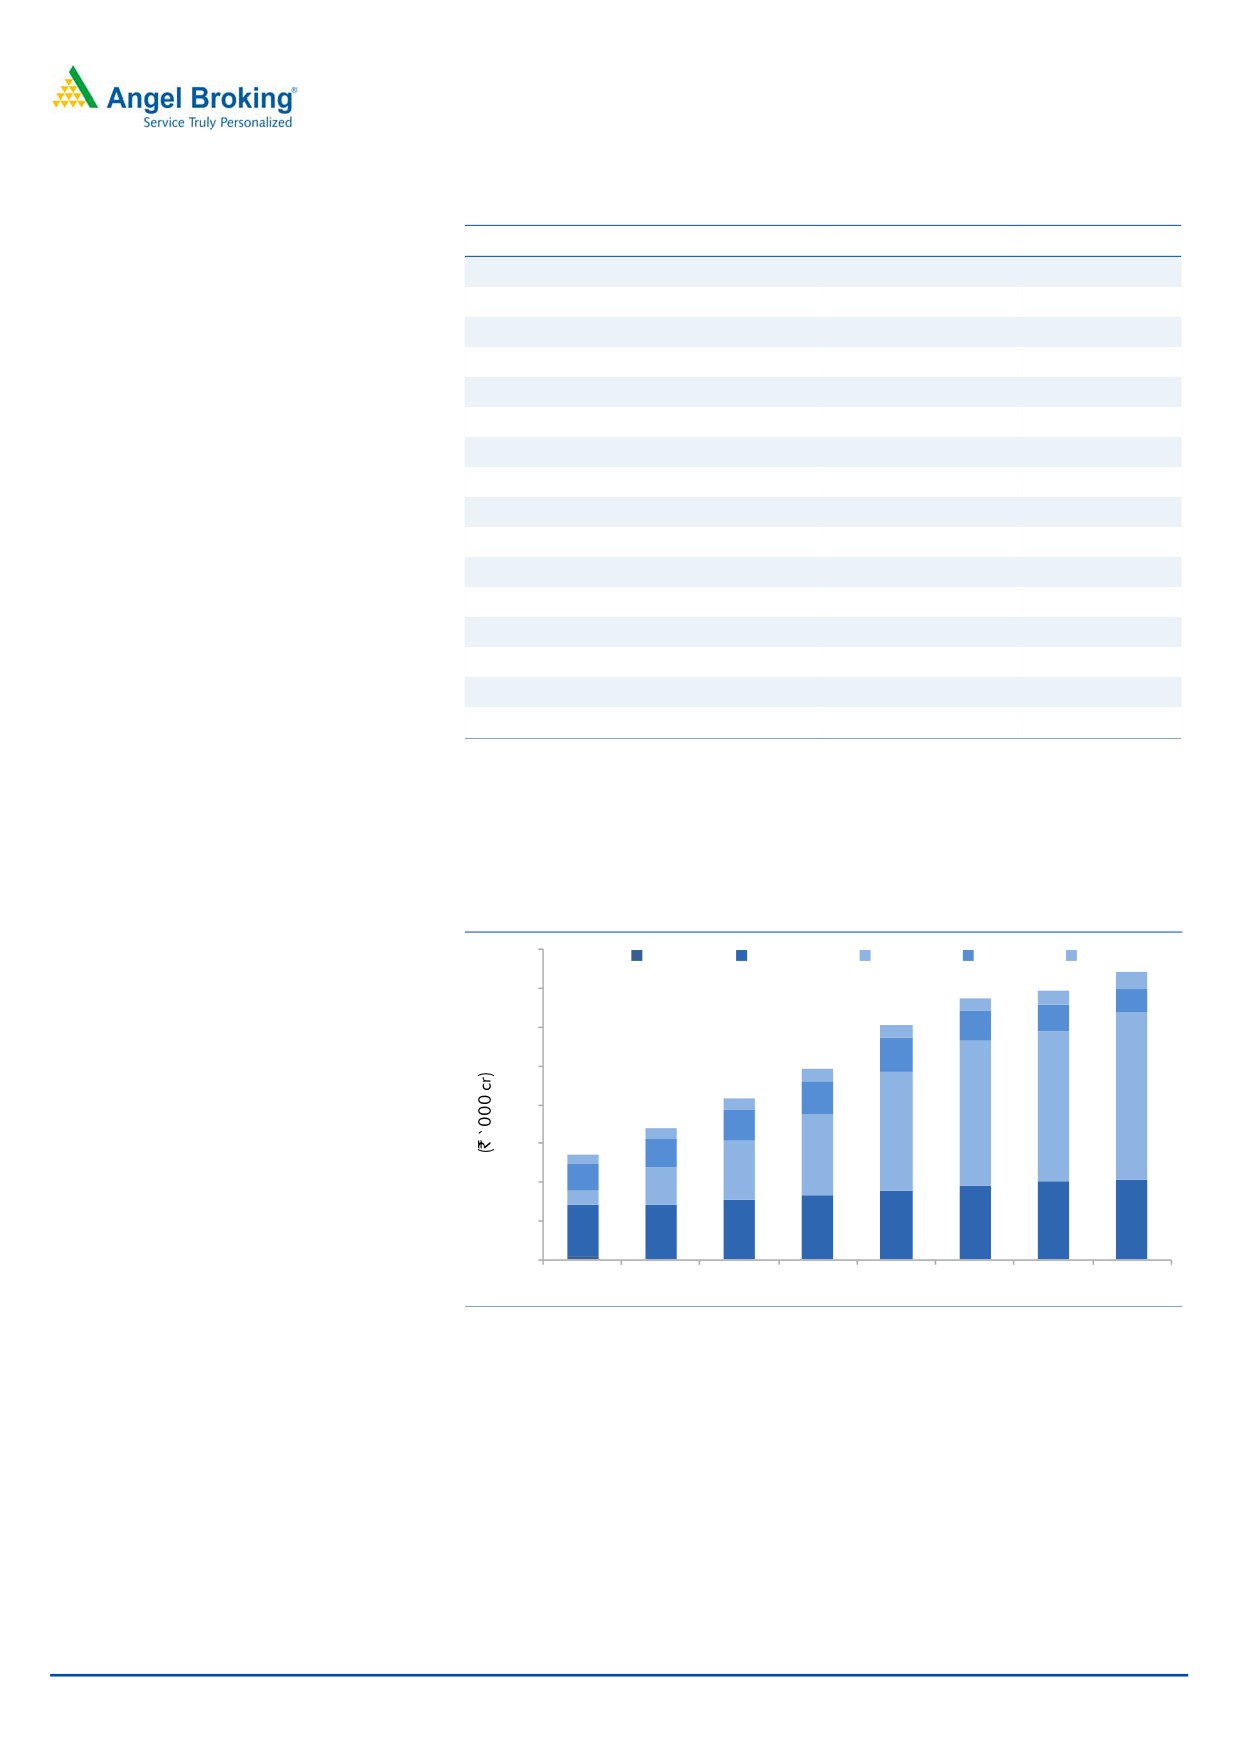
Citing this structural shift, ELCOMA expects LED market size to touch ~`10,500cr
by FY2017E and reach ~`21,630cr by FY2021E. As per the projections, LEDs are
expected to account for ~58% of the total lighting industry.
Exhibit 3: LEDs’ contribution to increase significantly
40
GLS
Others
LED
CFL
FTL
35
30
25
22
20
19
19
15
15
10
8
10
5
2
5
-
FY14
FY15
FY16
FY17
FY18
FY19
FY20
FY21
Source: ELCOMA, Angel Research
Currently, LED revenues for the company for FY2015 are estimated to be at
~`100cr. The Management is upbeat about the prospects and expects LEDs to
contribute ~30% to the company’s Lighting business’ turnover in the next two to
three years, while targeting revenue of ~`500cr from the segment. We believe that
there is a great opportunity for Surya Roshni in the fast growing LED market owing
to shift in preference towards cost efficient lighting solutions.
April 29, 2015
3
Initiating coverage | Surya Roshni
Strong position in the lighting industry
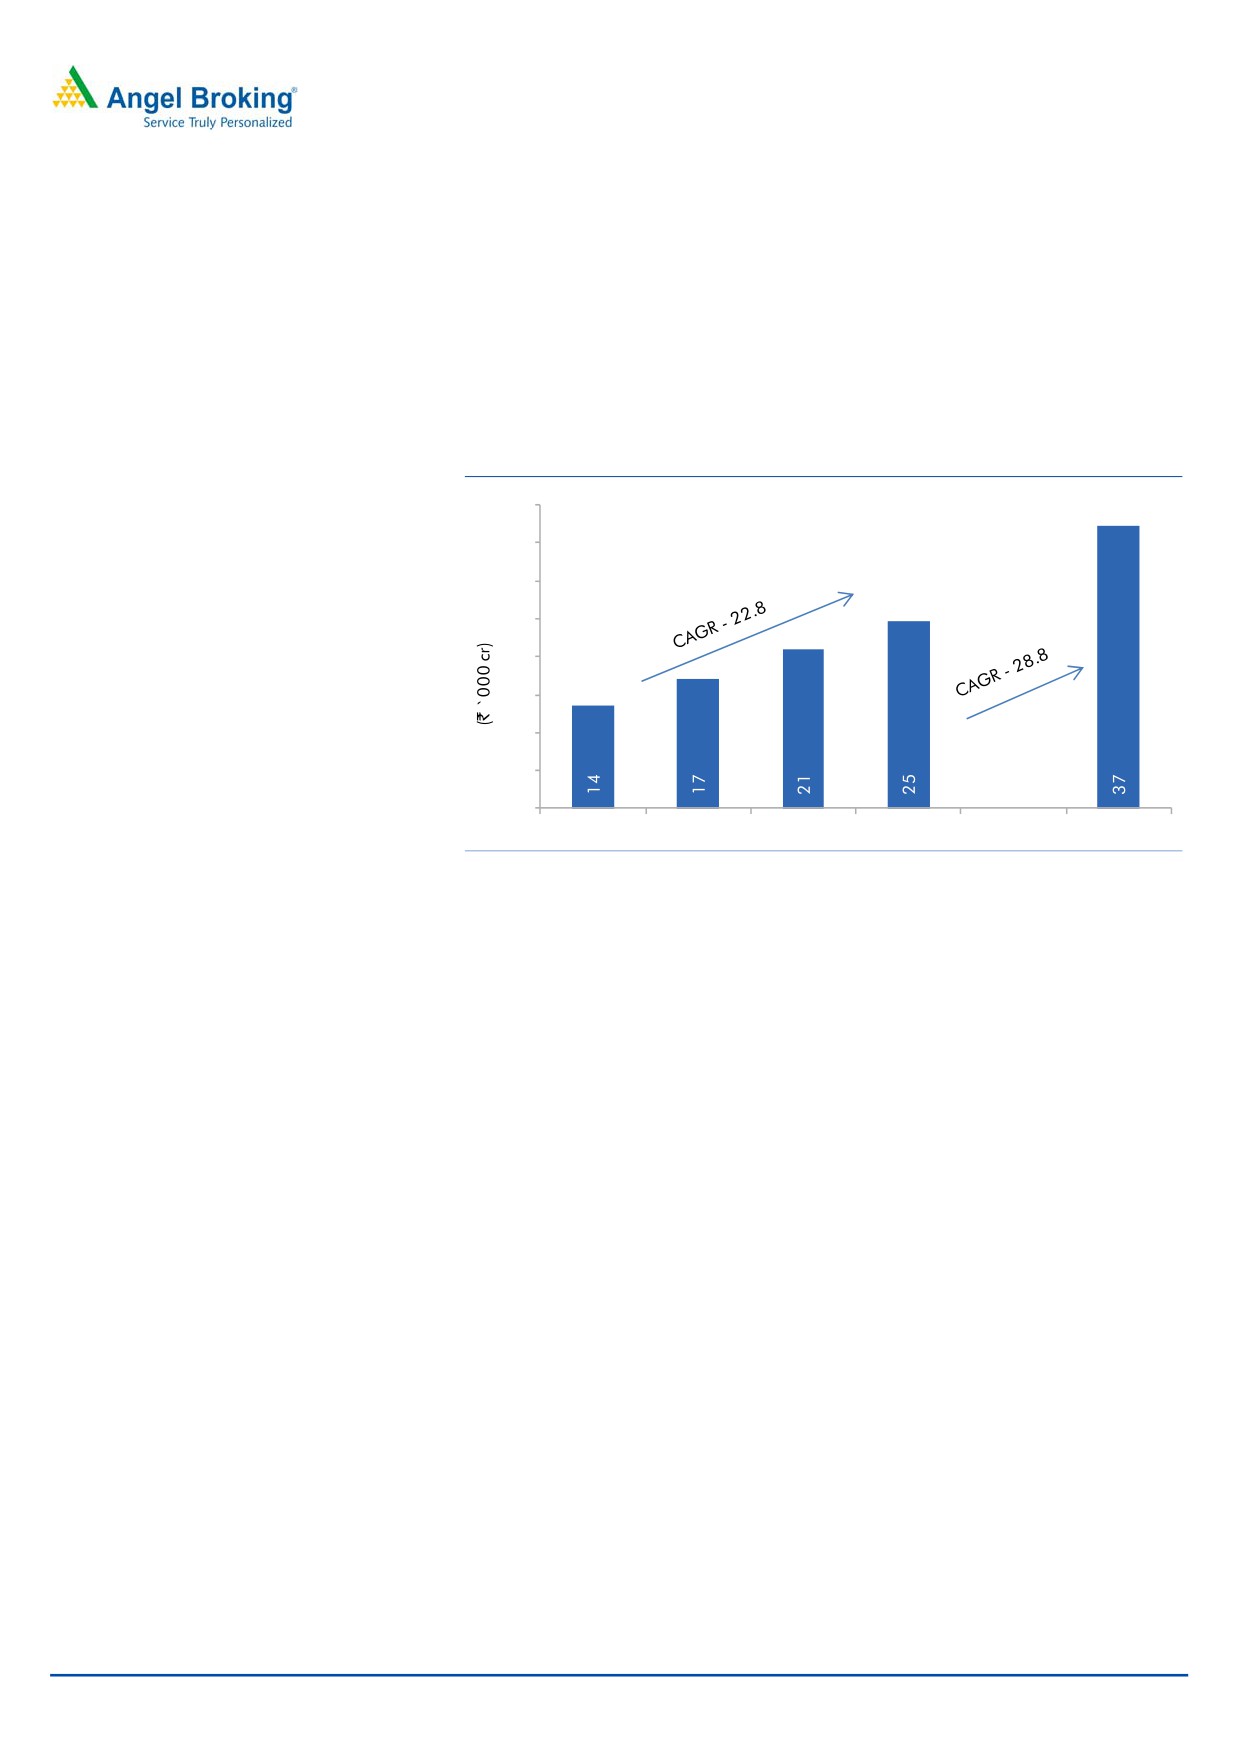
As per ELCOMA, the Indian lighting industry has displayed strong growth over the
years, posting a CAGR of 18.6% over FY2011-14 to reach `13,500cr. The growth
has been largely driven by shift from GLS lamps to CFLs. With the next round of
growth coming from the LED segment, the Indian lighting industry is expected to
grow at a CAGR of 22.8% over FY2014-17E to `25,000cr and reach the
`37,000cr mark by FY2021E.
Exhibit 4: Indian lighting Industry projection
40
35
30
25
20
15
10
5
-
FY2014
FY2015E FY2016E FY2017E
FY2021E
Source: ELCOMA, Angel Research
This positive outlook on the lighting industry augurs well for Surya Roshni as it is
the second largest lighting company in India with nearly three decades of
experience. In the domestic lighting segment, Surya is a prominent brand in the
consumer market and it has a market share in excess of 25%. It has a network of 2
lakh retailers across India and also has international presence in over more than
54 countries. The company has maintained its brand identity over the years and
offers a wide range of world class energy efficient lighting solutions (LED, CFL,
Tube Light, GLS, Luminaries and Accessories, High Mast Lighting Systems, Lighting
Poles etc.) for segments that include domestic, industrial, designer, commercial,
and street lights. It has a state of the art research and development centre in Noida
which assists the company in launching efficient products for the markets.
Additionally, the company has decided to venture into the business of solar power
based lighting systems for rural and urban use which will be an additional revenue
source for the company.
Higher contribution from the Lighting Division to boost profitability
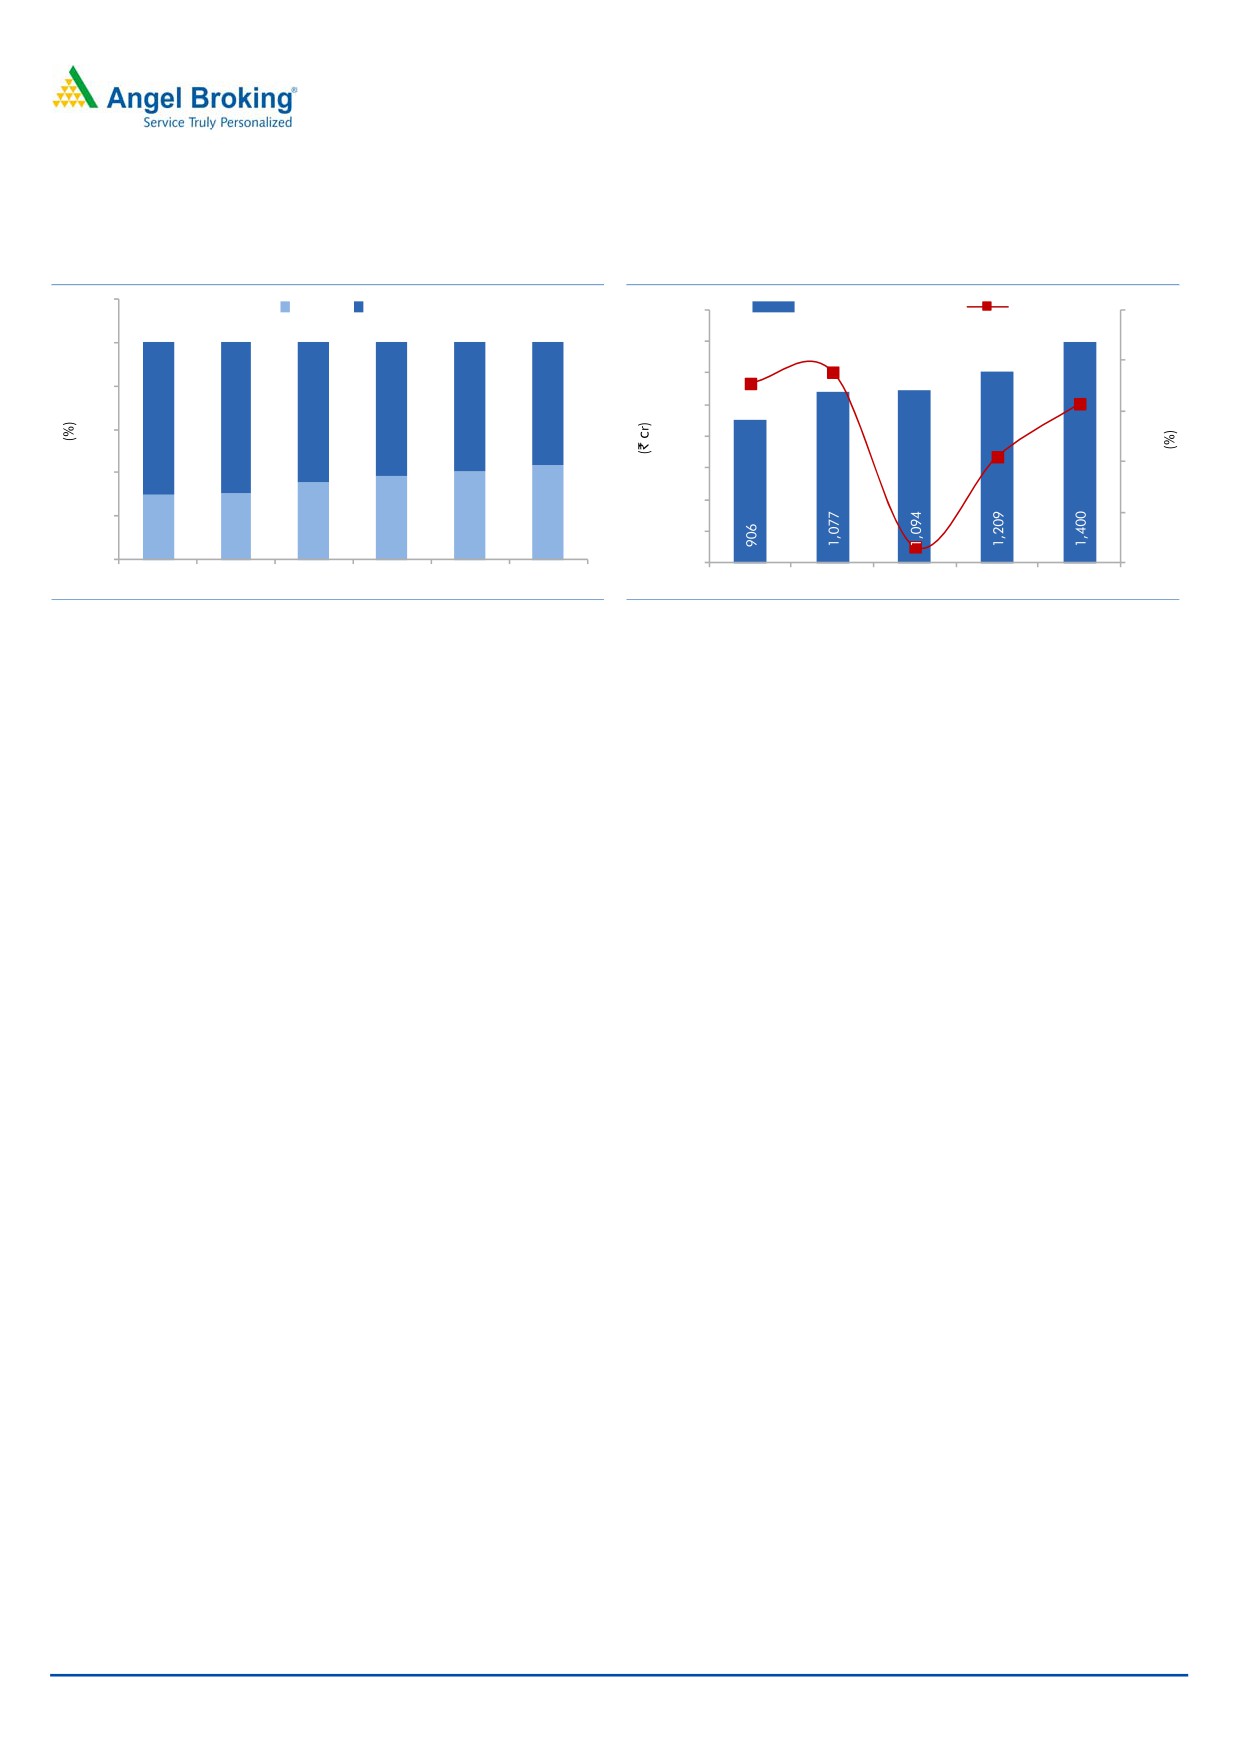
Historically, the company’s Steel division has been a major contributor to the
overall revenues vis-à-vis its Lighting division. In the past the contribution has been
70%-30% in favor of the Steel division. As for profitability, the Lighting business
has a better margin profile than the Steel business. The Lighting division’s margins
are at ~11% as of 9MFY2015 as against the Steel division’s margin of ~3.2%. A
look at the recent performance suggests that the trend seems to be changing,
especially since FY2014, where the Lighting business accounted for 35.5% of
overall sales vs 30.6% in FY2013. This share has further climbed up to ~39% in
9MFY2015 and we expect it to reach levels of 44% by FY2017E.
April 29, 2015
4
Initiating coverage | Surya Roshni
Exhibit 5: Lighting business contribution to improve
Exhibit 6: Lighting business Revenue Trend
120
Lighting
Steel
1,600
Lighting Revenue (LHS)
Growth (RHS)
25.0
1,400
100
20.0
1,200
18.8
80
17.7
56
1,000
64
62
60
15.7
15.0
70
69
60
800
10.0
40
600
10.5
400
20
38
40
44
5.0
30
31
36
200
1.6
-
-
-
FY2012
FY2013
FY2014
FY2015E FY2016E FY2017E
FY2013
FY2014
FY2015E
FY2016E
FY2017E
Source: Company, Angel Research
Source: Company, Angel Research
Surya Roshni is the only lighting company with 100% backward integration, which
benefits the company in terms of availability of best quality raw materials at
effectively lower costs. We expect increase in contribution from the Lighting
division, driven by shift towards LEDs, to boost the overall profitability of the
company.
Fans Business receiving good response
In January 2014, the company pronounced its presence in the `5,000cr Indian fan
industry by launching its ‘Surya’ brand of fans. Its nationwide reach through its
strong retail network and brand pull enjoyed by the company has enabled it to
post ~`60cr of revenue in FY2015E. The Management expects to achieve `200cr
of sales from the Fans business by FY2016E and further targets to reach the
`500cr mark in a span of three-four years. Given the wide range of products in its
portfolio along with existing network of 2 lakh retailers, we expect the contribution
from the business to increase in the long run.
Foray into Appliances business
Encouraged by the impressive performance of its Fans business in a relatively
shorter period of time, the company has recently forayed into the Home
Appliances business in the Indian market. The range of product offerings includes
water heaters/room heaters, dry irons, steam irons and mixer-grinders. The
company expects to garner revenue of `200cr from this segment by FY2017E. We
expect the Appliances business to enjoy similar success as the company’s Fans
business, and add to company’s revenues once the business gets ramped up.
Steel business to improve at a snail pace
Although the Steel business’ share in overall revenues of the company has been
declining in recent times, it is still a major part of the company’s operations. It is a
leader in the steel tube industry in India with products for infra, oil & gas, and
construction sectors. Apart from the stand alone business, the company has
investment in Surya Global Steel Tubes Ltd (SGSTL), holding 49.99% stake in it.
SGSTL is into manufacturing of ERW and Spiral Pipes at its plant in Bhuj (Gujarat),
mainly catering towards exports (75%). The last reported revenue from the
subsidiary was `610cr for September 2012.
April 29, 2015
5
Initiating coverage | Surya Roshni
In the near term, we expect the performance of the division to just be stable and
not be impressive owing to a slew of recent events that have been unfavorable for
the division. Most important of them are lower oil prices, which have dampened
demand from the oil exploration side, and lower global commodity prices. Hence
we have factored in negligible growth rate for the division. However, in the long
run, the division should post better results once the demand from oil and gas, infra
and other sectors begins to pick up. Further, the government’s vision to build 100
smart cities will have a favorable impact on the steel pipe business, in the longer
term time horizon.
Lower interest cost to add to bottom-line
The recent trend of declining interest rates is likely to benefit leveraged companies
like Surya Roshni. The Reserve Bank of India (RBI), since the beginning of the
current calendar year, has reduced interest rates by 50bp and is expected to
further cut down rates by 50-75bp. We have accounted for a 75bp reduction in
interest expense for the company over FY2015E-17E. We have reduced the debt
quantum for FY2015E, in-line with the number reported by the company in its half-
yearly statement, and taken marginal reductions, going forward. We estimate the
interest expense to decline from `111cr in FY2015E to `98cr in FY2017E. This
lower interest outgo will add directly to the bottom-line.
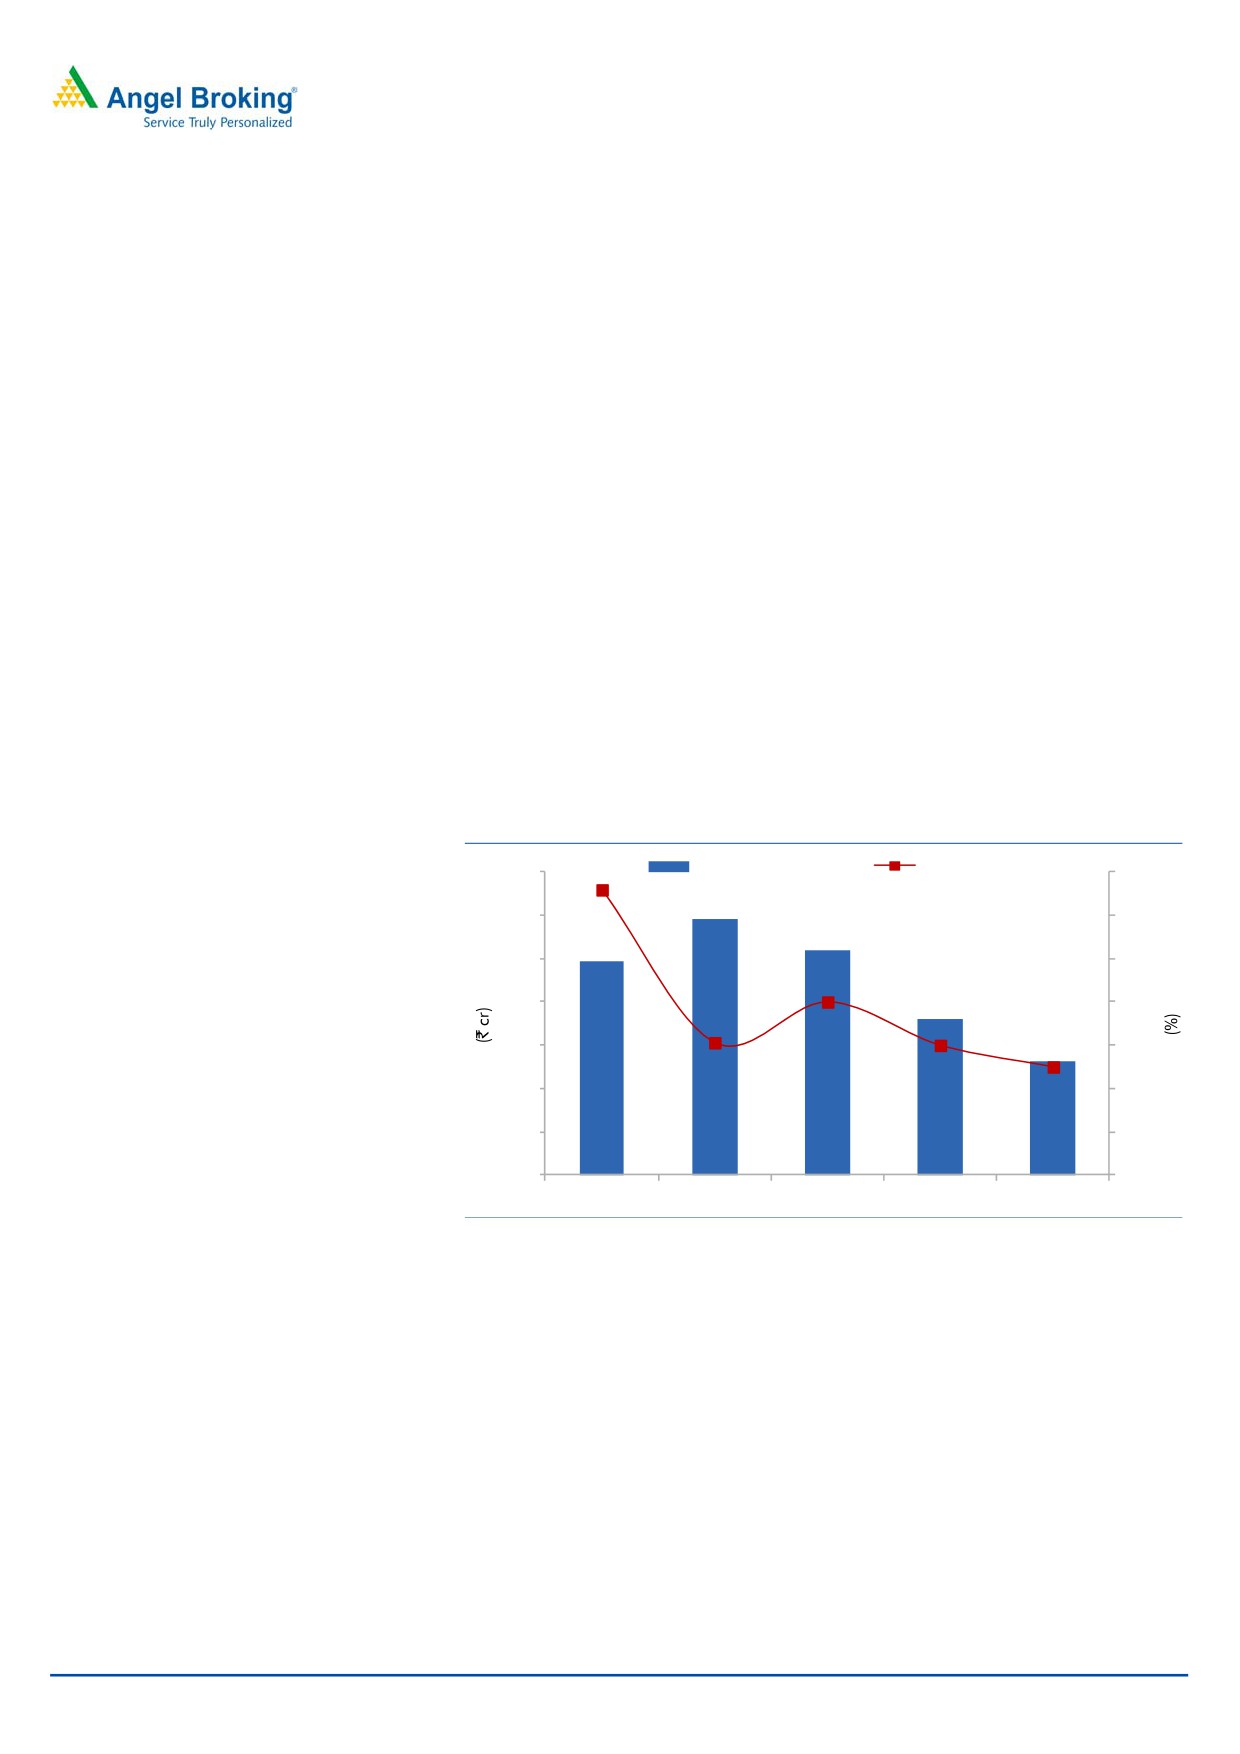
Exhibit 7: Decline in interest cost
Interest Expense (LHS)
% of Debt (RHS)
120
13.0
12.8
115
12.5
110
12.0
11.5
105
11.5
11.0
100
11.0
11.0
10.8
95
10.5
90
10.0
110
114
111
103
98
85
9.5
FY2013
FY2014
FY2015E
FY2016E
FY2017E
Source: Company, Angel Research
April 29, 2015
6
Initiating coverage | Surya Roshni
Financials
Exhibit 8: Segment Finance
(in ` cr)
FY2014
FY2015E
FY2016E
FY2017E
Revenue
Lighting
1,077
1,094
1,209
1,400
% chg
18.8
1.6
10.5
15.7
% of total
35.5
38.4
40.4
43.5
Steel
1,954
1,758
1,781
1,816
% chg
(4.8)
(10.0)
1.3
2.0
% of total
64.5
61.6
59.6
56.5
Total Segment Revenue
3,031
2,853
2,990
3,216
EBIT
Lighting
108
120
134
156
% yoy
9.2
11.4
11.0
16.7
% of total
60.7
70.0
71.8
74.1
Steel
70
52
53
54
% yoy
(13.8)
(26.1)
1.6
3.7
% of total
39.3
30.0
28.2
25.9
Total
178
172
186
211
Source: Company, Angel Research
Exhibit 9: Key assumptions - Lighting Division
(in ` cr)
FY2015E
FY2016E
FY2017E
Net Revenue
LED
105
168
269
% yoy
320.0
60.0
60.0
CFL
405
324
259
% yoy
(10.0)
(20.0)
(20.0)
Luminaries
205
226
259
% yoy
36.7
10.0
15.0
Fans
60
160
255
% yoy
-
166.0
60.0
Others
319
332
357
% yoy
(29.4)
4.0
7.4
Total
1,094
1,209
1,400
Source: Company, Angel Research
With steady performance from the Steel business and surging contribution of the
Lighting business (on the back of shift from CFL to LED), we expect the company’s
revenue to improve from `2,853cr in FY2015E to `3,216cr in FY2017E. We also
expect the Fans business’ contribution to improve and expect the Appliances
business to benefit from the brand pull and pan India retail network of the
company, much like the Fans business.
April 29, 2015
7
Initiating coverage | Surya Roshni
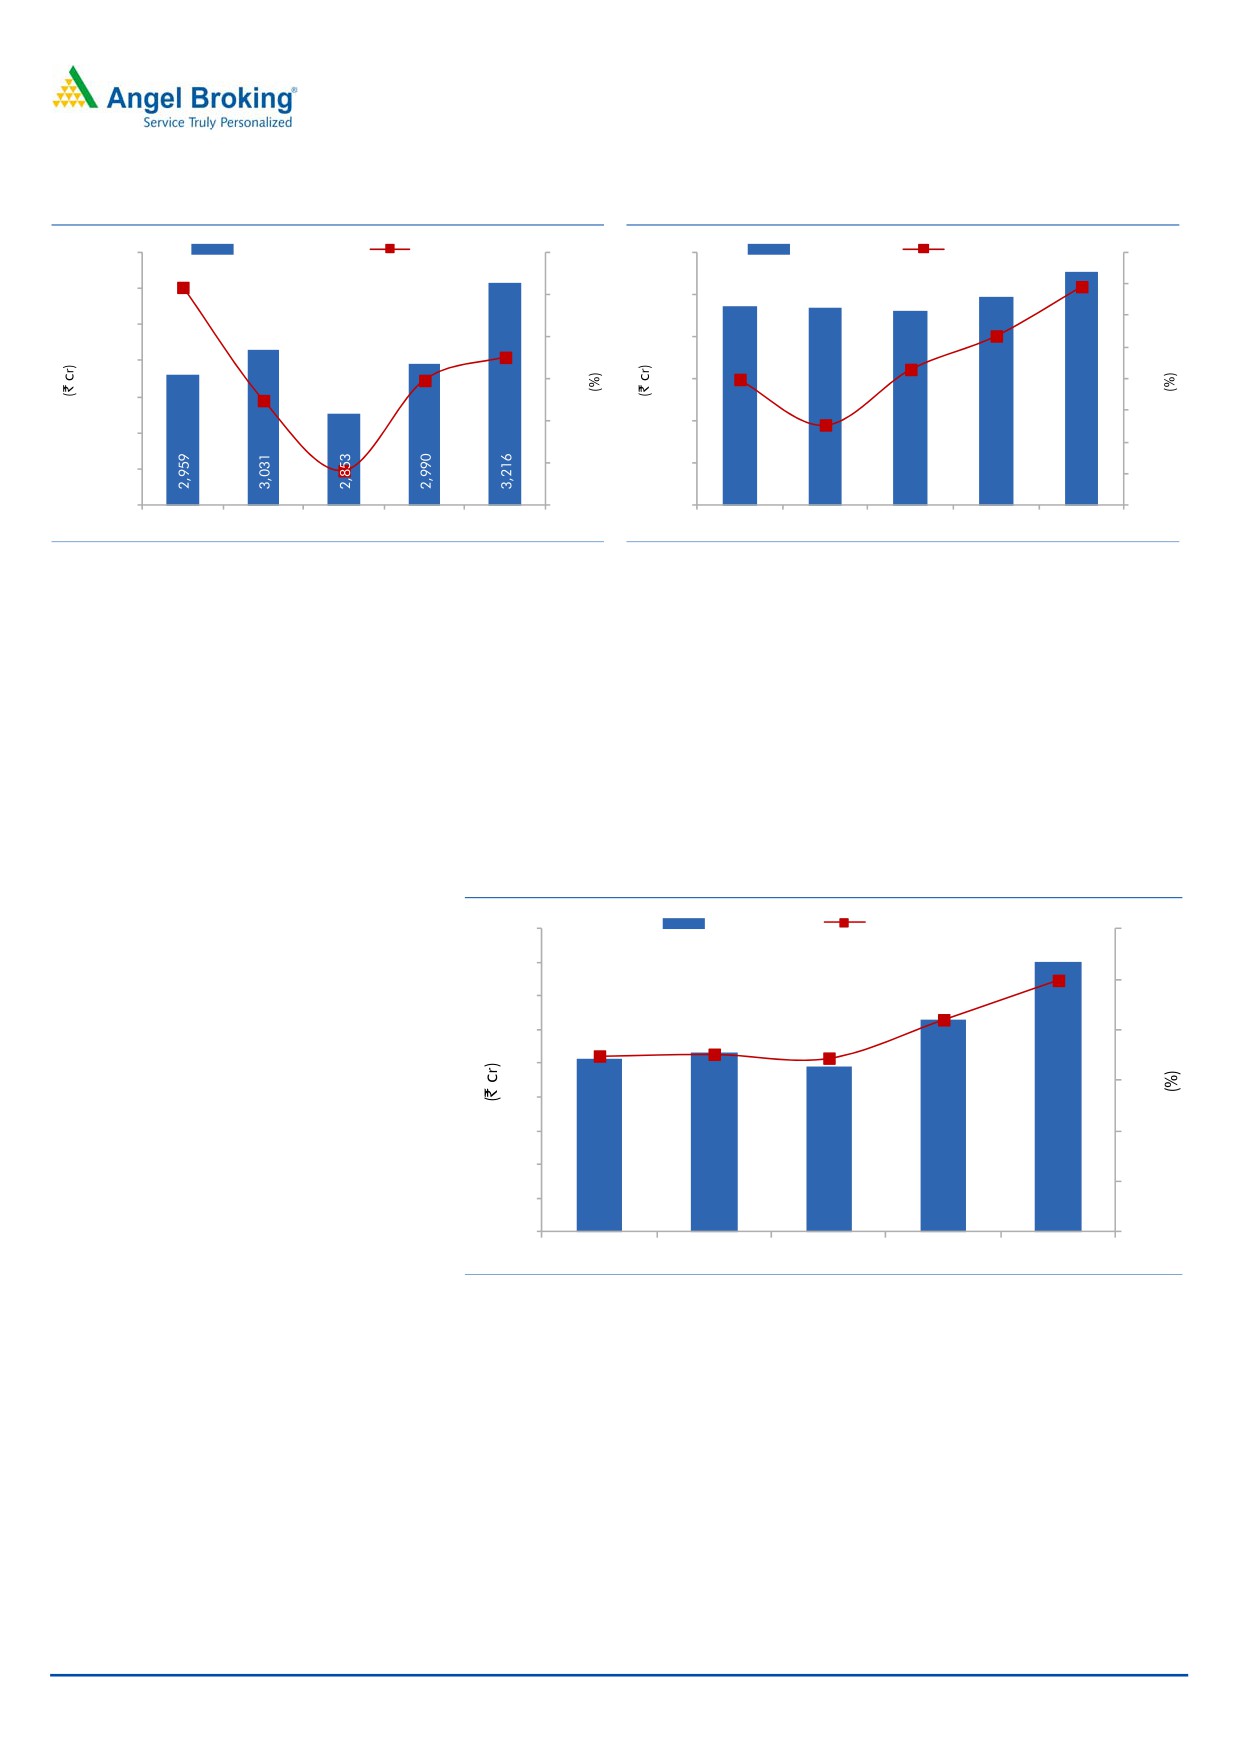
Exhibit 10: Revenue trend
Exhibit 11: EBITDA Margins to improve
3,300
Revenue (LHS)
Growth (RHS)
20.0
300
EBITDA (LHS)
EBITDA Margins (RHS)
8.8
3,200
15.8
8.6
15.0
250
8.6
8.4
3,100
10.0
200
8.3
8.2
3,000
7.6
8.1
5.0
150
8.0
8.0
2,900
4.8
2.4
7.8
-
100
7.7
2,800
7.6
(5.9)
(5.0)
50
2,700
7.4
237
234
230
247
276
2,600
(10.0)
0
7.2
FY2013
FY2014
FY2015E FY2016E FY2017E
FY2013
FY2014
FY2015E
FY2016E
FY2017E
Source: Company, Angel Research
Source: Company, Angel Research
Higher contribution from Lighting to maintain EBITDA margins
Owing to higher contribution from the Lighting business, the EBITDA margins for
the company are expected to improve from 8.1% in FY2015E to 8.6% in FY2017E
despite of declining profitability of the Steel business. The declining interest rate
environment will have a positive impact on leveraged companies like Surya Roshni.
We expect interest expense to decline from `111cr in FY2015E to `98cr in
FY2017E. With the above estimates we believe that the company’s net profit
should improve from `49cr in FY2015E to `80cr in FY2017E.
Exhibit 12: PAT trajectory
PAT (LHS)
PAT Margins (RHS)
90
3.0
80
2.5
2.5
70
2.1
60
1.8
2.0
1.7
1.7
50
1.5
40
30
1.0
20
0.5
10
52
53
49
63
80
0
0.0
FY2013
FY2014
FY2015E
FY2016E
FY2017E
Source: Company, Angel Research
Sensitivity Analysis
Currently, we are accounting for reduction in interest cost for the company with the
rate of interest declining to 10.8% in FY2017E. In the event of the rate increasing
by 150bp, we expect the net profit to be `70cr. Favorably, similar level of decline
will result in a net profit in the range of `90cr.
April 29, 2015
8
Initiating coverage | Surya Roshni
Exhibit 13: IR Sensitivity analysis
FY2017E Interest Rate (%)
FY2017E Net Profit
9.3
89
9.8
86
10.3
83
10.8
80
11.3
77
11.8
73
12.3
70
Source: Company, Angel Research
Outlook and Valuation
We believe that given the shift in trend towards LED lighting, which is expected to
bring a new wave of growth in the lighting industry, the company’s Lighting
business will become a significant contributor to the overall top-line of the
company. Additionally, exploration of newer avenues like foray into the Fans and
Appliances businesses is likely to be a long term revenue driver for the company.
We expect the top-line to post a CAGR of 6.2% over FY2015E-17E to `3,216cr.
Despite of declining profitability of the Steel business, the EBITDA margins are
estimated to improve to 8.6%, mainly due to higher contribution from the Lighting
business. Consequently, the net profit is expected to post a CAGR of 27.7% over
FY2015E-17E to `80cr.
At the current market price, the stock is trading at 6.0x its FY2017E earnings. We
have allocated the entire debt to the Steel business and valued the company on
SOTP basis. We initiate coverage on the company with a Buy rating and target
price of `149.
Exhibit 14: Sum of Parts Valuation
Sum of Parts
EBIT (`)
Target Multiple (x)
Value
Lighting Business
156
9
1,405
Steel Business (net of `913cr of debt)
54
3
(749)
Total Market Cap
655
No. of Shares
4.4
Target Price (`)
149
Source: Company, Angel Research
Exhibit 15: Steel Business Peer comparison (TTM basis)
Sales
EBIT
EBIT Margin
Capital Employed ROCE
(` cr)
(` cr)
(%)
(` cr)
(%)
APL Apollo Consolidated
3,306
169
5.1
1,036
16.4
Surya Roshni
1,992
57
2.9
1,117
5.1
Source: Company, Angel Research
April 29, 2015
9
Initiating coverage | Surya Roshni
Exhibit 16: Lighting Business Peer comparison (TTM basis)
Sales
EBIT
EBIT Margin
Capital Employed
ROCE
(` cr)
(` cr)
(%)
(` cr)
(%)
Orient Paper & Ind Ltd
1,183
43
3.7
328
13.2
Surya Roshni
1,068
122
11.4
643
18.9
Source: Company, Angel Research
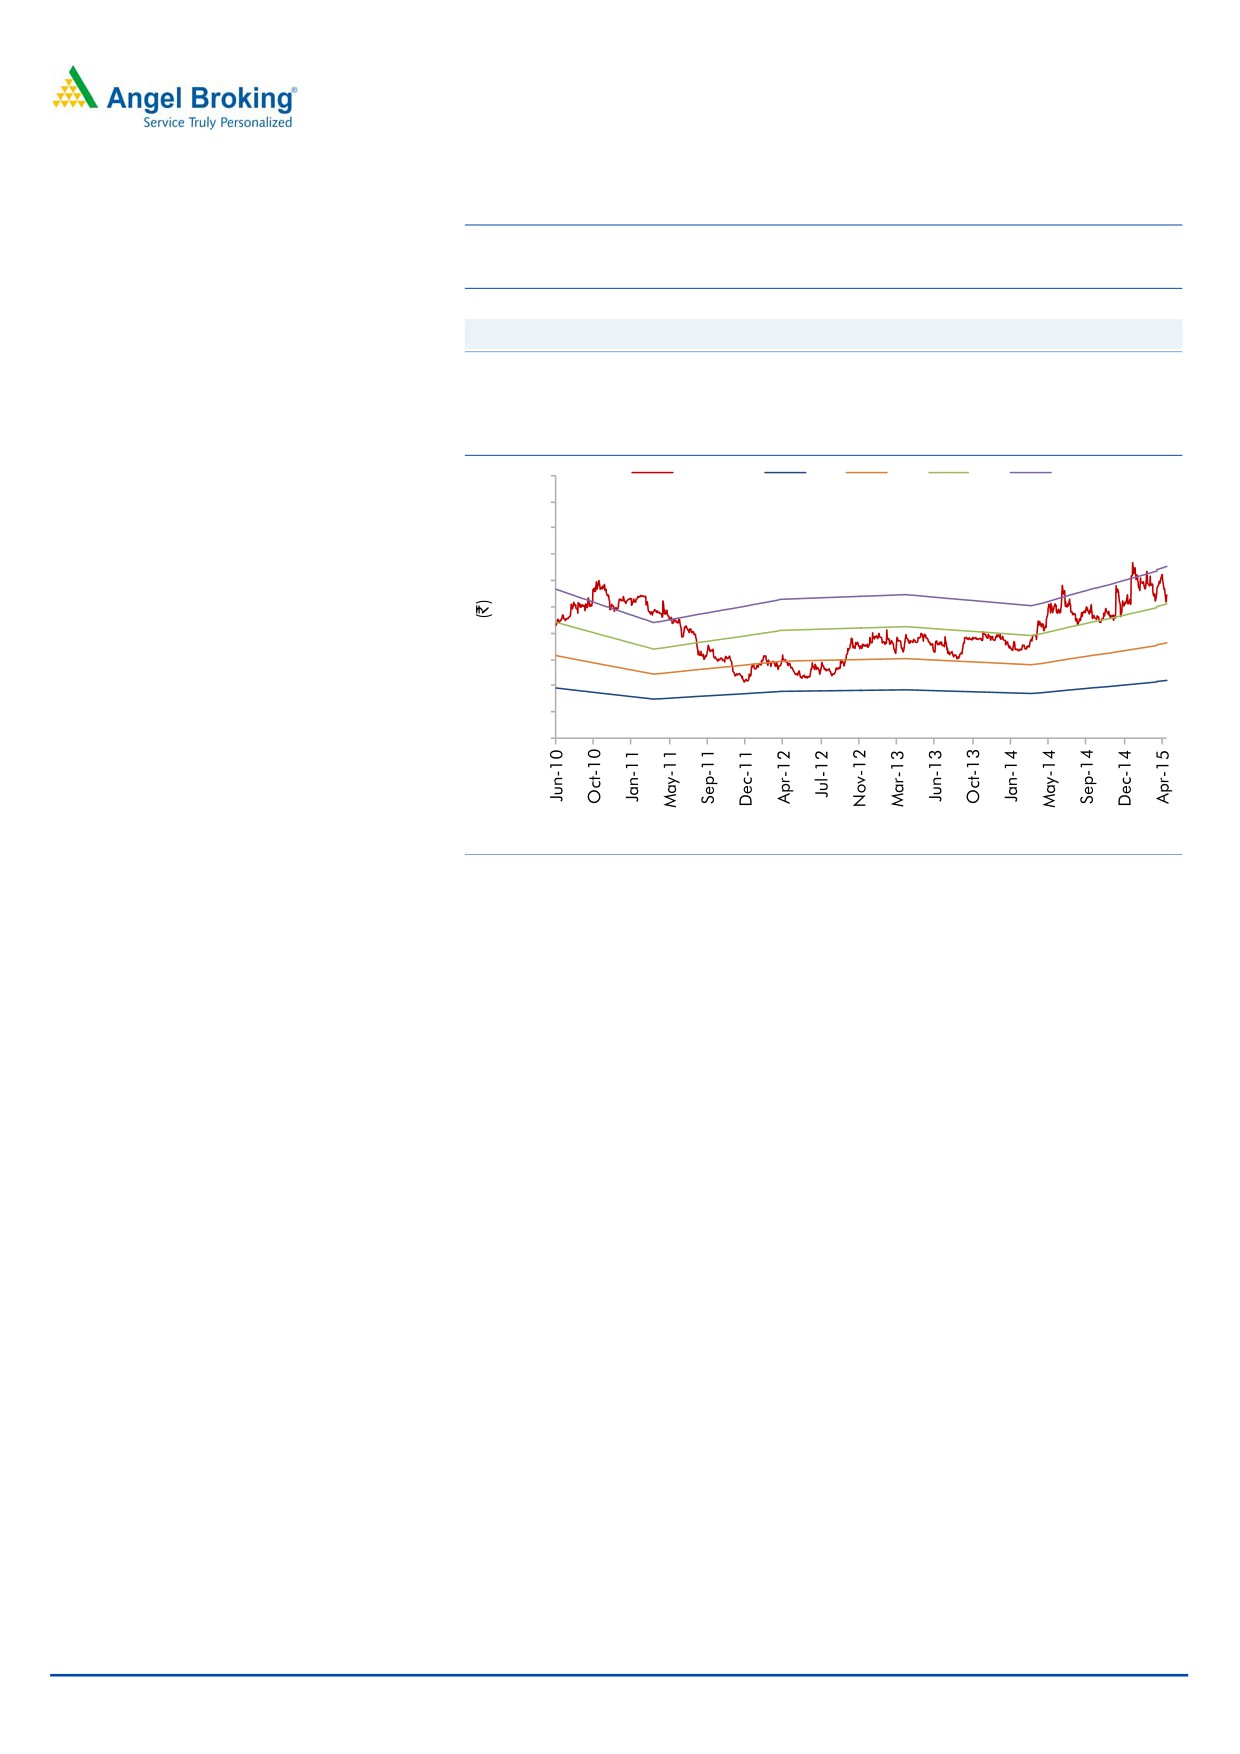
Exhibit 17: One-year forward P/E band
200
Price (`)
3x
5x
7x
9x
180
160
140
120
100
80
60
40
20
0
Source: Company, Angel Research
Key Risks
Competition from Unorganized players - Competition from the unorganized sector
and cheaper imports from China could hurt company’s sales.
Sharp movement in commodity prices - Metal is a major raw material in steel tube
and pipes segment. Steep increase in raw material cost will have a negative impact
on the performance of the company.
Downturn in Economy - Failure in revival of the economy or deterioration in the
economic condition will have a negative impact on both the Steel and Lighting
businesses.
Corporate Guarantee for Loans to Subsidiary - The company has provided
corporate guarantee in favor of bank for loans to its subsidiary Surya Global Steel
Tubes Limited for the sum of `135cr (outstanding portion is `56cr as on 31st March
2014). Non repayment of the loan may result in an increase in debt, thus working
against our estimates. The consolidated debt of the company is estimated to be at
`1,400cr.
We have based our assumptions on the structural shift in the Lighting industry
towards LED lighting. Delay in switchover to LED or any other issues that may
impact the LED switchover will have a negative impact on the revenues of the
company.
April 29, 2015
10
Initiating coverage | Surya Roshni
Company Background
Surya Roshni Limited is a 38 year old conglomerate with its core business
comprising of lighting and steel tube products. The company has nearly four
decades of experience in the steel pipe industry and nearly three decades
experience in the lighting industry. The company is a reputable name in India and
also has presence in over more than 54 countries. It has recently forayed into Fans
and Appliances businesses.
Steel - The company is a leader in the steel pipe industry and is the largest G.I &
Hollow section Pipe manufacturer in India. It has the largest ERW pipe and cold
rolled strips mills at Bahadurgarh, Haryana. It also produces API pipes for India as
well as for export markets. The pipe division produces nearly 8 lakh MT per annum
in various sizes and specifications. The exports from the segment account for
~17% (`340cr) of total revenues.
Lighting
- The company is the second largest lighting company in India
commanding a market share in excess of 25%. The company’s existing range of
products includes LED lamps, CFL, Tube light, GLS, Luminaries and Accessories,
High Mast lighting Systems, Lighting Poles, etc.
Fans - The company has recently entered the Fans business with product offering
that includes ceiling, table, pedestal, wall mounted and exhaust fans.
Approximately, the Fans business accounts for ~`60cr of the overall revenues.
The company in FY2012 had set up a development (R&D) centre in Noida, which
is equipped with most advanced equipments for light measurement and optical
evaluation for conventional lighting as well as LED measurement. It is listed as one
of the best testing laboratories in India by BEE (Bureau of Energy Efficiency) for LED
lighting system.
Plant Locations
Exhibit 18: Plant Locations
Lighting Division
Steel Division
Kashipur, Uttaranchal
Malanpur, Madhya Pradesh
Malanpur, Madhya Pradesh
Bahadurgarh, Haryana
Source: Company
April 29, 2015
11
Initiating coverage | Surya Roshni
Profit and loss statement
Y/E March (` cr)
FY2013
FY2014
FY2015E
FY2016E
FY2017E
Total operating income
2,959
3,031
2,853
2,990
3,216
% chg
15.8
2.4
(5.9)
4.8
7.6
Net Raw Materials
2,251
2,266
2,064
2,169
2,323
% chg
15.4
0.7
(8.9)
5.1
7.1
Personnel
135
151
163
167
180
% chg
6.5
12.2
7.6
3.0
7.6
Other
337
380
397
406
437
% chg
19.6
12.8
4.3
2.4
7.6
Total Expenditure
2,722
2,797
2,623
2,743
2,940
EBITDA
237
234
230
247
276
% chg
20.8
(1.3)
(1.6)
7.6
11.7
(% of Net Sales)
8.0
7.7
8.1
8.3
8.6
Depreciation& Amortisation
57
56
58
62
65
EBIT
180
178
172
186
211
% chg
21.2
(1.2)
(3.6)
8.1
13.8
(% of Net Sales)
6.1
5.9
6.0
6.2
6.6
Interest & other Charges
110
114
111
103
98
(% of Net Sales)
3.7
3.8
3.9
3.4
3.1
Other Income
2
4
1
1
1
(% of Net Sales)
0.1
0.1
0.0
0.0
0.0
Recurring PBT
70
64
61
83
113
% chg
28.7
(9.8)
(4.7)
36.2
37.0
PBT (reported)
72
67
62
84
114
Tax
20
14
13
21
34
(% of PBT)
28.4
20.5
20.5
25.0
30.0
PAT (reported)
52
53
49
63
80
Extraordinary Expense/(Inc.)
-
-
-
-
-
ADJ. PAT
52
53
49
63
80
% chg
20.4
3.5
(7.9)
27.9
27.4
(% of Net Sales)
1.7
1.8
1.7
2.1
2.5
Basic EPS (`)
11.8
12.2
11.2
14.3
18.3
Fully Diluted EPS (`)
11.8
12.2
11.2
14.3
18.3
% chg
20.4
3.5
(7.9)
27.9
27.4
April 29, 2015
12
Initiating coverage | Surya Roshni
Balance Sheet
Y/E March (` cr)
FY2013
FY2014
FY2015E
FY2016E
FY2017E
SOURCES OF FUNDS
Equity Share Capital
44
44
44
44
44
Reserves& Surplus
502
551
595
652
727
Warrants
-
-
-
-
-
Shareholders’ Funds
546
595
639
696
771
Revaluation of Land
186
179
179
179
179
Total Loans
857
1,038
965
936
913
Other Long Term Liabilities
5
6
6
6
6
Long Term Provisions
18
17
17
17
17
Deferred Tax Liability
42
48
48
48
48
Total Liabilities
1,655
1,883
1,854
1,883
1,935
APPLICATION OF FUNDS
Gross Block
1,364
1,470
1,561
1,651
1,735
Less: Acc. Depreciation
511
558
616
678
743
Net Block
853
912
945
973
992
Capital Work-in-Progress
26
54
40
30
23
Investments
50
50
50
50
50
Current Assets
886
1,055
1,020
1,033
1,088
Cash
19
25
31
19
10
Loans & Advances
70
94
86
90
96
Inventory
380
433
429
443
473
Debtors
410
497
469
475
502
Other current assets
6
7
6
6
6
Current liabilities
161
188
201
203
217
Net Current Assets
725
867
819
830
870
Misc. Exp. not written off
-
-
-
-
-
Total Assets
1,655
1,883
1,854
1,883
1,935
April 29, 2015
13
Initiating coverage | Surya Roshni
Cash flow statement
Y/E March (` cr)
FY2013
FY2014
FY2015E FY2016E FY2017E
Profit before tax
72
67
62
84
114
Depreciation
57
56
58
62
65
Change in Working Capital
(50)
(136)
54
(22)
(50)
Direct taxes paid
(20)
(14)
(13)
(21)
(34)
Others
117
116
(1)
(1)
(1)
Cash Flow from Operations
175
89
160
101
94
(Inc.)/Dec. in Fixed Assets
(72)
(133)
(78)
(80)
(77)
(Inc.)/Dec. in Investments
0
0
-
-
-
(Incr)/Decr In LT loans & adv.
-
-
-
-
-
Others
(4)
(13)
1
1
1
Cash Flow from Investing
(77)
(146)
(77)
(78)
(75)
Issue of Equity
(15)
(7)
-
-
-
Inc./(Dec.) in loans
25
181
(73)
(29)
(23)
Dividend Paid (Incl. Tax)
(20)
(5)
(5)
(5)
(5)
Others
(89)
(106)
-
-
-
Cash Flow from Financing
(100)
63
(78)
(34)
(29)
Inc./(Dec.) in Cash
(2)
6
6
(11)
(10)
Opening Cash balances
21
19
25
31
19
Closing Cash balances
19
25
31
19
10
April 29, 2015
14
Initiating coverage | Surya Roshni
Key Ratios
Y/E March
FY2013
FY2014
FY2015E
FY2016E
FY2017E
Valuation Ratio (x)
P/E (on FDEPS)
9.3
9.0
9.8
7.6
6.0
P/CEPS
4.4
4.4
4.5
3.8
3.3
P/BV
0.9
0.8
0.8
0.7
0.6
EV/Net sales
0.4
0.5
0.5
0.5
0.4
EV/EBITDA
5.4
6.2
5.9
5.4
4.8
EV / Total Assets
0.8
0.8
0.7
0.7
0.7
Per Share Data (`)
EPS (Basic)
11.8
12.2
11.2
14.3
18.3
EPS (fully diluted)
11.8
12.2
11.2
14.3
18.3
Cash EPS
24.7
24.9
24.5
28.4
33.1
DPS
4.0
1.0
1.0
1.0
1.0
Book Value
124.6
135.6
145.7
158.8
176.0
DuPont Analysis
EBIT margin
6.1
5.9
6.0
6.2
6.6
Tax retention ratio
0.7
0.8
0.8
0.8
0.7
Asset turnover (x)
1.9
1.8
1.6
1.7
1.8
ROIC (Post-tax)
8.5
8.5
7.8
7.9
8.1
Cost of Debt (Post Tax)
9.3
9.6
8.8
8.1
7.4
Leverage (x)
1.4
1.6
1.4
1.2
1.1
Operating ROE
7.3
6.8
6.5
7.6
8.9
Returns (%)
ROCE (Pre-tax)
11.1
10.1
9.2
9.9
11.1
Angel ROIC (Pre-tax)
11.9
10.7
9.8
10.5
11.6
ROE
9.9
9.4
8.0
9.4
10.9
Turnover ratios (x)
Asset TO (Gross Block)
2.2
2.1
1.9
1.9
1.9
Inventory / Net sales (days)
47
49
55
53
52
Receivables (days)
46
55
60
58
57
Payables (days)
18
23
28
27
27
WC cycle (ex-cash) (days)
84
93
104
98
95
Solvency ratios (x)
Net debt to equity
1.4
1.6
1.4
1.2
1.1
Net debt to EBITDA
3.3
4.1
3.8
3.5
3.1
Int. Coverage (EBIT/ Int.)
1.6
1.6
1.5
1.8
2.2
April 29, 2015
15
Initiating coverage | Surya Roshni
Research Team Tel: 022 - 39357800
DISCLAIMER
Angel Broking Private Limited (hereinafter referred to as “Angel”) is a registered Member of National Stock Exchange of India Limited,
Bombay Stock Exchange Limited and MCX Stock Exchange Limited. It is also registered as a Depository Participant with CDSL and
Portfolio Manager with SEBI. It also has registration with AMFI as a Mutual Fund Distributor. Angel has received in-principal approval
from SEBI for registering as a Research Entity in terms of SEBI (Research Analyst) Regulations, 2014. Angel or its associates has not
been debarred/ suspended by SEBI or any other regulatory authority for accessing /dealing in securities Market. Angel or its associates
including its relatives/analyst do not hold any financial interest/beneficial ownership of more than 1% in the company covered by
Analyst. Angel or its associates/analyst has not received any compensation / managed or co-managed public offering of securities of
the company covered by Analyst during the past twelve months. Angel/analyst has not served as an officer, director or employee of
company covered by Analyst and has not been engaged in market making activity of the company covered by Analyst.
This document is solely for the personal information of the recipient, and must not be singularly used as the basis of any investment
decision. Nothing in this document should be construed as investment or financial advice. Each recipient of this document should
make such investigations as they deem necessary to arrive at an independent evaluation of an investment in the securities of the
companies referred to in this document (including the merits and risks involved), and should consult their own advisors to determine
the merits and risks of such an investment.
Reports based on technical and derivative analysis center on studying charts of a stock's price movement, outstanding positions and
trading volume, as opposed to focusing on a company's fundamentals and, as such, may not match with a report on a company's
fundamentals.
The information in this document has been printed on the basis of publicly available information, internal data and other reliable
sources believed to be true, but we do not represent that it is accurate or complete and it should not be relied on as such, as this
document is for general guidance only. Angel Broking Pvt. Limited or any of its affiliates/ group companies shall not be in any way
responsible for any loss or damage that may arise to any person from any inadvertent error in the information contained in this report.
Angel Broking Pvt. Limited has not independently verified all the information contained within this document. Accordingly, we cannot
testify, nor make any representation or warranty, express or implied, to the accuracy, contents or data contained within this document.
While Angel Broking Pvt. Limited endeavors to update on a reasonable basis the information discussed in this material, there may be
regulatory, compliance, or other reasons that prevent us from doing so.
This document is being supplied to you solely for your information, and its contents, information or data may not be reproduced,
redistributed or passed on, directly or indirectly.
Neither Angel Broking Pvt. Limited, nor its directors, employees or affiliates shall be liable for any loss or damage that may arise from
or in connection with the use of this information.
Note: Please refer to the important 'Stock Holding Disclosure' report on the Angel website (Research Section). Also, please refer to the
latest update on respective stocks for the disclosure status in respect of those stocks. Angel Broking Pvt. Limited and its affiliates may
have investment positions in the stocks recommended in this report.
Disclosure of Interest Statement
Surya Roshni
1. Analyst ownership of the stock
No
2. Angel and its Group companies ownership of the stock
No
3. Angel and its Group companies' Directors ownership of the stock
No
4. Broking relationship with company covered
No
Note: We have not considered any Exposure below ` 1 lakh for Angel, its Group companies and Directors
Ratings (Based on expected returns
Buy (> 15%)
Accumulate (5% to 15%)
Neutral (-5 to 5%)
over 12 months investment period):
Reduce (-5% to -15%)
Sell (< -15
April 29, 2015
16