4QFY2016 Result Update | Pharmaceutical
June 10, 2016
Sun Pharma
BUY
CMP
`739
Performance Highlights
Target Price
`944
(` cr)
4QFY2016 3QFY2016
% chg QoQ 4QFY2015
% chg yoy
Investment Period
12 months
Net sales
7,414
7,047
5.2
6,145
20.7
Other income
185
255
(27.2)
396
(53.2)
Stock Info
Gross profit
5,962
5,291
12.7
4,547
31.1
Sector
Pharmaceutical
Operating profit
2,300
2,134
7.8
880
161.3
Market Cap (` cr)
1,77,811
Adj. Net profit
1,714
1,417
21.0
889
92.7
Net Debt (` cr)
(6,960)
Source: Company, Angel Research
Beta
0.8
For 4QFY2016, Sun Pharmaceuticals Industries (Sun Pharma) posted results
52 Week High / Low
965/706
marginally lower than our expectations. Sales for the quarter, at `7,414cr (V/s
Avg. Daily Volume
4,23,363
`7,700cr estimated) grew 20.7% yoy. On the operating front, the company
Face Value (`)
1
posted an OPM of 31.0% V/s 14.3% in 4QFY2015 and V/s our expectation of
BSE Sensex
27,010
34.9%. Thus, the net profit came in at `1,714cr V/s `1,653cr expected and V/s
Nifty
8,266
`889cr in 4QFY2015, a yoy growth of 92.7%. For FY2017, the company has guided
Reuters Code
SUN.BO
for 8-10% yoy growth, while R&D expenses are expected to be 9% of sales in
Bloomberg Code
SUNP@IN
FY2017. However, we are currently maintaining our buy with target price of `944.
Results mostly in line with expectations: For 4QFY2016, Sun Pharma posted
Shareholding Pattern (%)
results marginally lower than our expectations. Sales for the quarter, at `7,414cr
Promoters
55.0
(V/s `7,700cr estimated) grew 20.7% yoy. The Indian formulations market
MF / Banks / Indian Fls
11.6
posted a growth of 17% yoy to `1807cr. US finished dosage sales at US$580mn
FII / NRIs / OCBs
26.7
were up by 19% yoy. US sales include the benefit of the 180-day exclusivity for
Indian Public / Others
6.7
Imatinib which commenced from Feb 2016. Emerging Markets sales stood at
US$124mn, while Rest of World (RoW) sales came in at US$79mn.On the
operating front, the company posted an OPM of 31.0% V/s 14.3% in 4QFY2015
Abs. (%)
3m 1yr
3yr
and V/s our expectation of 34.9%. R&D expenditure during the quarter was 9.6%
Sensex
9.6
0.9
39.0
of sales. Thus, the net profit came in at `1,714cr V/s `1,653cr expected and V/s
Sun Pharma
(13.8)
(12.9)
45.9
`889cr in 4QFY2015, a yoy growth of 92.7%. Other income during the quarter
came in at `185cr V/s `396cr in 4QFY2015.
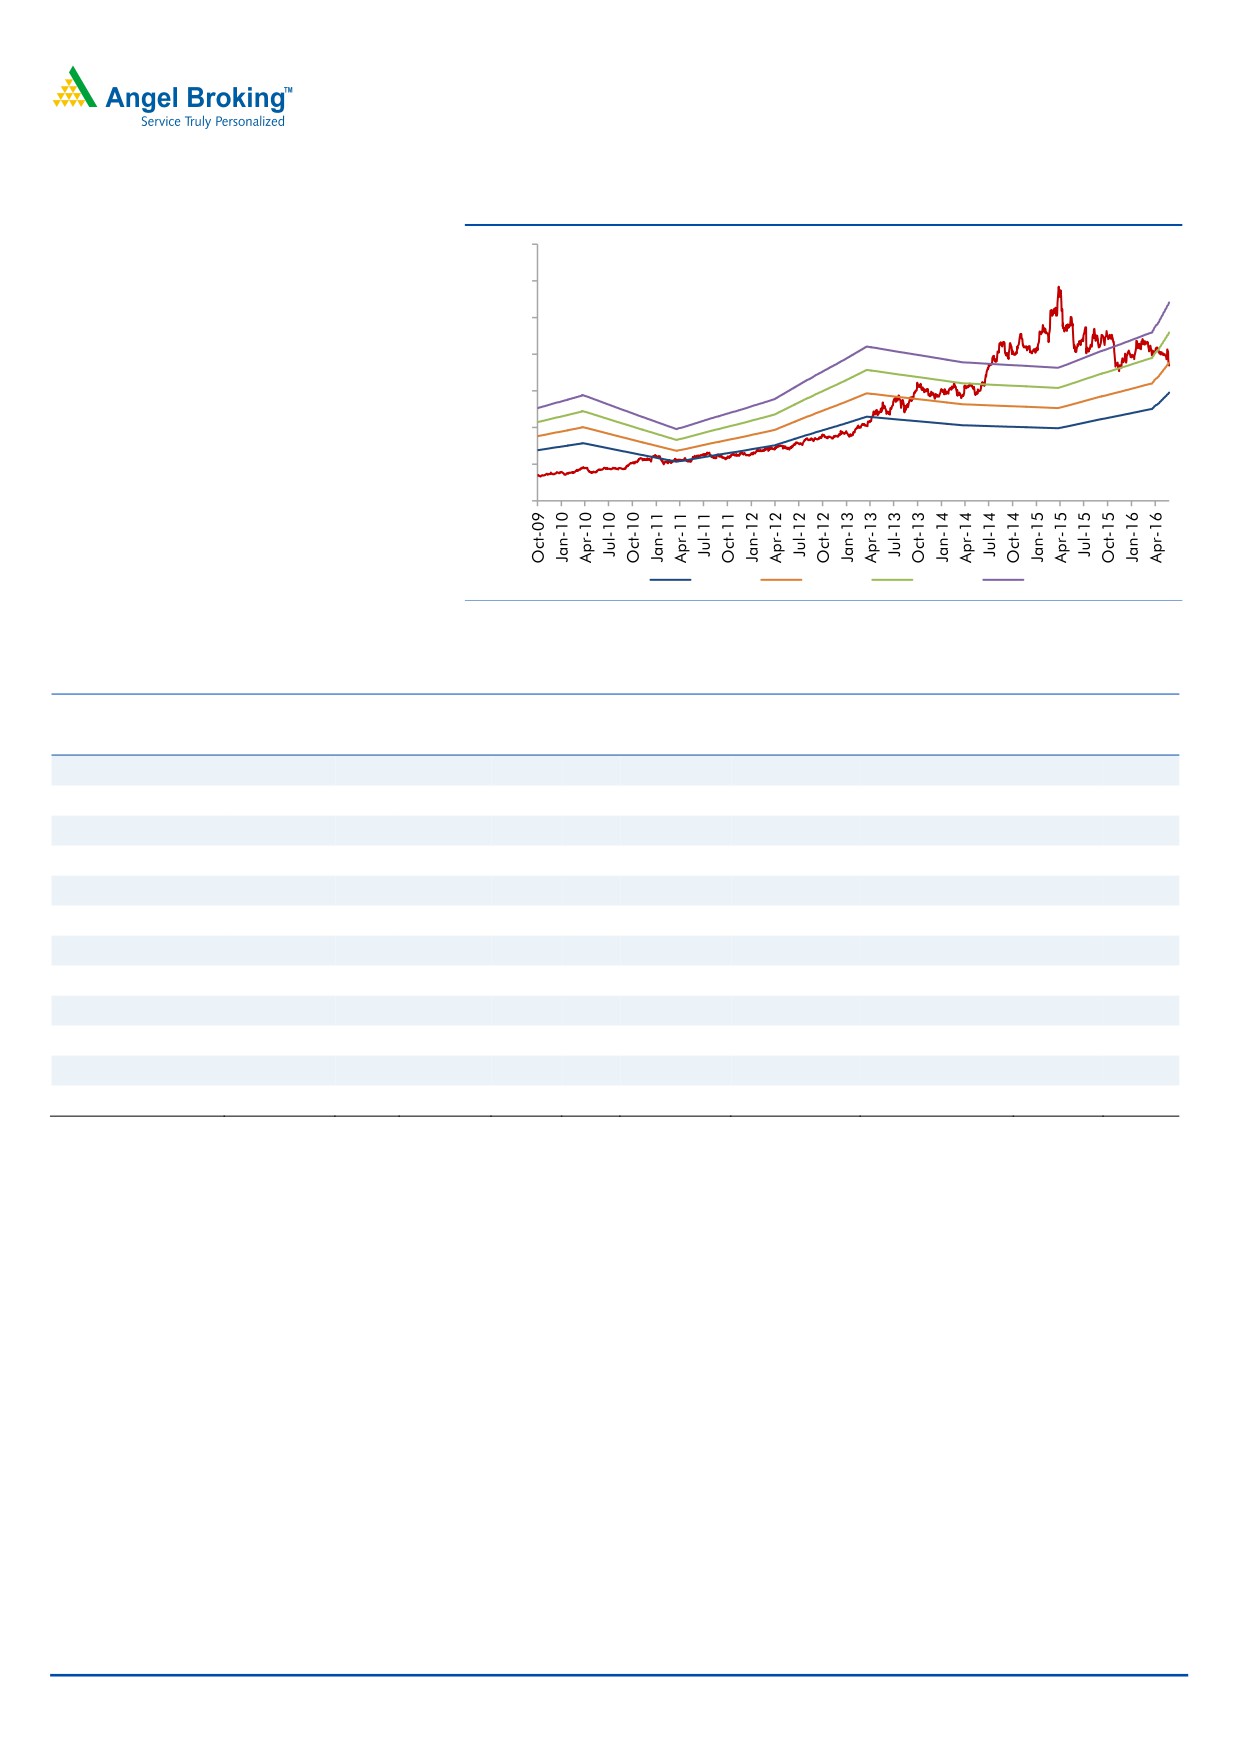
3-year price chart
Outlook and valuation: Sun Pharma is one of the largest and fastest growing
1,200
Indian pharmaceutical companies. We expect its net sales to post a 12.7% CAGR
1,000
(including Ranbaxy Laboratories) to `35,258cr and EPS to post a 22.0% CAGR to
800
`32.8 over FY2016-18E. We recommend a Buy on the stock.
600
Key financials (Consolidated)
400
Y/E March (` cr)
FY2015
FY2016
FY2017E
FY2018E
200
Net sales
27,287
27,744
31,129
35,258
% chg
70.6
1.7
12.2
13.3
Adj. Net profit
4,743
5,306
6,735
7,895
Source: Company, Angel Research
% chg
(10.0)
11.9
26.9
17.2
EPS (`)
22.9
22.0
28.0
32.8
EBITDA margin (%)
28.6
26.2
30.0
30.9
P/E (x)
32.3
33.5
26.4
22.5
RoE (%)
21.1
18.3
18.7
18.9
RoCE (%)
21.1
16.6
17.7
33.1
P/BV (x)
6.7
4.9
4.0
3.4
Sarabjit Kour Nangra
EV/Sales (x)
5.5
6.2
5.4
4.5
+91 22 39357600 Ext: 6806
EV/EBITDA (x)
19.1
23.8
17.9
14.7
Source: Company, Angel Research; Note: CMP as of June 7, 2016
Please refer to important disclosures at the end of this report
1
Sun Pharma | 4QFY2016 Result Update
Exhibit 1: 4QFY2016 performance (Consolidated)
Y/E March (` cr)
4QFY2016
3QFY2016
% chg QoQ 4QFY2015
% chg yoy FY2016
FY2015
% chg
Net sales
7,414
7,047
5.2
6,145
20.7
27,744
27,287
1.7%
Other income
185.3
254.7
(27.2)
395.8
(53.2)
984.8
599.0
64.4
Total income
7,599
7,301
4.1
6,541
16.2
28,729
27,886
3.0
Gross profit
5,962
5,291
12.7
4,547
31.1
21,261
20,547
3.5
Gross margin (%)
80.4
75.1
74.0
76.6
75.3
Operating profit
2,300
2,134
7.8
880
161.3
7,271
7,679
(5.3)
Operating margin (%)
31.0
30.3
14.3
26.2
28.1
Interest
89
117
(24.3)
125
(29.0)
477
579
(17.6)
Depreciation
264
251
5.4
562
(53.0)
1,014
1,295
(21.7)
Extraordinary item loss/ ( gain)
0
0
0
(590)
(204)
PBT
2,132
2,020
5.5
589
261.8
6,765
6,404
5.6
Provision for taxation
170.6
202.0
(15.6)
(599.9)
(128.4)
935
915
2.2
PAT before extra-ordinary item
1,962
1,818
7.9
1,189
65.0
5,830
5,489
6.2
Minority interest(MI)
248
402
(38.2)
301
(17.6)
1,114
949
17.5
Reported PAT
1,714
1,417
21.0
889
92.7
4,716
4,540
3.9
Adj. PAT
1,714
1,417
21.0
889
92.7
5,306
4,743
11.9
Adj. EPS (`)
7.1
5.9
3.7
22.0
22.9
Source: Company, Angel Research
Exhibit 2: 4QFY2016 - Actual V/s Angel estimates
(` cr)
Actual
Estimates
Variance (%)
Net sales
7,414
7,700
(3.7)
Other income
185
255
(27.2)
Operating profit
2,300
2,690
(14.5)
Tax
171
396
(56.9)
Adj. Net profit
1,714
1,653
3.7
Source: Company, Angel Research
Lower than expected performance: Sun Pharma posted marginally lower than
expected results for the quarter. Sales grew 20.7% yoy to `7,414cr (V/s `7,700cr
estimated). Amongst the key markets- India (`1,807cr) posted a growth of 17%
yoy, US (US$580mn) posted a growth of 19% yoy, Emerging Markets (US$124mn)
were flat and ROW (US$79mn) was down 6% yoy.
Sale of branded formulations in India for 4QFY2016 stood at `1,807cr, up 17%
yoy from the corresponding quarter last year and accounted for 24% of total sales.
Withdrawal of bonus offers continues to adversely impact sales in the acute
segment. For FY2016, sales were at `7,254cr, higher by 9% yoy over the same
period last year. Sun Pharma is ranked No. 1 and holds ~8.8% market share in
the `98,000cr pharmaceutical market as per the March-2016 AIOCD-AWACS
report.
In USD terms, sales in the US came in at US$580mn for the quarter, accounting
for 52% of total sales. Sales for the quarter were boosted primarily due to the
benefit of the 180-day exclusivity for Imatinib which commenced from 01-Feb-
2016. At the same time, Taro posted 4QFY2016 sales of US$265mn, up 9% yoy.
For FY2016, sales were up by 10% yoy to US$951mn.
June 10, 2016
2
Sun Pharma | 4QFY2016 Result Update
Sales in emerging markets were at US$124mn for 4QFY2016, flat compared to
the same period last year and accounted for 11% of total sales. For FY2016, sales
were at US$548mn, a drop of 10% over the previous year. The decline is largely a
result of volatile currency movements in certain emerging markets and a strategic
decision of not participating in some low margin businesses.
Formulation sales in Rest of World (ROW) markets excluding US and Emerging
Markets were US$79mn in 4QFY2016, a de-growth of
6% yoy from the
corresponding quarter last year. For FY2016, sales were at US$330mn, a
reduction of 13% over same period last year. A conscious effort at reducing the
participation in non-remunerative businesses has contributed to de-growth in the
business. ROW markets accounted for ~7% of revenues for 4QFY2016.
The company had a total of 413 ANDAs filed with the USFDA. Currently, ANDAs
for 159 products await USFDA approval, including 14 tentative approvals.
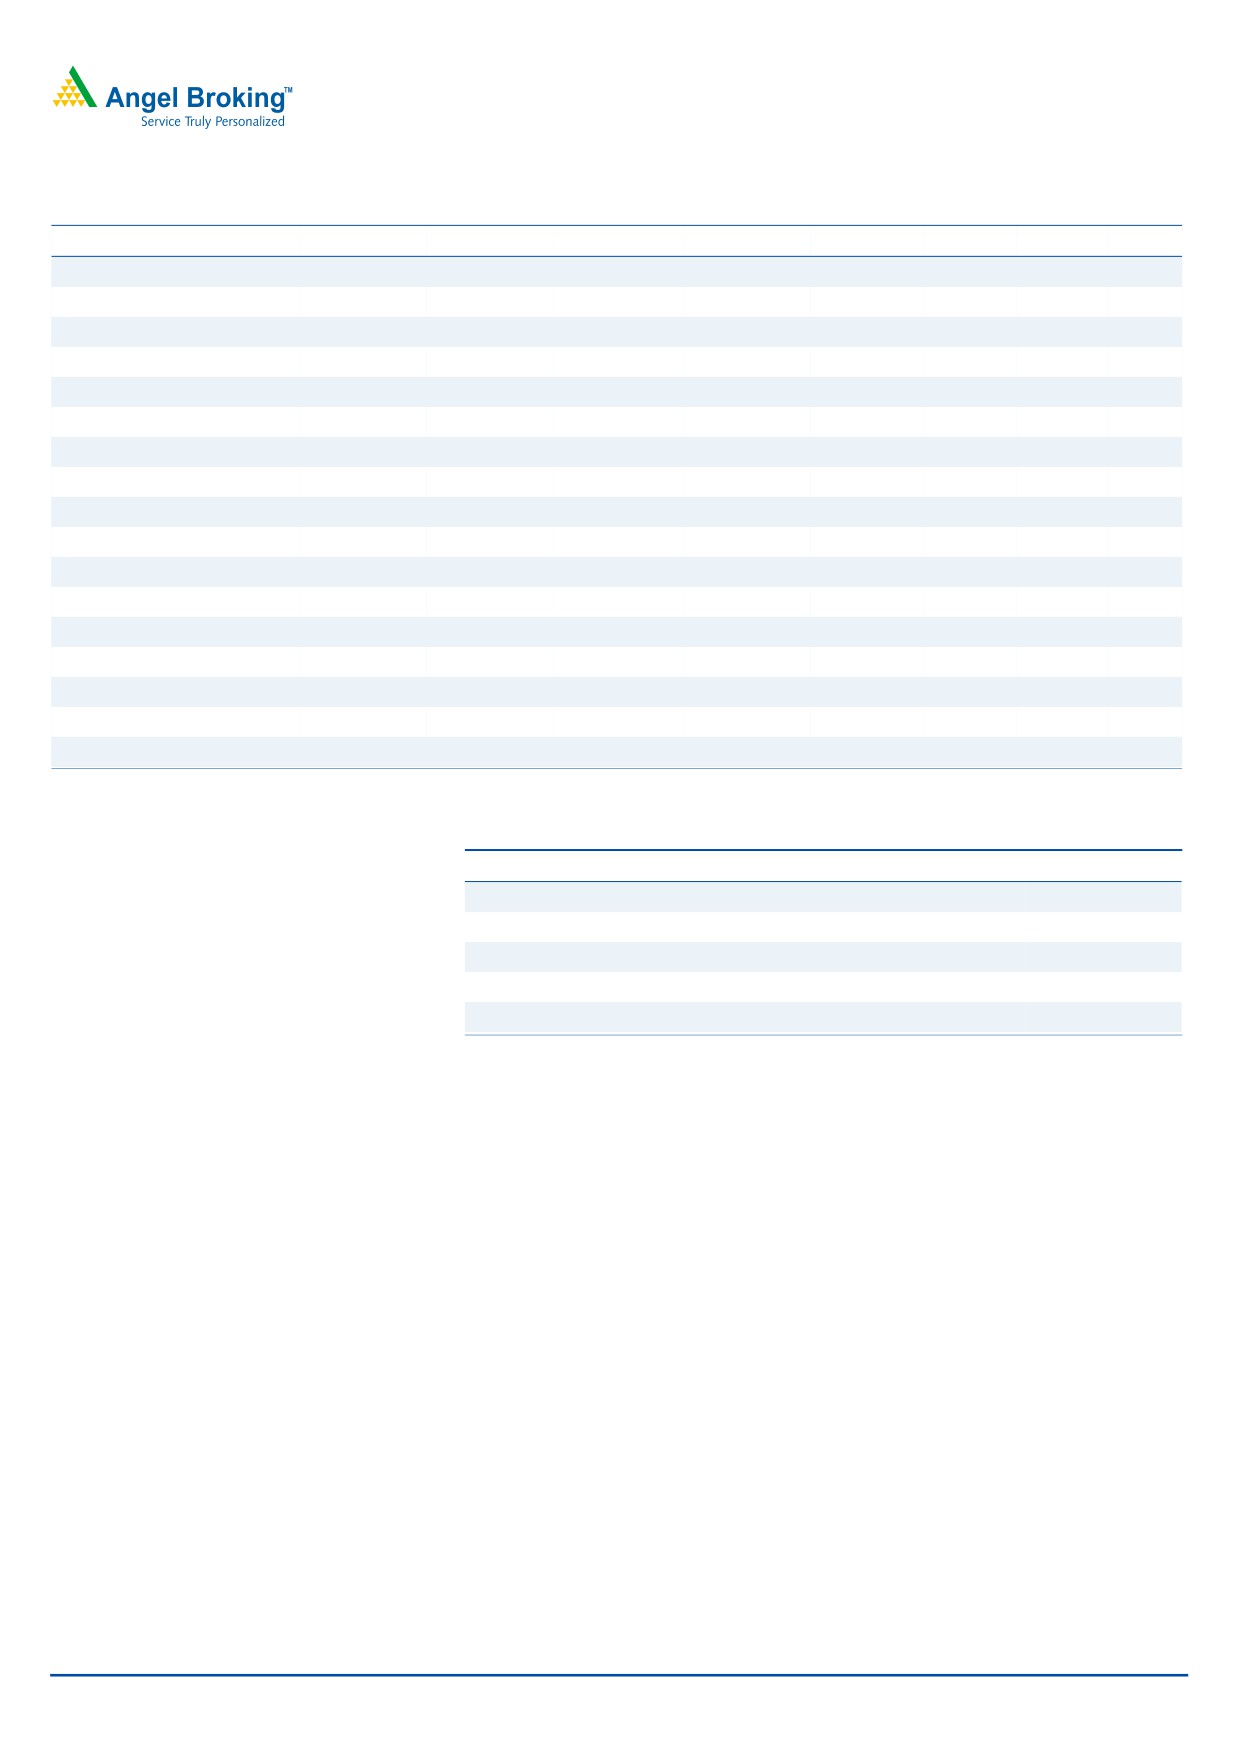
Exhibit 3: Sales trend
6,000
5,000
4,000
3,000
2,000
1,000
0
4QFY2015
1QFY2016
2QFY2016
3QFY2016
4QFY2016
Domestic Formulation
Export Formulation, Bulk and others
Source: Company, Angel Research
OPM at 31.0%; higher than an expected 34.9%: On the operating front, the
company posted an OPM of 31.0% V/s 14.3% in 4QFY2015. This is against our
expectation of 34.9%. Sun Pharma had launched generic Gleevec in Feb 2016 in
the US under 180 days exclusivity. Being the sole generic player in the market, the
company has generated sales of close to US$110m-115m from the product. The
R&D expenditure was 9.1% of sales V/s 9.4% of sales in 4QFY2015.
June 10, 2016
3
Sun Pharma | 4QFY2016 Result Update
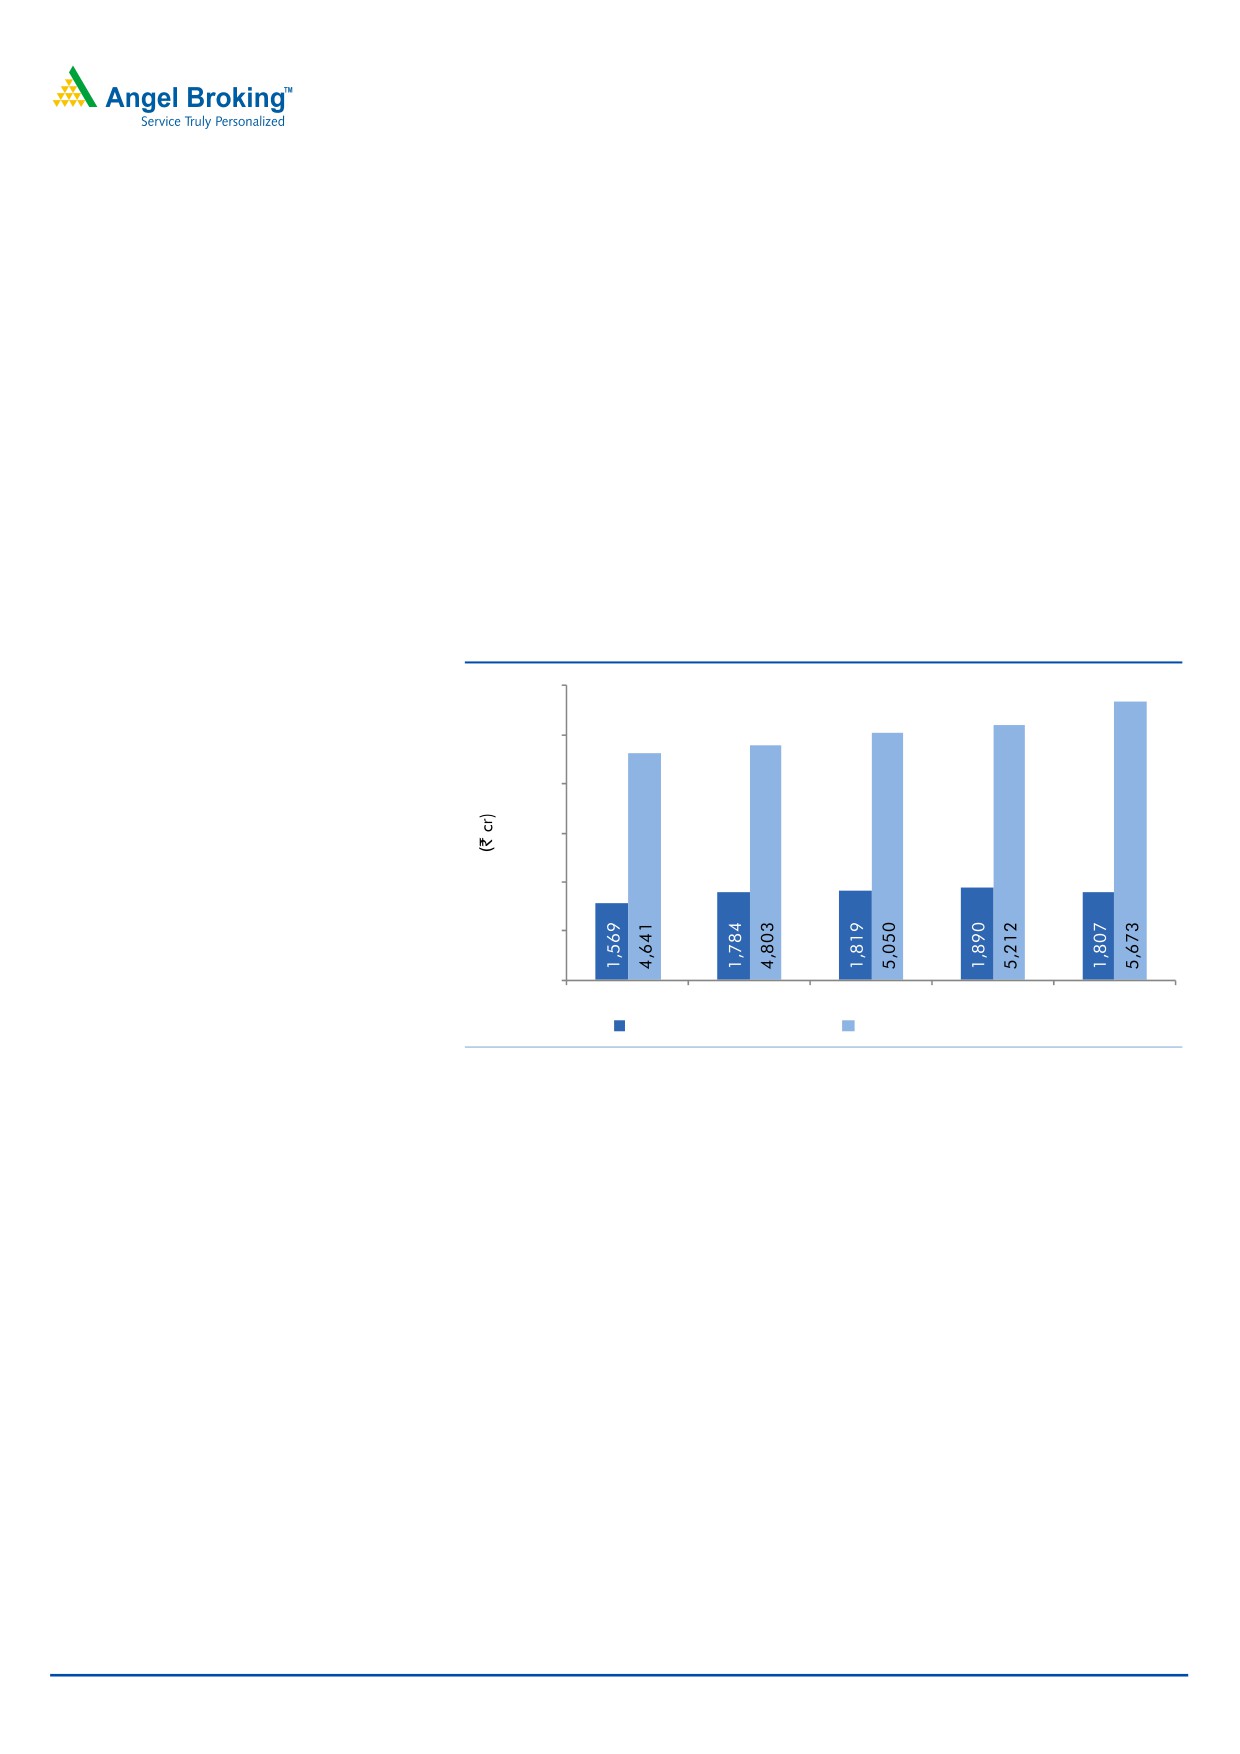
Exhibit 4: OPM trend (%)
40.0
30.3
31.0
27.9
30.0
24.8
20.0
14.3
10.0
4QFY2015
1QFY2016
2QFY2016
3QFY2016
4QFY2016
Source: Company, Angel Research, Note- post 4QFY2015 numbers are of merged entity
Net profit came in higher than our expectation: Thus, the net profit came in at
`1,714cr V/s `1,653cr expected and V/s `889cr in 4QFY2015, a yoy growth of
92.7%. Other income during the quarter came in at `185.3cr V/s `395.8cr in
4QFY2015.
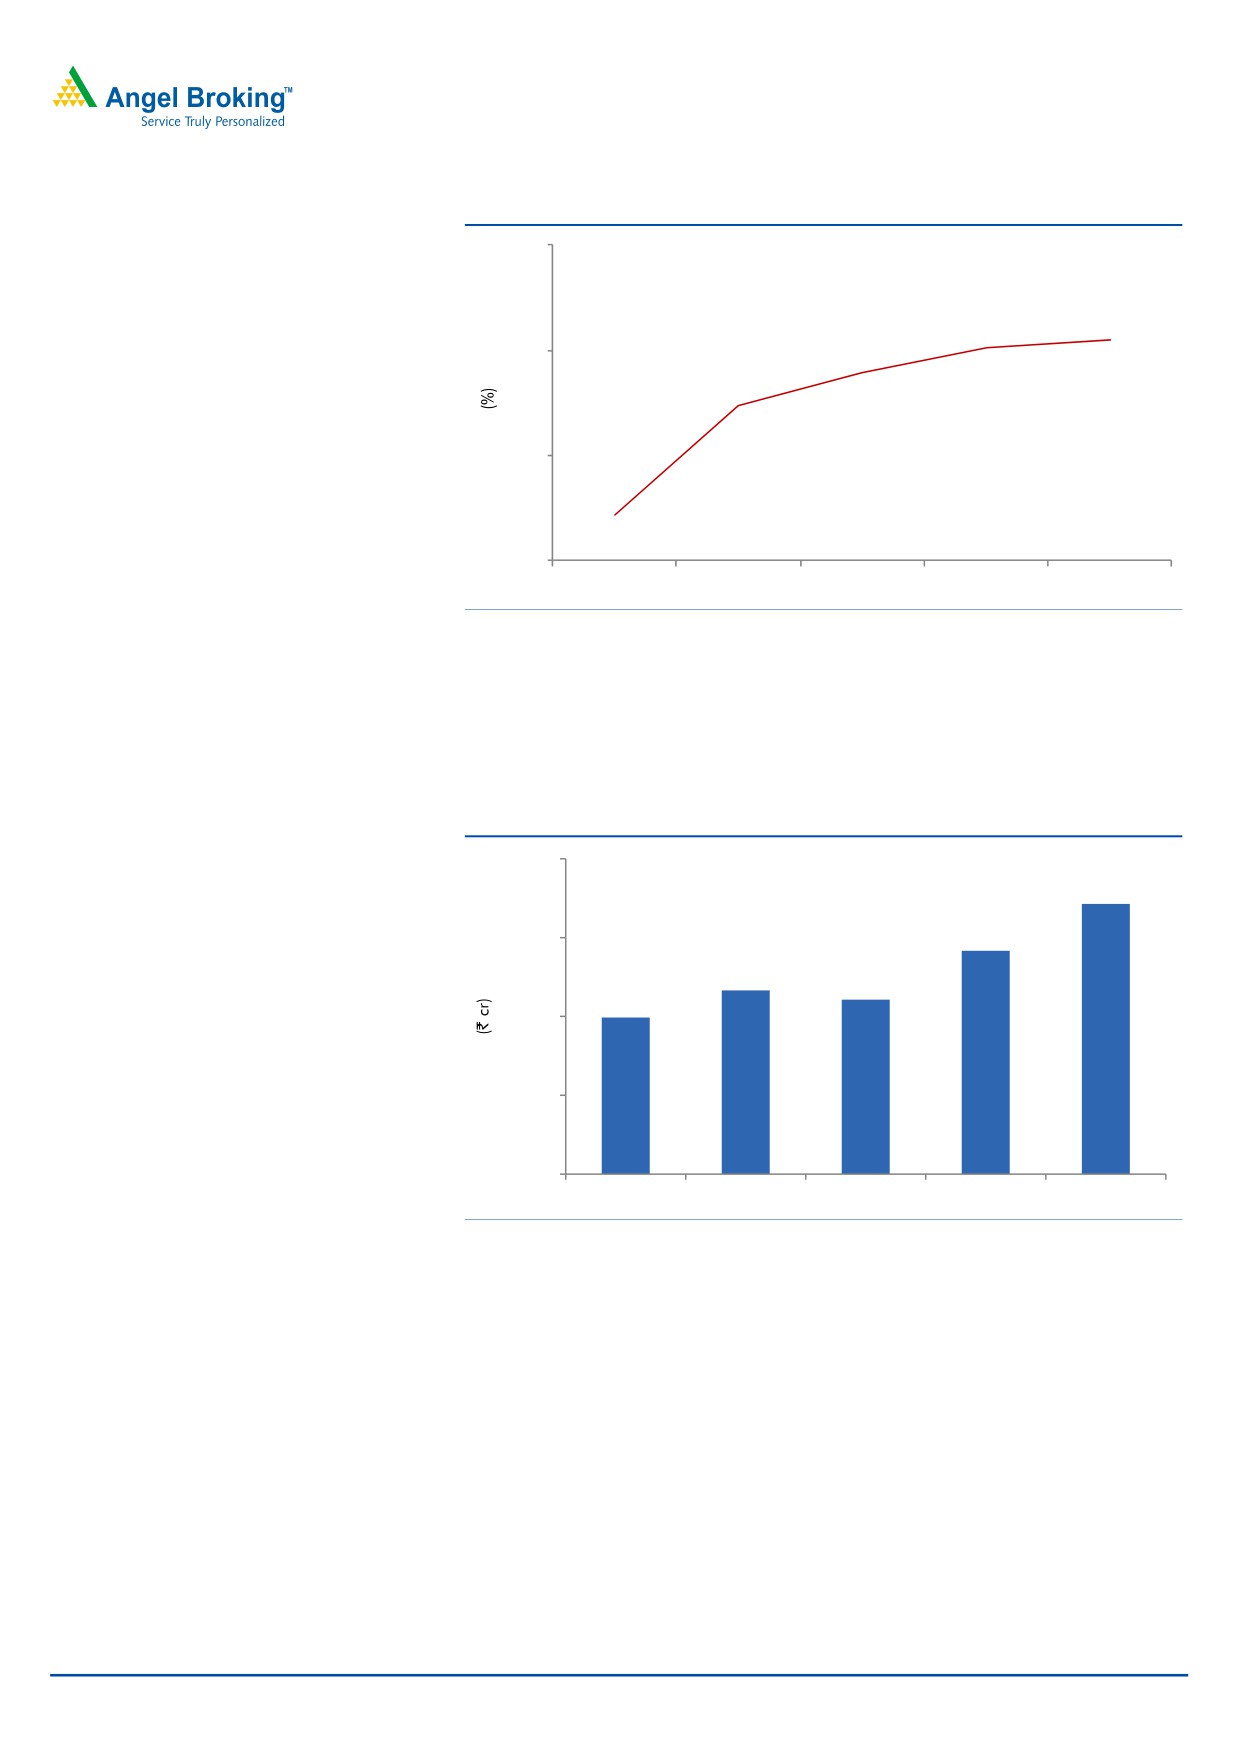
Exhibit 5: Adjusted Net profit trend (`cr)
2,000
1,714
1,500
1,417
1,165
1,107
993
1,000
500
0
4QFY2015
1QFY2016
2QFY2016
3QFY2016
4QFY2016
Source: Company, Angel Research
Concall takeaways
Guidance for top-line growth of 8-10% in FY2017, while R&D expenses to be
at 9% of sales in FY2017.
Halol remediation to be completed in 1QFY2017 and re-inspection is
expected in the near-term.
Tax rate guidance of 14-15% provided for FY2017.
The company is on track to achieve US$300m from Ranbaxy synergies by
FY2018E; a part of it will also be in FY2017.
June 10, 2016
4
Sun Pharma | 4QFY2016 Result Update
Investment arguments
Strongest ANDA pipeline: Sun Pharma, with the recent acquisitions of DUSA, URL
Pharma and Ranbaxy Laboratories, has now become strong in the US region, with
the geography accounting for 52% of its sales in FY2016. In terms of ANDAs, the
company cumulatively has 413 products, out of which 159 products now await
USFDA approval, including 13 tentative approvals. With the merger of Ranbaxy
Laboratories, the company is now the fifth-largest specialty generics company in
the world (behind Teva, Sandoz, Activas and Mylan). However, the near term
performance of the company has been impacted on back of supply constraints at
the Halol facility, although the company has take redemption measures including
site transfers. Overall, we expect the region to post a 14.5% CAGR in sales over
FY2016-18E, accounting for almost 49% of the overall sales in FY2018E.
Domestic business: Sun Pharma’s domestic formulation business is among the
fastest growing in the Indian pharmaceutical industry. It contributed 23% to the
company’s total turnover in FY2014. Sun Pharma is ranked second and holds a
market share of 5.4% in the domestic formulation market, with exposure to
psychiatry, neurology, CVS, diabetic and gastroenterology segments. With Ranbaxy
Laboratories’ merger, the company is now the segment leader with a 9.2% market
share in the domestic formulation market, followed by Abbott India which has a
market share of 6.5%. This is a significant gap considering that the segment is
highly fragmented. We expect the domestic formulation business to post a CAGR
of 12.5% over FY2016-18E, contributing 25% to the overall formulation sales of
the company in FY2018.
Healthy balance sheet: Sun Pharma has one of the strongest balance sheets in the
sector with cash of
~`15,000cr. The same can continue to support the
Management in inorganic growth and in scouting for acquisitions, especially in the
US and in emerging markets.
Outlook and valuation: Sun Pharma is one of the largest and fastest growing
Indian pharmaceutical companies. We expect its net sales to post a 12.7% CAGR
(including Ranbaxy Laboratories) to `35,258cr and EPS to post an 22.0% CAGR to
`32.8 over FY2016-18E. We recommend a Buy on the stock.
Exhibit 6: Key assumptions
FY2017E
FY2018E
Domestic Formulation sales growth (%)
10.0
15.0
Export Formulation sales growth (%)
14.3
13.5
Growth in employee expenses (%)
15.0
20.0
Operating margins (%)
30.0
30.9
Tax as % of PBT
15.0
15.0
Source: Company, Angel Research
June 10, 2016
5
Sun Pharma | 4QFY2016 Result Update
Exhibit 7: One-year forward PE band
1,400
1,200
1,000
800
600
400
200
-
10x
15x
20x
25x
Source: Company, Angel Research
Exhibit 8: Valuation summary
Company
Reco
CMP
Tgt. price Upside
FY2017E
FY15-17E
FY2017E
(`)
(`)
% PE (x) EV/Sales (x) EV/EBITDA (x)
CAGR in EPS (%)
RoCE (%) RoE (%)
Alembic Pharma
Neutral
557
-
-
29.8
3.0
18.2
11.4
22.0
20.1
Aurobindo Pharma Accumulate
773
768
10.8
20.1
3.1
14.5
11.4
21.4
27.7
Cadila Healthcare
Buy
320
400
25.0
18.7
2.9
13.2
22.9
24.2
28.8
Cipla
Neutral
469
-
-
21.6
2.7
15.3
4.9
11.1
13.7
Dr Reddy's
Accumulate
3,158
3,476
10.1
20.7
3.0
12.3
6.8
19.2
18.7
Dishman Pharma
Neutral
152
-
-
15.2
1.6
7.7
15.9
9.4
11.0
GSK Pharma
Neutral
3,515
-
-
58.4
8.1
43.0
0.0
33.0
29.9
Indoco Remedies
Neutral
282
-
-
20.7
2.2
12.4
23.0
19.7
19.7
Ipca labs
Buy
431
750
74.0
15.4
1.6
8.8
17.9
11.8
14.9
Lupin
Buy
1,435
1,809
26.1
24.7
4.1
15.6
13.1
29.6
24.7
Sanofi India*
Accumulate
4,300
4,738
10.2
28.0
3.9
22.3
34.2
21.0
25.6
Sun Pharma
Buy
739
950
28.6
26.4
5.4
17.9
10.5
17.7
18.7
Source: Company, Angel Research; Note: * December year ending
Company background
Sun Pharma is an international specialty pharma company, with a large presence
in the US and India, and a footprint across 40 other markets. In India and rest of
the world markets, the key chronic therapy areas for the company are cardiology,
psychiatry, neurology, gastroenterology, diabetology etc. The company is a market
leader in specialty therapy areas in India. In India, the company has emerged as a
leading pharma company where it is the third largest player. Also, in the US, a key
geography, the company has expanded significantly through both in-organic and
organic routes.
June 10, 2016
6
Sun Pharma | 4QFY2016 Result Update
Profit & Loss statement (Consolidated)
Y/E March (` cr)
FY2014
FY2015
FY2016
FY2017E
FY2018E
Gross sales
16,200
27,652
28,110
31,412
35,578
Less: Excise duty
195
366
366
283
320
Net sales
16,004
27,287
27,744
31,129
35,258
Other operating income
76
147
526
526
526
Total operating income
16,080
27,433
28,270
31,655
35,784
% chg
42.3
70.6
3.0
12.0
13.0
Total expenditure
9,081
19,470
20,473
21,799
24,348
Net raw materials
2,779
6,739
6,483
7,274
8,239
Other mfg costs
699
1,192
1,212
1,360
1,540
Personnel
2,074
4,430
4,797
5,382
6,459
Other
3,528
7,109
7,981
7,782
8,109
EBITDA
6,923
7,817
7,271
9,330
10,910
% chg
41.1
12.9
(7.0)
(23.2)
(19.3)
(% of Net Sales)
43.3
28.6
26.2
30.0
30.9
Depreciation & amort.
409
1,195
1,014
1,214
1,414
EBIT
6,514
6,622
6,783
8,642
10,022
% chg
42.5
1.7
2.4
-20.7
16.0
(% of Net Sales)
40.7
24.3
24.4
27.8
28.4
Interest & other charges
44
579
477
477
477
Other income
552
451
1,050
1,050
1,050
(% of PBT)
7.8
6.8
14.3
11.4
9.9
Share in profit of Asso.
-
-
-
-
-
Recurring PBT
7,098
6,641
7,356
9,215
10,595
% chg
44.9
(6.4)
10.8
(15.6)
0.0
Extraordinary expense/(inc.)
2,517
237.8
590.5
-
-
PBT (reported)
7,098
6,641
6,765
9,231
10,595
Tax
702.2
914.7
934.9
1,384.6
1,589.3
(% of PBT)
9.9
13.8
13.8
15.0
15.0
PAT (reported)
6,396
5,726
5,830
7,846
9,006
Add: Share of earnings of asso.
(13)
(2)
-
-
Less: Minority interest (MI)
738
936
1,111
1,111
1,111
Prior period items
-
-
-
PAT after MI (reported)
3,141
4,539
4,716
6,735
7,895
ADJ. PAT
5,273
4,743
5,306
6,735
7,895
% chg
52.6
(10.0)
11.9
(12.6)
17.2
(% of Net Sales)
19.6
16.6
0.0
1.0
2.0
Basic EPS (`)
25.5
22.9
22.0
28.0
32.8
Fully Diluted EPS (`)
25.5
22.9
22.0
28.0
32.8
% chg
52.6
(10.0)
(3.7)
(24.8)
17.2
June 10, 2016
7
Sun Pharma | 4QFY2016 Result Update
Balance Sheet (Consolidated)
Y/E March (` cr)
FY2014
FY2015
FY2016
FY2017E
FY2018E
SOURCES OF FUNDS
Equity share capital
207
207
241
241
241
Preference capital
Reserves & surplus
18,318
26,300
31,164
37,617
45,231
Shareholders’ funds
18,525
26,507
31,404
37,858
45,472
Minority interest
1,921
2,851
4,085
5,196
6,307
Total loans
2,561
7,596
8,338
8,338
8,338
Deferred tax liability
(911)
(1,752)
(2,126)
(2,126)
(2,126)
Other Long Term Liabilities
9
9
10
10
11
Long Term Provisions
2,602
2,710
2,293
2,287
2,554
Total liabilities
24,707
37,922
44,005
51,563
60,556
APPLICATION OF FUNDS
Gross block
6,389
15,041
18,621
19,621
20,621
Less: Acc. depreciation
3,668
4,863
6,102
7,315
8,729
Net block
2,721
10,179
12,519
12,306
11,892
Capital work-in-progress
842
842
842
303
1,144
Goodwill
4,097
3,701
4,181
4,181
4,181
Investments
2,786
2,716
1,309
1,551
1,388
Long term long & adv.
1,051
2,736
3,032
3,402
3,854
Current assets
16,688
27,005
30,149
38,366
47,641
Cash
7,590
10,998
13,989
20,005
27,173
Loans & advances
3,774
2,193
2,006
2,480
2,481
Other
3,816
13,813
14,154
15,881
17,987
Current liabilities
3,477
9,256
8,026
8,546
9,545
Net current assets
13,211
17,748
22,123
29,820
38,096
Others
-
-
-
-
-
Total assets
24,707
37,922
44,006
51,563
60,556
June 10, 2016
8
Sun Pharma | 4QFY2016 Result Update
Cash Flow Statement (Consolidated)
Y/E March (` cr)
FY2014
FY2015
FY2016
FY2017E
FY2018E
Profit before tax
7,098
6,641
7,356
9,215
10,595
Depreciation
409
1,195
1,014
1,214
1,414
(Inc)/Dec in working capital
(1,782)
(4,322)
(1,680)
(4,815)
(14,776)
Direct taxes paid
702
915
935
1,385
1,589
Cash Flow from Operations
5,024
2,598
5,754
4,229
(4,357)
(Inc.)/Dec.in Fixed Assets
681
(8,653)
(3,580)
(3,141)
(1,842)
(Inc.)/Dec. in Investments
(374)
70
1,408
1,165
163
Other income
-
-
-
-
-
Cash Flow from Investing
306
(8,583)
(2,172)
(1,975)
(1,679)
Issue of Equity
-
-
-
-
-
Inc./(Dec.) in loans
(548)
(4,928)
(1,157)
(1,165)
268
Dividend Paid (Incl. Tax)
(606)
-
(282)
(282)
(282)
Others
(645)
14,320
847
(1,404)
13,217
Cash Flow from Financing
(1,799)
9,392
(592)
(2,850)
13,204
Inc./(Dec.) in Cash
3,531
3,408
2,991
(596)
7,168
Opening Cash balances
4,059
7,590
10,998
20,601
20,005
Closing Cash balances
7,590
10,998
13,989
20,005
27,173
June 10, 2016
9
Sun Pharma | 4QFY2016 Result Update
Key Ratios
Y/E March
FY2014
FY2015
FY2016
FY2017E
FY2018E
Valuation Ratio (x)
P/E (on FDEPS)
29.0
32.3
33.5
26.4
22.5
P/CEPS
43.1
26.7
31.0
22.4
19.1
P/BV
8.3
6.7
4.9
4.0
3.4
Dividend yield (%)
0.3
0.4
0.1
0.1
0.1
EV/Sales
9.2
5.5
6.2
5.4
4.5
EV/EBITDA
21.4
19.1
23.8
17.9
14.7
EV / Total Assets
6.0
3.9
3.9
3.2
2.6
Per Share Data (`)
EPS (Basic)
25.5
22.9
22.0
28.0
32.8
EPS (fully diluted)
25.5
22.9
22.0
28.0
32.8
Cash EPS
17.1
27.7
23.8
33.0
38.7
DPS
2.5
3.0
1.0
1.0
1.0
Book Value
89.4
110.2
151.6
182.8
219.5
Dupont Analysis
EBIT margin
40.7
24.3
24.4
27.8
28.4
Tax retention ratio
90.1
86.2
86.2
85.0
85.0
Asset turnover (x)
1.1
1.2
1.0
1.1
1.1
ROIC (Post-tax)
40.5
26.1
20.9
26.2
26.6
Cost of Debt (Post Tax)
2.9
9.8
5.2
5.1
9.7
Leverage (x)
0.0
0.0
0.0
0.0
0.0
Operating ROE
40.5
26.1
20.9
26.2
26.6
Returns (%)
ROCE (Pre-tax)
32.0
21.1
16.6
17.7
33.1
Angel ROIC (Pre-tax)
57.4
38.3
28.6
36.0
71.4
ROE
32.3
21.1
18.3
18.7
18.9
Turnover ratios (x)
Asset Turnover (Gross Block)
2.3
2.6
1.7
1.8
3.5
Inventory / Sales (days)
98
58
78
88
97
Receivables (days)
80
50
77
88
97
Payables (days)
49
61
94
72
72
WC cycle (ex-cash) (days)
91
82
96
91
56
Solvency ratios (x)
Net debt to equity
(0.3)
(0.1)
(0.2)
(0.3)
(0.4)
Net debt to EBITDA
(0.7)
(0.4)
(0.8)
(1.3)
(1.7)
Interest Coverage (EBIT/Int.)
-
-
-
-
-
June 10, 2016
10
Sun Pharma | 4QFY2016 Result Update
Research Team Tel: 022 - 39357800
DISCLAIMER
Angel Broking Private Limited (hereinafter referred to as “Angel”) is a registered Member of National Stock Exchange of India Limited,
Bombay Stock Exchange Limited and Metropolitan Stock Exchange of India Limited. It is also registered as a Depository Participant with
CDSL and Portfolio Manager with SEBI. It also has registration with AMFI as a Mutual Fund Distributor. Angel Broking Private Limited is
a registered entity with SEBI for Research Analyst in terms of SEBI (Research Analyst) Regulations, 2014 vide registration number
INH000000164. Angel or its associates has not been debarred/ suspended by SEBI or any other regulatory authority for accessing
/dealing in securities Market. Angel or its associates including its relatives/analyst do not hold any financial interest/beneficial
ownership of more than 1% in the company covered by Analyst. Angel or its associates/analyst has not received any compensation /
managed or co-managed public offering of securities of the company covered by Analyst during the past twelve months. Angel/analyst
has not served as an officer, director or employee of company covered by Analyst and has not been engaged in market making activity
of the company covered by Analyst.
This document is solely for the personal information of the recipient, and must not be singularly used as the basis of any investment
decision. Nothing in this document should be construed as investment or financial advice. Each recipient of this document should
make such investigations as they deem necessary to arrive at an independent evaluation of an investment in the securities of the
companies referred to in this document (including the merits and risks involved), and should consult their own advisors to determine
the merits and risks of such an investment.
Reports based on technical and derivative analysis center on studying charts of a stock's price movement, outstanding positions and
trading volume, as opposed to focusing on a company's fundamentals and, as such, may not match with a report on a company's
fundamentals.
The information in this document has been printed on the basis of publicly available information, internal data and other reliable
sources believed to be true, but we do not represent that it is accurate or complete and it should not be relied on as such, as this
document is for general guidance only. Angel Broking Pvt. Limited or any of its affiliates/ group companies shall not be in any way
responsible for any loss or damage that may arise to any person from any inadvertent error in the information contained in this report.
Angel Broking Pvt. Limited has not independently verified all the information contained within this document. Accordingly, we cannot
testify, nor make any representation or warranty, express or implied, to the accuracy, contents or data contained within this document.
While Angel Broking Pvt. Limited endeavors to update on a reasonable basis the information discussed in this material, there may be
regulatory, compliance, or other reasons that prevent us from doing so.
This document is being supplied to you solely for your information, and its contents, information or data may not be reproduced,
redistributed or passed on, directly or indirectly.
Neither Angel Broking Pvt. Limited, nor its directors, employees or affiliates shall be liable for any loss or damage that may arise from
or in connection with the use of this information.
Note: Please refer to the important ‘Stock Holding Disclosure' report on the Angel website (Research Section). Also, please refer to the
latest update on respective stocks for the disclosure status in respect of those stocks. Angel Broking Pvt. Limited and its affiliates may
have investment positions in the stocks recommended in this report.
Disclosure of Interest Statement
Sun Pharma
1. Analyst ownership of the stock
No
2. Angel and its Group companies ownership of the stock
No
3. Angel and its Group companies' Directors ownership of the stock
No
4. Broking relationship with company covered
No
Note: We have not considered any Exposure below ` 1 lakh for Angel, its Group companies and Directors
Ratings (Based on expected returns
Buy (> 15%)
Accumulate (5% to 15%)
Neutral (-5 to 5%)
over 12 months investment period):
Reduce (-5% to -15%)
Sell (< -15)
June 10, 2016
11