3QFY2016 Result Update | Banking
January 28, 2016
South Indian Bank
NEUTRAL
CMP
`19
Performance Highlights
Target Price
-
Particulars (` cr)
3QFY16 2QFY16
% chg (qoq) 3QFY15
% chg (yoy)
Investment Period
-
NII
407
388
4.7
320
27.1
Pre-prov. profit
263
213
23.5
219
19.9
Stock Info
PAT
102
93
8.8
88
15.6
Sector
Banking
Source: Company, Angel Research
Market Cap (` cr)
2,484
South Indian Bank (SIB) reported a moderate set of numbers for 3QFY2016. Its
Beta
1.0
net profit rose by 15.6% to `101.6cr, helped by strong NII growth of 27.1% yoy,
52 Week High / Low
28.7/17.5
Avg. Daily Volume
46,08,819
thereby partially offsetting the impact of rise in provisions. However, the asset
Face Value (`)
1
quality continued to slide further with slippages increasing to 3.93% and with
BSE Sensex
24,436
Gross and Net NPA ratios too rising sharply for the quarter.
Nifty
7,422
Moderate growth in Advances: The bank’s advances and deposits grew at a
Reuters Code
SIBK.NS
moderate pace of 9.7% and 10.3% yoy respectively, during the quarter. The bank is
Bloomberg Code
SIB:IN
shifting its focus to retail, SME and agriculture loans. During the quarter, retail advances
continued to dip; they declined by 4.6% yoy as gold loans continue its downward trend.
Shareholding Pattern (%)
Promoters
NA
CASA ratio and NIM improve: CASA deposits grew by 18.1% yoy and the CASA
MF / Banks / Indian Fls
12.6
ratio improved to 23.0%, during the quarter. The Reported NIM for the quarter
FII / NRIs / OCBs
47.2
increased by 11bp qoq to 2.92% while it increased by 42bp yoy. The bank
Indian Public / Others
40.3
reiterated its NIM guidance in the range of 2.75-2.80% for FY2016. Other
income excluding treasury climbed 26.1% yoy to `103cr, while treasury gains
Abs. (%)
3m 1yr
3yr
declined by 36% on a yoy basis. The cost-to-income ratio for the quarter was at
Sensex
(11.0)
(15.8)
22.3
53.0% and the Management expects to improvise on the same, going forward.
SIB
(16.2)
(33.9)
(34.6)
Asset quality slipped further: On the asset quality front, the GNPA ratio increased
by 51bp qoq to 2.75%, while the NNPA ratio came in at 1.80% as compared to
3-year price chart
1.39% in 2QFY2016. SIB has been reporting high slippages from the corporate
40
book since the last few quarters. Slippages for 3QFY2016 were at `367cr which
35
is essentially because of some trading accounts including gold and also some
30
25
contracting accounts. The bank has expressed that it has zero divergence with the
20
regulator and it has completely reckoned and provided for fully as per the
15
guidelines. The bank did not participate in 5/25 refinancing in 3QFY2016, but
10
5
has 1 account under SDR of ~`150cr.
0
Outlook and valuation: Issues pertaining to asset quality continue to be a key
concern for the bank. Going forward, asset quality pressures could be detrimental to
Source: Company, Angel Research
the bank’s growth. Given the current macro environment, we recommend a Neutral
rating on the stock. At the current market price, the stock trades at 0.7x FY2017E ABV.
Key financials (standalone)
Particulars (` cr)
FY2014
FY2015
FY2016E
FY2017E
NII
1,399
1,366
1,483
1,660
% chg
9.2
(2.3)
8.6
11.9
Net profit
508
307
342
454
Vaibhav Agrawal
% chg
1.0
(39.5)
11.4
32.6
022 - 3935 7800 Ext: 6808
NIM (%)
2.7
2.5
2.5
2.5
EPS (`)
3.8
2.2
2.5
3.3
P/E (x)
4.8
8.1
7.3
5.5
P/ABV (x)
0.8
0.8
0.7
0.7
Chintan Shah
RoA (%)
1.0
0.5
0.6
0.7
022 - 4000 3600 Ext: 6828
RoE (%)
16.6
9.2
9.5
11.6
Source: Company, Angel Research; Note: CMP as of January 27, 2016
Please refer to important disclosures at the end of this report
1
South Indian Bank | 3QFY2016 Result Update
Exhibit 1: 3QFY2016 performance (standalone)
Particulars
3QFY16
2QFY16
% chg (qoq)
3QFY15
% chg (yoy)
FY2015
FY2014
% chg
Interest earned
1,408
1,405
0.2
1,307
7.7
5,286
5,015
5.4
- on Advances / Bills
1,114
1,108
0.6
1,033
7.9
4,153
3,950
5.1
- on investments
250
249
0.4
259
(3.4)
1,054
954
10.4
- on balance with RBI & others
3
6
(49.8)
15
(79.2)
80
111
(28.3)
Interest Expended
1,001
1,017
(1.5)
987
1.4
3,920
3,616
8.4
Net Interest Income
407
388
4.7
320
27.1
1,366
1,399
(2.3)
Other income
153
121
26.5
160
(4.4)
497
368
34.9
Other income excl. treasury
103
79
30.4
82
26.1
465
299
55.8
- Treasury Income
50
42
19.0
78
(36.2)
32
70
(54.7)
Operating income
560
510
9.9
480
16.6
1,863
1,767
5.4
Operating expenses
297
297
0.1
261
13.9
1,047
883
18.6
- Employee expenses
185
179
3.3
155
19.0
634
529
19.8
- Other Opex
112
118
(4.6)
106
6.2
413
354
16.8
Pre-provision Profit
263
213
23.5
219
19.9
816
884
(7.7)
Provisions & Contingencies
106
67
57.7
86
23.8
371
155
138.5
- Provisions for NPAs
84
89
(5.9)
51
63.3
219
110
98.8
- Provisions for Investments
12
(3)
(478.0)
(3)
(452.9)
14
(29)
(148.1)
- Provisions for Standard Assets
11
16
(33.4)
4
194.0
36
45
(19.4)
- Other Provisions
(1)
(35)
(98.5)
34
(101.5)
102
29
250.4
PBT
157
146
7.6
133
17.4
446
729
(38.9)
Provision for Tax
55
52
5.5
46
20.9
138
221
(37.5)
PAT
102
93
8.8
88
15.6
307
508
(39.5)
Effective Tax Rate (%)
35.1
35.8
(71)bp
34.1
103bp
31.1
30.4
68bp
Source: Company, Angel Research
January 28, 2016
2
South Indian Bank | 3QFY2016 Result Update
Exhibit 2: 3QFY2016 performance analysis (standalone)
Particulars
3QFY16
2QFY16
% chg (qoq) 3QFY15
% chg (yoy)
Balance sheet
Advances (` cr)
39,909
39,556
0.9
36,394
9.7
Deposits (` cr)
53,441
53,036
0.8
48,459
10.3
Credit-to-Deposit Ratio (%)
74.7
74.6
10bp
75.1
(42)bp
Current deposits (` cr)
2,130
2,157
(1.3)
1,826
16.6
Saving deposits (` cr)
10,177
9,915
2.6
8,598
18.4
CASA deposits (` cr)
12,307
12,072
1.9
10,424
18.1
CASA ratio (%)
23.0
22.8
27bp
21.5
152bp
CAR (%)
11.7
11.9
(20)bp
11.4
32bp
Tier 1 CAR (%)
9.4
9.6
(20)bp
10.0
(61)bp
Profitability Ratios (%)
Cost of deposits
7.38
7.53
(15)bp
8.0
(62)bp
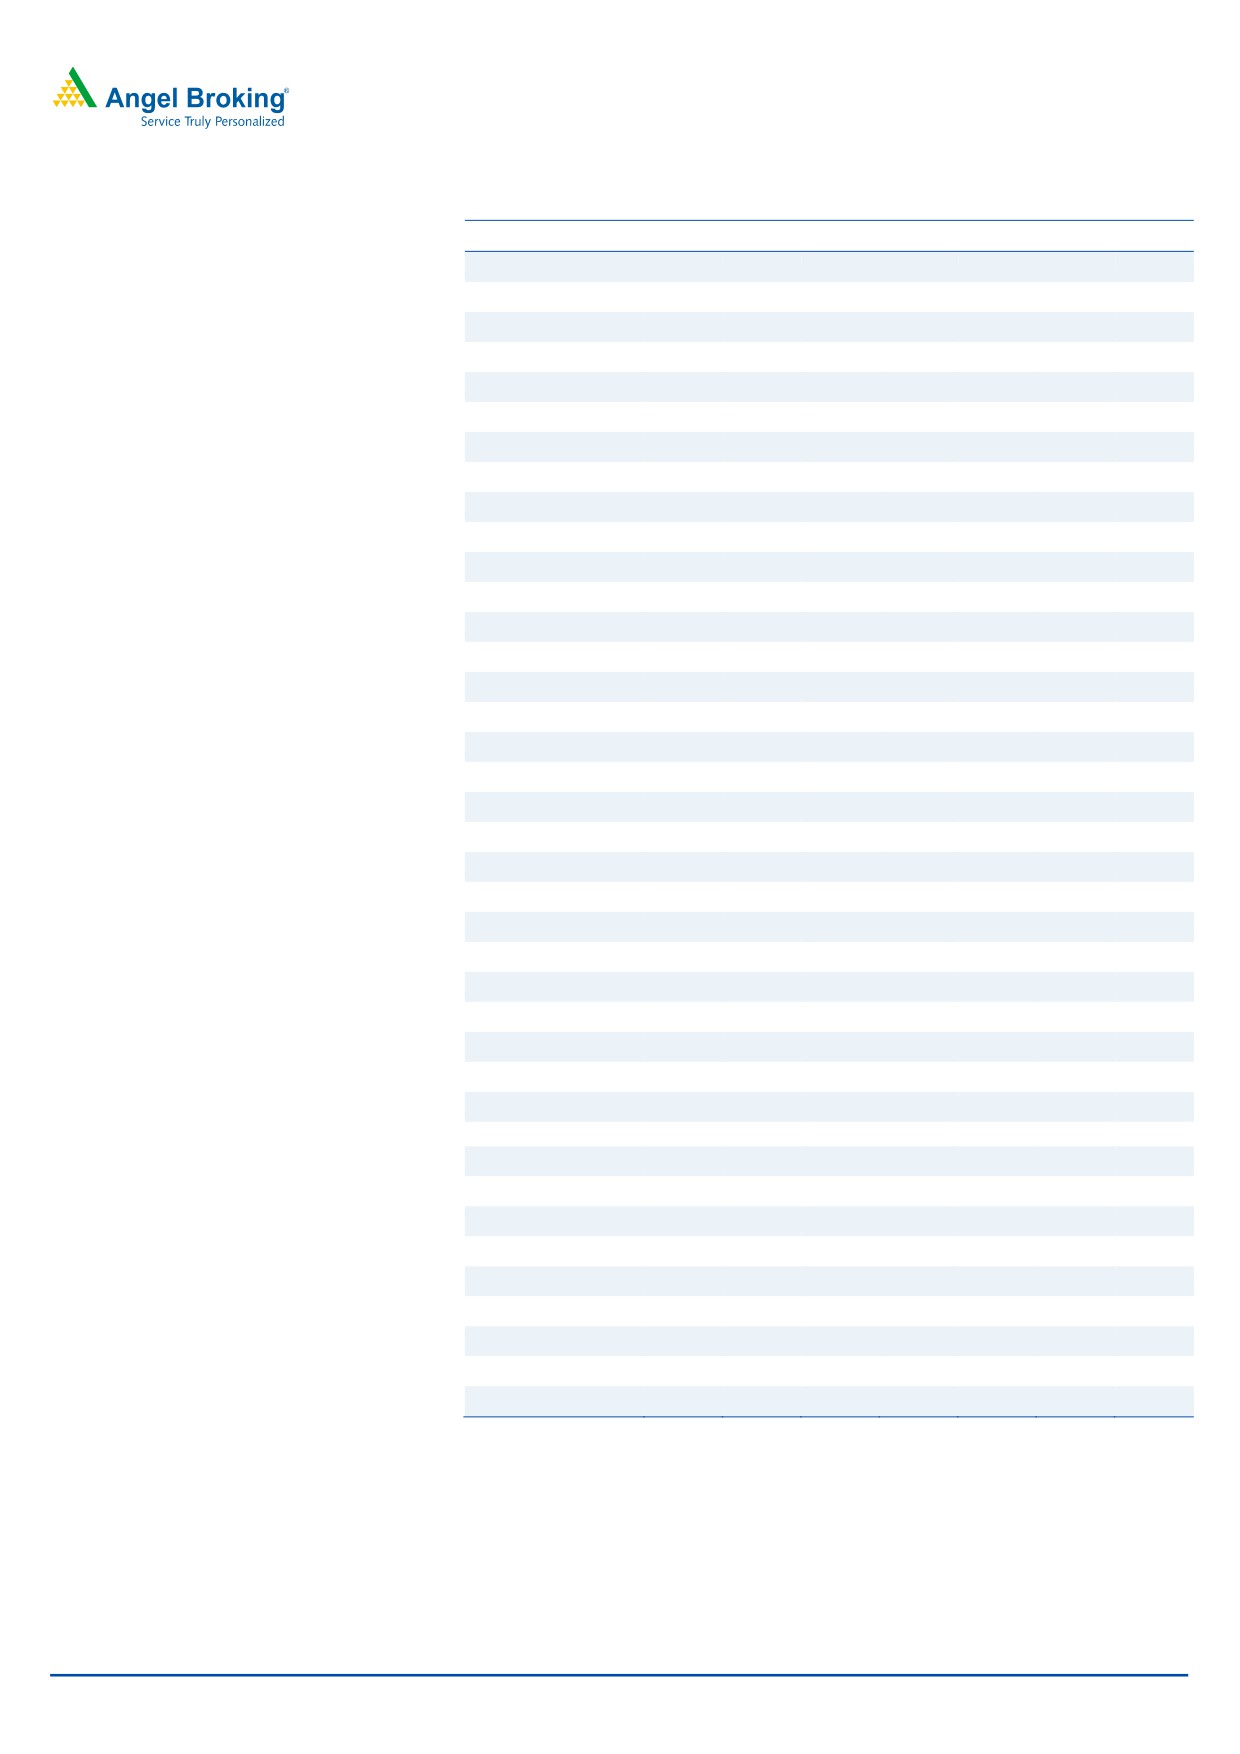
Yield on advances
11.21
11.38
(17)bp
11.5
(25)bp
Reported NIM
2.92
2.81
11bp
2.5
42bp
Cost-to-income ratio
53.0
58.2
(517)bp
54.3
(128)bp
Asset quality
Gross NPAs (` cr)
1,108
892
24.2
661
67.6
Gross NPAs (%)
2.75
2.24
51bp
1.8
95bp
Net NPAs (` cr)
716
550
30.3
380
88.6
Net NPAs (%)
1.80
1.39
41bp
1.0
76bp
Provision Coverage Ratio (%)
50.3
55.3
(501)bp
60.4
(1012)bp
Slippage ratio (%)
3.9
2.4
155bp
1.8
212bp
Loan loss prov. to avg assets (%)
0.6
0.6
(5)bp
0.4
19bp
Source: Company, Angel Research
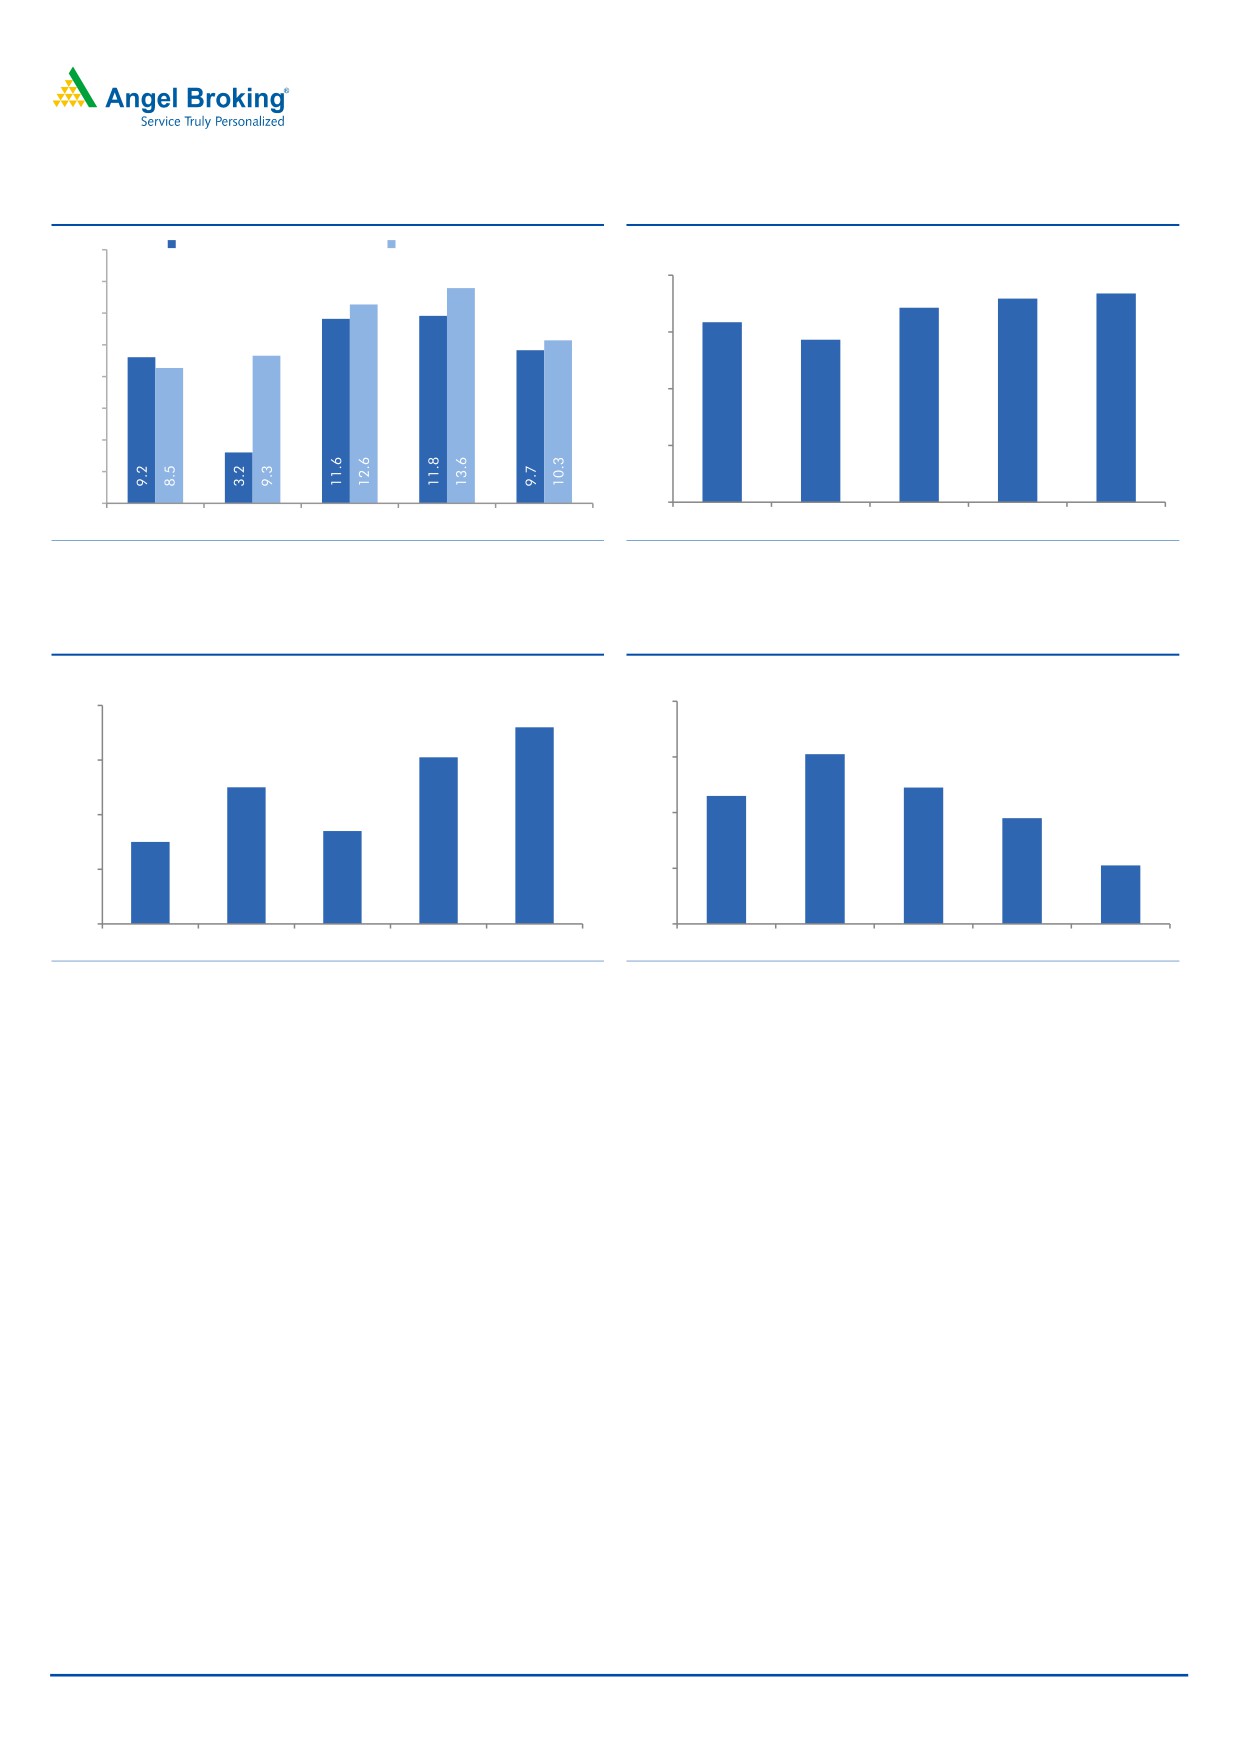
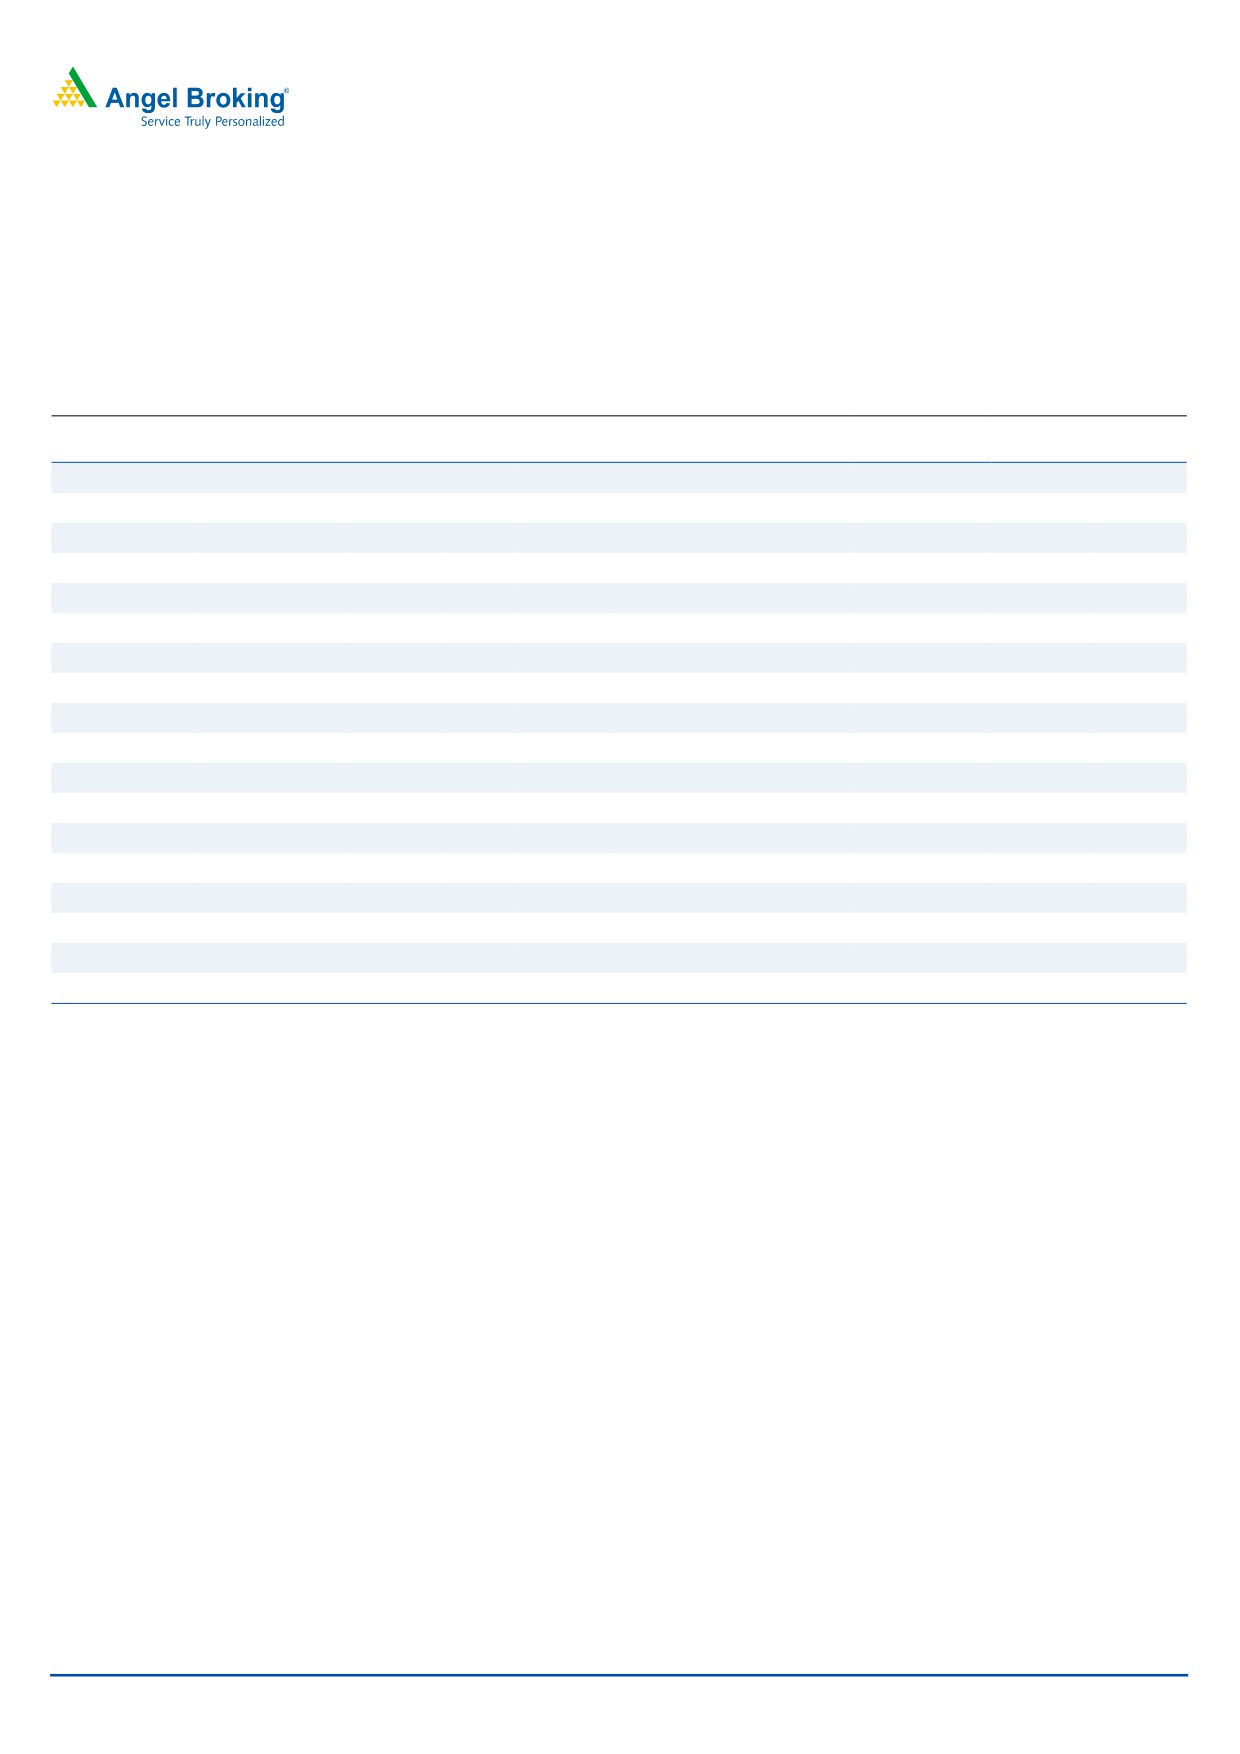
Moderate growth in Advances
The bank’s advances and deposits grew at a moderate pace of
9.7% and
10.3% yoy respectively, during the quarter. Within advances, the SME+Agri loan
book grew at a healthy pace, ie of 20.8% yoy, while the corporate book grew by
10.2% yoy. The bank is shifting its focus to retail, SME and agriculture loans.
During the quarter, retail advances continued to dip; they declined by 4.6% yoy as
gold loans continue its downward trend. The cost-to-income ratio for the quarter
was at 53.0% and the Management expects to improvise on the same, going
forward.
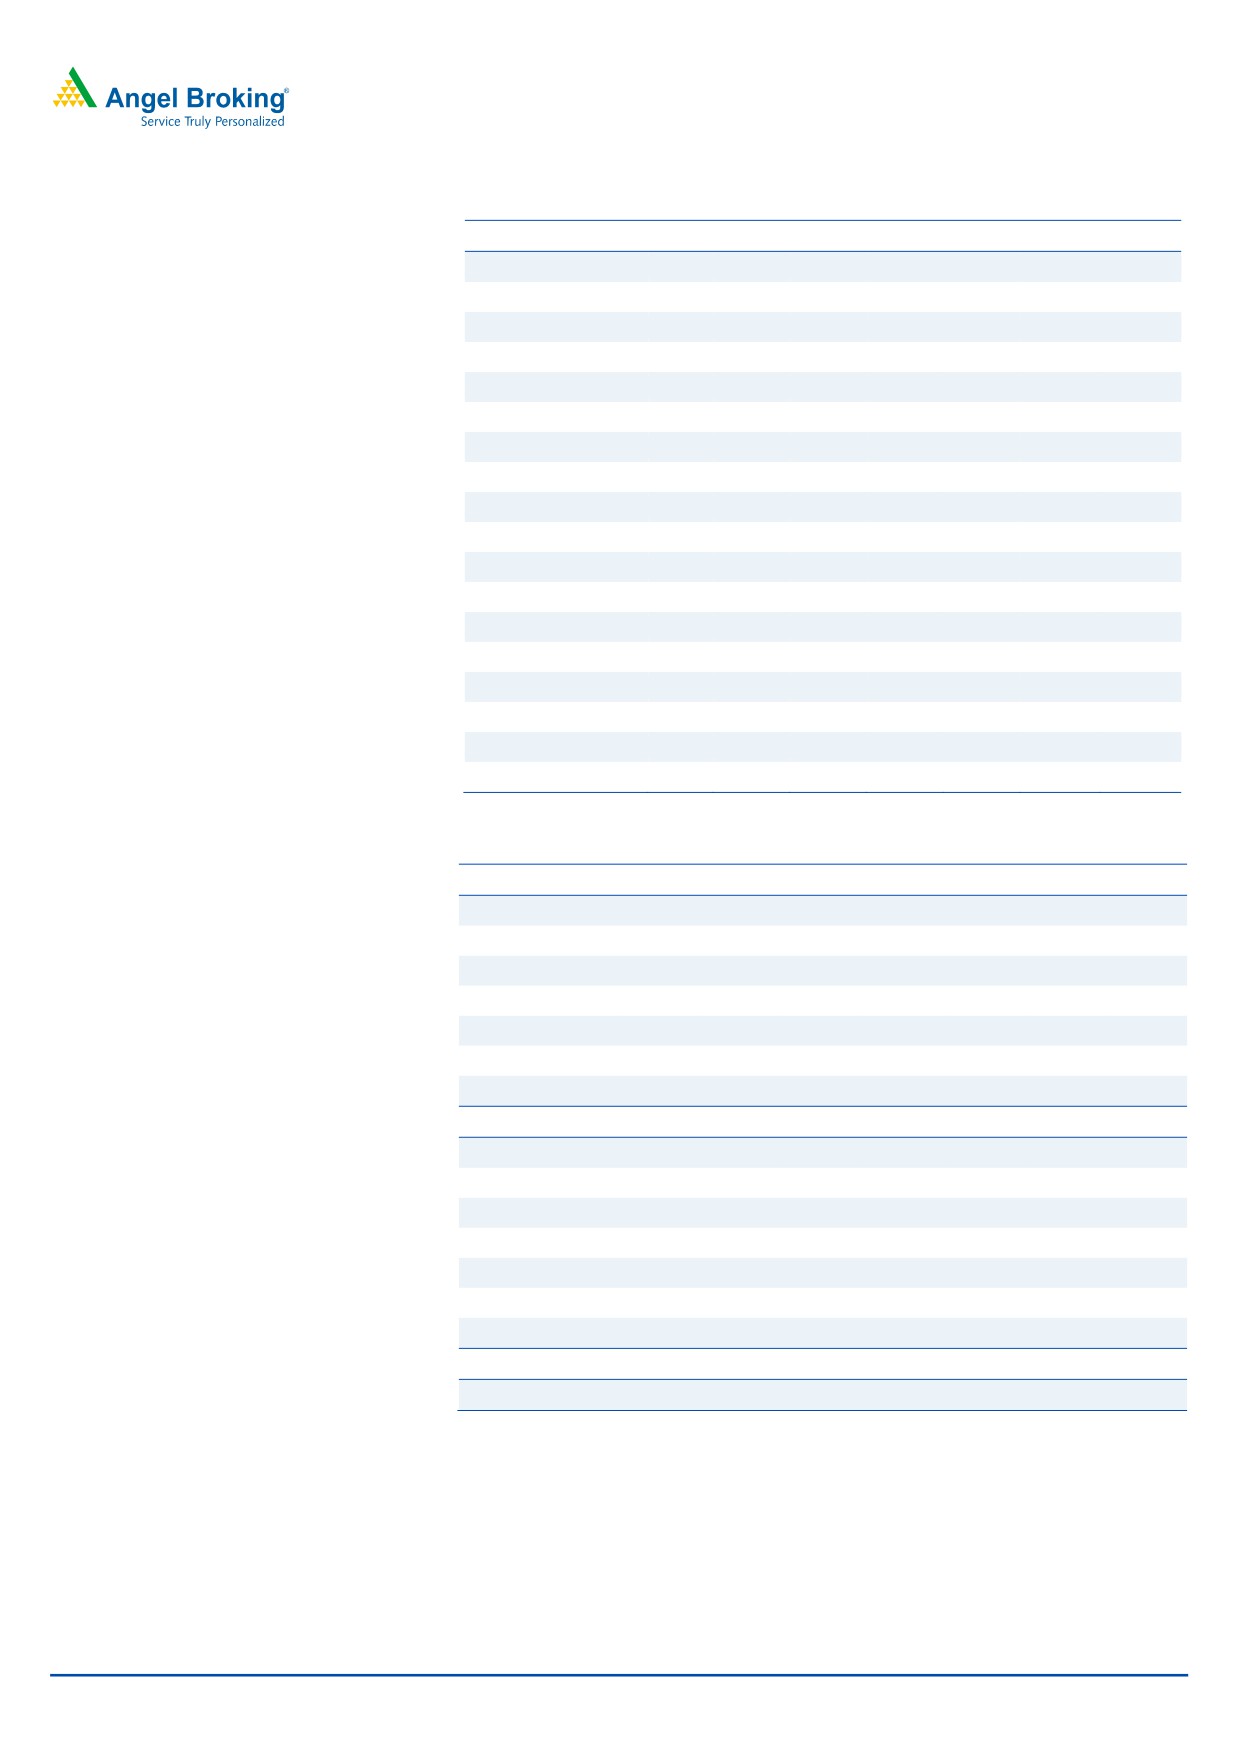
CASA deposits grew by 18.1% yoy and the CASA ratio improved to 23.0%, during
the quarter. The Reported NIM for the quarter increased by 11bp qoq to 2.92%
while it increased by 42bp yoy. The bank reiterated its NIM guidance in the range
of 2.75-2.80% for FY2016.
January 28, 2016
3
South Indian Bank | 3QFY2016 Result Update
Exhibit 3: Steady business growth
Exhibit 4: CASA ratio improves qoq
Advances yoy growth (%,)
Deposits yoy growth (%)
16.0
(%)
24
23.03
14.0
22.76
22.28
21.51
12.0
20.59
21
10.0
8.0
18
6.0
4.0
15
2.0
-
12
3QFY15
4QFY15
1QFY16
2QFY16
3QFY16
3QFY15
4QFY15
1QFY16
2QFY16
3QFY16
Source: Company, Angel Research
Source: Company, Angel Research; Note : Excluding FCNR, RFC
Exhibit 5: NIM rises qoq
Exhibit 6: Yield on advances dips sequentially
(%)
(%)
3.00
11.8
2.92
2.81
11.61
2.80
11.6
2.70
11.49
11.46
11.38
2.60
2.54
11.4
2.50
11.21
2.40
11.2
2.20
11
3QFY15
4QFY15
1QFY16
2QFY16
3QFY16
3QFY15
4QFY15
1QFY16
2QFY16
3QFY16
Source: Company, Angel Research; Note: *cumulative
Source: Company, Angel Research
Healthy growth in non-interest income (excluding treasury)
With regards to other income, all components except for fee income (other than
the sale of investment) improved and the company expects the same trend to
continue. Other income excluding treasury climbed 26.1% yoy to `103cr, while
treasury gains declined by 36% on a yoy basis. Total other income however saw a
decline of 4.4% yoy.
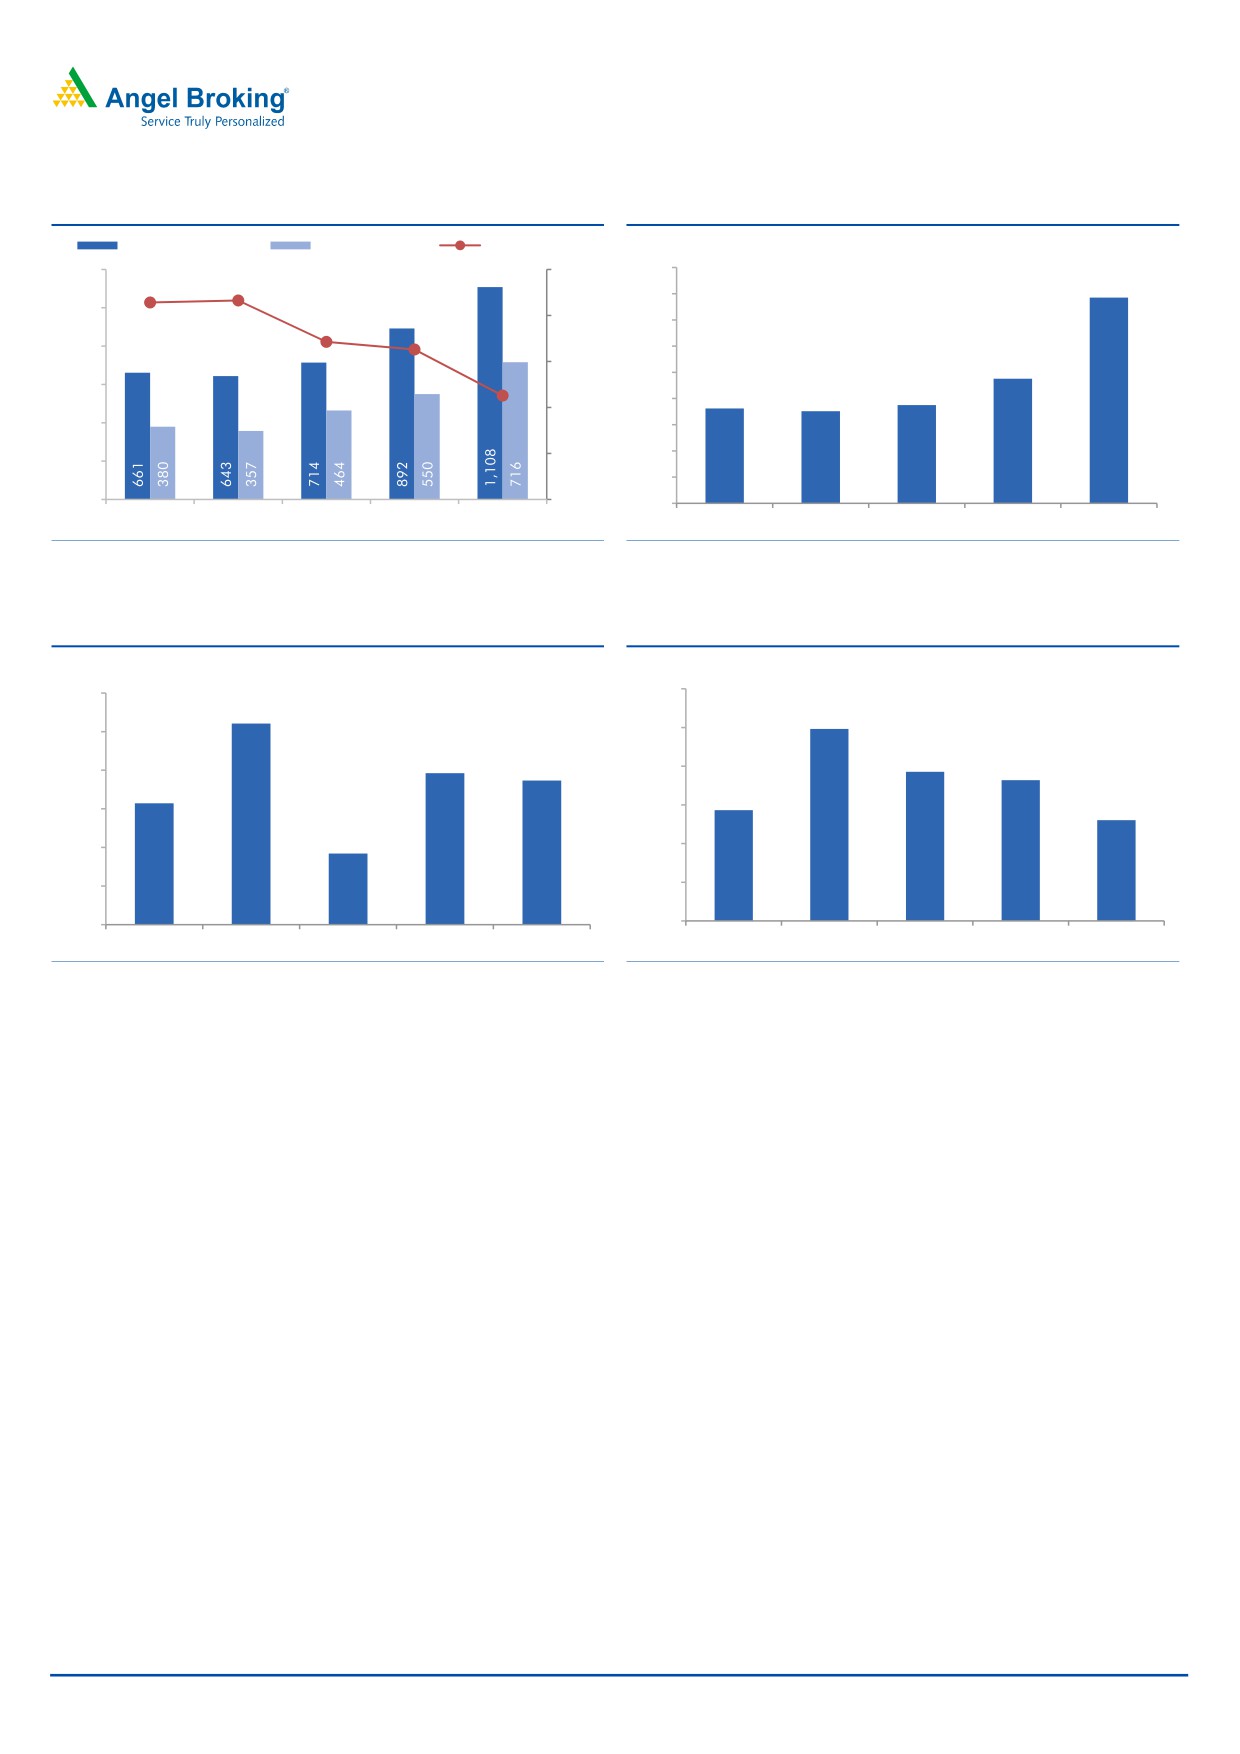
Asset quality slips further
On the asset quality front, the GNPA ratio increased by 51bp qoq to 2.75%, while
the NNPA ratio came in at 1.80% as compared to 1.39% in 2QFY2016. SIB has
been reporting high slippages from the corporate book since the last few quarters.
Slippages for 3QFY2016 were at `367cr which is essentially because of some
trading accounts including gold and also some contracting accounts. The bank has
expressed that it has zero divergence with the regulator and it has completely
reckoned and provided for fully as per the guidelines of the regulator. The bank
did not participate in 5/25 refinancing in 3QFY2016, but has 1 account under
SDR of ~`150cr. The total outstanding standard restructured book as at the end of
the quarter stood at `1,930cr.
January 28, 2016
4
South Indian Bank | 3QFY2016 Result Update
Exhibit 7: Asset quality deteriorates
Exhibit 8: Slippage ratio increases
Gross NPAs (` cr)
Net NPA (` cr)
PCR (%, RHS)
(%)
Slippage ratio (%)
1200
60.4
64.0
4.5
60.6
3.9
4.0
1000
59.0
3.5
56.1
55.3
800
3.0
54.0
2.4
2.5
600
50.3
1.9
1.8
1.8
2.0
49.0
400
1.5
44.0
1.0
200
0.5
0
39.0
-
3QFY15
4QFY15
1QFY16
2QFY16
3QFY16
3QFY15
4QFY15
1QFY16
2QFY16
3QFY16
Source: Company, Angel Research
Source: Company, Angel Research
Exhibit 9: Opex. to average assets trend
Exhibit 10: Cost to income ratio
(%)
(%)
2.2
70.0
2.1
64.8
2.1
65.0
2.0
59.3
2.0
60.0
58.2
2.0
1.9
54.3
55.0
53.0
1.9
1.8
1.8
50.0
1.7
45.0
1.6
40.0
3QFY15
4QFY15
1QFY16
2QFY16
3QFY16
3QFY15
4QFY15
1QFY16
2QFY16
3QFY16
Source: Company, Angel Research
Source: Company, Angel Research
January 28, 2016
5
South Indian Bank | 3QFY2016 Result Update
Outlook and valuation
Issues pertaining to asset quality continue to be a key concern for the bank. Going
forward, asset quality pressures could be detrimental to the bank’s growth. Given
the current macro environment, we recommend a Neutral rating on the stock. At
the current market price, the stock trades at 0.7x FY2017E ABV.
Exhibit 11: Recommendation summary
CMP
Tgt. Price
Upside
FY2017E
FY2017E
FY2017E
FY15-17E
FY2017E
FY2017E
Company
Reco.
(`)
(`)
(%)
P/ABV (x)
Tgt. P/ABV (x)
P/E (x)
EPS CAGR (%)
RoA (%)
RoE (%)
HDFCBk
Buy
1,036
1,262
21.8
3.1
3.8
17.0
22.4
1.9
19.7
ICICIBk*
Buy
237
304
28.3
1.6
1.7
9.7
13.4
1.6
14.7
YesBk
Buy
677
825
21.8
1.8
2.2
9.7
20.5
1.6
19.6
AxisBk
Buy
415
531
27.9
1.7
2.2
9.5
18.4
1.8
18.9
SBI*
Buy
184
237
28.4
0.9
1.0
7.5
17.8
0.7
12.7
FedBk
Neutral
47
-
-
0.9
0.9
8.6
(2.9)
0.9
10.8
SIB
Neutral
19
-
-
0.7
0.7
5.6
21.6
0.7
11.6
BOB
Neutral
130
-
-
0.7
0.7
6.2
17.5
0.6
10.6
PNB
Neutral
94
-
-
0.4
0.4
3.4
28.5
0.7
12.0
BOI
Neutral
100
-
-
0.3
0.7
3.0
14.0
0.3
7.6
IndBk
Neutral
93
-
-
0.3
0.3
3.1
19.4
0.6
8.6
Vijaya Bank
Neutral
31
-
-
0.4
0.4
4.7
14.1
0.4
8.8
OBC
Neutral
114
-
-
0.2
0.3
2.5
65.5
0.5
9.4
Allahabad Bank Neutral
55
-
-
0.2
0.2
2.0
56.2
0.6
11.9
UnionBk
Neutral
130
-
-
0.4
0.3
3.3
18.1
0.6
11.4
CanBk
Neutral
190
-
-
0.3
0.2
2.7
12.0
0.6
11.2
IDBI#
Neutral
59
-
-
0.4
0.5
4.2
61.6
0.6
9.3
DenaBk
Neutral
36
-
-
0.3
0.4
3.6
45.6
0.4
7.9
Source: Company, Angel Research; Note:*Target multiples=SOTP Target Price/ABV (including subsidiaries), #Without adjusting for SASF
Company Background
South Indian Bank (SIB) is a small old generation private sector bank with ~83% of
its branches in southern India (large base in Kerala and Tamil Nadu). Like Federal
Bank, SIB also has a large NRI customer base, accounting for ~28% of its total
deposits. The bank was aggressively focusing on the gold loans segment. However
the focus has now been shifted to retail loans (especially on housing and auto loan
segments) and on the SME loans segment.
January 28, 2016
6
South Indian Bank | 3QFY2016 Result Update
Income statement (standalone)
Y/E March (` cr)
FY11
FY12
FY13
FY14
FY15
FY16E
FY17E
Net Interest Income
791
1,022
1,281
1,399
1,366
1,483
1,660
- YoY Growth (%)
39.2
29.2
25.4
9.2
-2.3
8.6
11.9
Other Income
197
247
335
368
497
481
524
- YoY Growth (%)
(5.6)
25.6
35.5
10.0
34.9
(3.2)
8.9
Operating Income
988
1,269
1,616
1,767
1,863
1,965
2,185
- YoY Growth (%)
27.2
28.4
27.3
9.4
5.4
5.4
11.2
Operating Expenses
463
617
767
883
1,047
1,161
1,248
- YoY Growth (%)
26.3
33.5
24.3
15.1
18.6
10.9
7.5
Pre - Provision Profit
525
652
849
884
816
803
936
- YoY Growth (%)
27.9
24.0
30.2
4.2
-7.7
(1.6)
16.6
Prov. and Cont.
80
79
193
155
371
280
242
- YoY Growth (%)
84.4
(0.7)
143.3
(19.4)
138.5
(24.5)
(13.5)
Profit Before Tax
446
572
656
729
446
524
694
- YoY Growth (%)
21.3
28.5
14.6
11.1
-38.9
17.5
32.6
Prov. for Taxation
153
171
154
221
138
181
240
- as a % of PBT
34.3
29.8
23.4
30.4
31.1
34.6
34.6
PAT
293
402
502
508
307
342
454
- YoY Growth (%)
25.1
37.3
25.1
1.0
-39.5
11.4
32.6
Balance sheet (standalone)
Y/E March (` cr)
FY11
FY12
FY13
FY14
FY15
FY16E
FY17E
Share Capital
113
113
134
134
137
137
137
Reserve & Surplus
1,734
2,057
2,873
3,234
3,454
3,716
4,067
Deposits
29,721
36,501
44,262
47,491
51,913
56,066
61,672
- Growth (%)
29.2
22.8
21.3
7.3
9.3
8.0
10.0
Borrowings
25
323
1,020
2,531
2,038
2,198
2,418
Tier 2 Capital
265
265
265
200
195
190
185
Other Liab. & Prov.
962
1,111
1,242
1,394
1,380
1,475
1,682
Total Liabilities
32,820
40,370
49,795
54,984
59,116
63,783
70,162
Cash balances
1,828
1,572
1,697
2,201
2,442
2,803
3,084
Bank balances
638
1,069
2,639
1,017
1,154
1,245
1,369
Investments
8,924
9,400
12,524
14,352
16,717
17,081
17,966
Advances
20,489
27,281
31,816
36,230
37,392
41,131
46,066
- Growth (%)
29.5
33.1
16.6
13.9
3.2
10.0
12.0
Fixed Assets
357
378
396
412
479
517
569
Other Assets
585
671
724
772
933
1,007
1,108
Total Assets
32,820
40,370
49,795
54,984
59,116
63,783
70,162
- Growth (%)
28.5
23.0
23.3
10.4
7.5
7.9
10.0
January 28, 2016
7
South Indian Bank | 3QFY2016 Result Update
Ratio Analysis (standalone)
Y/E March
FY11
FY12
FY13
FY14
FY15
FY16E
FY17E
Profitability ratios (%)
NIMs
2.8
2.9
2.9
2.7
2.5
2.5
2.8
Cost to Income ratio
46.8
48.7
47.5
50.0
56.2
59.1
46.8
RoA
1.0
1.1
1.1
1.0
0.5
0.6
1.0
RoE
18.5
21.6
20.5
16.6
9.2
9.5
18.5
B/S ratios (%)
CASA ratio
21.5
19.7
18.6
20.7
20.8
21.6
21.5
Credit/Deposit ratio
68.9
74.7
71.9
76.3
72.0
73.4
68.9
Net worth/ Assets
18.4
19.7
18.4
17.2
17.0
17.1
18.4
CAR
14.0
14.0
11.5
12.4
12.2
12.1
14.0
- Tier I
11.3
11.5
9.9
10.8
10.7
10.6
11.3
Asset Quality (%)
Gross NPAs
1.1
1.0
1.4
1.2
1.7
2.3
1.1
Net NPAs
0.3
0.3
0.8
0.8
1.0
1.3
0.3
Slippages
0.7
0.8
1.9
2.0
2.1
2.3
0.7
NPA prov / avg. assets
0.1
0.1
0.3
0.3
0.3
0.3
0.1
Provision Coverage
73.9
71.4
56.7
56.5
56.6
54.9
73.9
Per Share Data (`)
EPS
2.6
3.5
3.8
3.8
2.2
2.5
2.6
ABVPS (75% cover)
15.0
17.8
20.4
22.8
23.7
25.1
15.0
DPS
0.5
0.6
0.7
0.8
0.5
0.5
0.5
Valuation Ratios
PER (x)
7.2
5.2
4.9
4.9
8.3
7.4
7.2
P/ABVPS (x)
1.2
1.0
0.9
0.8
0.8
0.7
1.2
Dividend Yield
2.7
3.2
3.8
4.3
2.9
2.7
2.7
DuPont Analysis
NII
2.7
2.8
2.8
2.7
2.4
2.4
2.7
(-) Prov. Exp.
0.3
0.2
0.4
0.3
0.6
0.5
0.3
Adj NII
2.4
2.6
2.4
2.4
1.7
2.0
2.4
Treasury
0.1
0.1
0.1
0.1
0.3
0.2
0.1
Int. Sens. Inc.
2.6
2.7
2.5
2.5
2.0
2.2
2.6
Other Inc.
0.5
0.6
0.6
0.6
0.6
0.6
0.5
Op. Inc.
3.1
3.3
3.2
3.1
2.6
2.7
3.1
Opex
1.6
1.7
1.7
1.7
1.8
1.9
1.6
PBT
1.5
1.6
1.5
1.4
0.8
0.9
1.5
Taxes
0.5
0.5
0.3
0.4
0.2
0.3
0.5
RoA
1.0
1.1
1.1
1.0
0.5
0.6
1.0
Leverage
18.4
19.7
18.4
17.2
17.0
17.1
18.4
RoE
18.5
21.6
20.5
16.6
9.2
9.5
18.5
January 28, 2016
8
South Indian Bank | 3QFY2016 Result Update
Research Team Tel: 022 - 39357800
DISCLAIMER
Angel Broking Private Limited (hereinafter referred to as “Angel”) is a registered Member of National Stock Exchange of India Limited,
Bombay Stock Exchange Limited and Metropolitan Stock Exchange of India Limited. It is also registered as a Depository Participant with
CDSL and Portfolio Manager with SEBI. It also has registration with AMFI as a Mutual Fund Distributor. Angel Broking Private Limited is
a registered entity with SEBI for Research Analyst in terms of SEBI (Research Analyst) Regulations, 2014 vide registration number
INH000000164. Angel or its associates has not been debarred/ suspended by SEBI or any other regulatory authority for accessing
/dealing in securities Market. Angel or its associates including its relatives/analyst do not hold any financial interest/beneficial
ownership of more than 1% in the company covered by Analyst. Angel or its associates/analyst has not received any compensation /
managed or co-managed public offering of securities of the company covered by Analyst during the past twelve months. Angel/analyst
has not served as an officer, director or employee of company covered by Analyst and has not been engaged in market making activity
of the company covered by Analyst.
This document is solely for the personal information of the recipient, and must not be singularly used as the basis of any investment
decision. Nothing in this document should be construed as investment or financial advice. Each recipient of this document should
make such investigations as they deem necessary to arrive at an independent evaluation of an investment in the securities of the
companies referred to in this document (including the merits and risks involved), and should consult their own advisors to determine
the merits and risks of such an investment.
Reports based on technical and derivative analysis center on studying charts of a stock's price movement, outstanding positions and
trading volume, as opposed to focusing on a company's fundamentals and, as such, may not match with a report on a company's
fundamentals.
The information in this document has been printed on the basis of publicly available information, internal data and other reliable
sources believed to be true, but we do not represent that it is accurate or complete and it should not be relied on as such, as this
document is for general guidance only. Angel Broking Pvt. Limited or any of its affiliates/ group companies shall not be in any way
responsible for any loss or damage that may arise to any person from any inadvertent error in the information contained in this report.
Angel Broking Pvt. Limited has not independently verified all the information contained within this document. Accordingly, we cannot
testify, nor make any representation or warranty, express or implied, to the accuracy, contents or data contained within this document.
While Angel Broking Pvt. Limited endeavors to update on a reasonable basis the information discussed in this material, there may be
regulatory, compliance, or other reasons that prevent us from doing so.
This document is being supplied to you solely for your information, and its contents, information or data may not be reproduced,
redistributed or passed on, directly or indirectly.
Neither Angel Broking Pvt. Limited, nor its directors, employees or affiliates shall be liable for any loss or damage that may arise from
or in connection with the use of this information.
Note: Please refer to the important ‘Stock Holding Disclosure' report on the Angel website (Research Section). Also, please refer to the
latest update on respective stocks for the disclosure status in respect of those stocks. Angel Broking Pvt. Limited and its affiliates may
have investment positions in the stocks recommended in this report.
Disclosure of Interest Statement
South Indian Bank
1. Analyst ownership of the stock
No
2. Angel and its Group companies ownership of the stock
No
3. Angel and its Group companies' Directors ownership of the stock
No
4. Broking relationship with company covered
No
Note: We have not considered any Exposure below ` 1 lakh for Angel, its Group companies and Directors
Ratings (Based on expected returns
Buy (> 15%)
Accumulate (5% to 15%)
Neutral (-5 to 5%)
over 12 months investment period):
Reduce (-5% to -15%)
Sell (< -15)
January 28, 2016
9