3QFY2019 Result Update | Luggage
February 16, 2019
Safari Industries Ltd
BUY
CMP
`722
Performance Update
Target Price
`1000
(` cr)
3QFY19
3QFY18
% yoy 2QFY19
% qoq
Investment Period
12 months
Revenue
144
104
39.0
127
13.2
EBITDA
Stock Info
11
12
(12.6)
11
(5.2)
Sector
Luggage
OPM (%)
7.5
12.0
(444bp)
9.0
(145bp)
Market Cap (` cr)
1,612
Reported PAT
5
7
(26.8)
6
(19.6)_
Net Debt (` cr)
41
Source: Company, Angel Research
Beta
0.7
For 3QFY2019, Safari Industries (SIL) posted Strong Result top-line growth,
52 Week High / Low
1,005/ 505
though it disappointed on bottom-line front. Revenue grew ~39% yoy to `144cr.
Avg. Daily Volume
5,050
Face Value (`)
2
On the margin front, the company reported operating margin contracted by
BSE Sensex
35,809
444bps yoy. On the bottom-line front, SIL reported de-growth of ~27% yoy to
Nifty
10,724
~`5cr due to cost pressures and higher taxes.
Reuters Code
SAFA.BO
Strong volumes boost overall top-line growth: The Company’s top-line grew by
Bloomberg Code
SII.IN
~39% yoy to `144cr on the back of strong volume growth (strong demand due
strong air passenger growth and market share gain from unorganized player).
Shareholding Pattern (%)
Promoters
57.6
Poor operating performance impacted the overall profitability: On the operating
MF / Banks / Indian
14.5
margin front, the company reported margin contraction by 444bps yoy due to
FII / NRIs / OCBs
10.7
cost pressure on account of INR depreciation.
Indian Public/Others
17.2
Outlook and Valuation: Going ahead, we expect SIL to report a top-line CAGR of
Abs.(%)
3m
1yr
3yr
~36% over FY18-20E to ~`774cr on the back of diversified product portfolio
Sensex
1.6
4.4
52.0
(catering to customers from all segments), and strong distribution network with
SIL
(3.5)
32.0
334.4
high brand recall. Moreover, we believe that SIL’s bottom-line is set to grow at a
CAGR of ~56% over FY18-20E due to gradual improvement in operating
margin. We maintain our Buy recommendation on the stock with a Target Price of
`1000.
Key Financials
Y/E March (` cr)
FY2017
FY2018
FY2019E
FY2020E
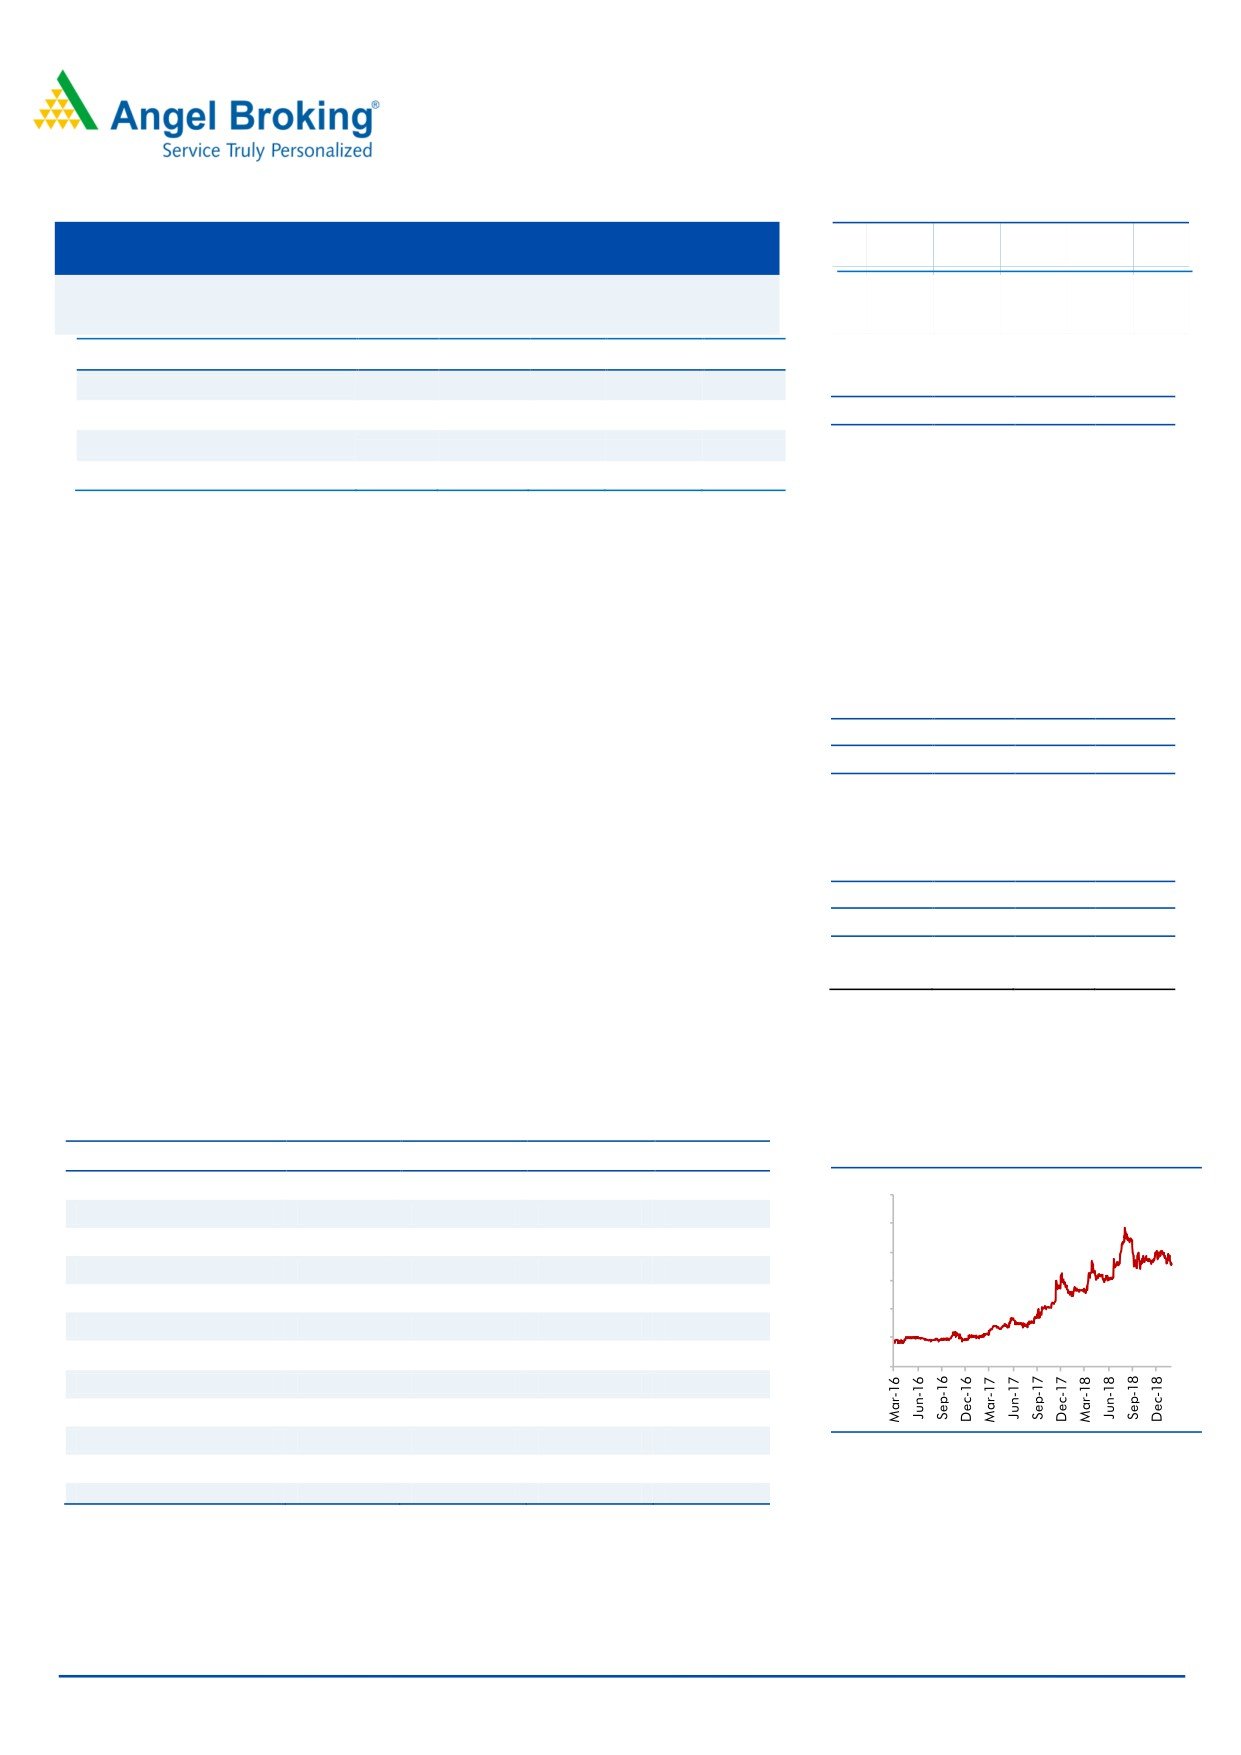
Historical share price chart
Net sales
344
418
595
774
1,200
% chg
23.5
21.5
42.6
30.0
1,000
A dj. Net profit
11
21
34
52
800
% chg
19.9
98.0
59.5
52.1
600
EBITDA margin (%)
6.8
9.8
10.7
11.2
400
EPS (`)
4.8
9.6
15.2
23.2
200
P/E (x)
149.7
75.6
47.4
31.2
0
P/BV (x)
16.0
9.3
7.8
6.2
RoE (%)
10.7
12.3
16.4
20.0
RoCE (%)
12.7
15.3
21.0
24.0
Source: Company, Angel Research
EV/Sales (x)
4.8
4.0
2.8
2.2
EV/EBITDA (x)
70.8
40.5
26.2
19.2
Amarjeet S Maurya
022-40003600 Ext: 6831
Please refer to important disclosures at the end of this report
1
Safari Industries | 3QFY2019 Result Update
Exhibit 1: 3QFY2019 Performance
Y/E March (` cr)
3QFY19
3QFY18
% chg. (yoy)
2QFY19
% chg. (qoq)
9MFY19
9MFY18
% chg
Net Sales
144
104
39
127
13.2
427.61
297.14
43.9
Net raw material
86.4
54
60.0
72.2
19.7
246
162
51.9
(% of Sales)
59.9
52.1
787
56.7
326
57.5
54.5
Empl oyee Cost
17
13
29.8
16
6.8
48
38
28.1
(% of Sales)
11.8
12.6
(84)
12.5
(70)
11.3
12.7
Other Expenses
30
24
23.5
28
7.5
89
70
27.3
(% of Sales)
20.8
23.3
(259)
21.9
(110)
20.8
23.6
T otal Expe nditure
133
91
46.0
116
15.0
384
270
42.2
O perating Profit
11
12
(12.6)
11
(5.2)
44
27
61.2
OPM (%)
7.5
12.0
(444)
9.0
(145)
10.3
9.2
111
Interest
1
1
9.4
1
16.3
2.76
2.38
16.0
Depreciation
2
2
6.5
2
0.9
6.16
4.69
31.3
Other Income
0
0
(64.7)
0
(25.0)
0.47
0.68
(30.9)
PBT before exceptional
8
10
(20.1)
9
(9.0)
36
21
70.0
(% of Sales)
5.5
9.6
6.8
8.3
7.1
Exceptional Items
-
-
PBT
8
10
(20.1)
9
(9.0)
35.6
21.0
70.0
Tax
3
3
(5.4)
3
17.0
12.32
7.4
66.5
(% of PBT)
37.4
31.6
29.1
34.6
35.3
Reported PAT
5
7
(26.8)
6
(19.6)
23.3
13.6
72.0
PATM
3.4
6.5
4.8
5.4
4.6
Extra-ordinary Items
-
0
A dj PAT
5
7
(26.8)
6
(19.6)
23
14
72.0
Source: Company, Angel Research
February 16, 2019
2
Safari Industries | 3QFY2019 Result Update
Downside risks to our estimates
Volatility in foreign currency could impact the company’s profitability (77% of its
revenue comes from soft luggage, which is imported from China).
With closure of many luggage units in China (owing to pollution concerns), the
surviving suppliers have started taking price hikes which could put pressure on its
margins, unless price hike is taken.
Increase in competition from unorganized players would impact overall growth of
the company
Safari’s 23% sales comes from hard luggage segment and any increase in input
cost (most of the key raw material is polypropylene and aluminum) could
negatively impact profitability
February 16, 2019
3
Safari Industries | 3QFY2019 Result Update
Consolidated Profit & Loss Statement
Y/E March (` cr)
FY2016
FY2017
FY2018
FY2019E
FY2020E
Net Sales
278
344
418
595
774
% chg
28.6
23.5
21.5
42.6
30.0
Total Expenditure
260
320
376
532
687
Raw Material
155
201
226
323
421
Personnel
29
40
53
76
100
Others Expenses
76
79
98
132
166
EBITDA
18
23
41
64
87
% chg
62.4
30.3
76.6
54.9
36.1
(% of Net Sales)
6.4
6.8
9.8
10.7
11.2
Depreciation& Amortisation
4
5
6
8
10
EBIT
14
18
35
55
76
% chg
70.0
31.6
92.5
58.6
38.0
(% of Net Sales)
5.0
5.3
8.4
9.3
9.9
Interest & other Charges
3
4
3
4
4
Other Income
1
1
2
1
6
(% of PBT)
6.5
7.1
4.6
1.1
7.7
Recurring PBT
12
16
34
52
78
% chg
119.7
30.0
116.2
55.7
49.8
Tax
4
5
12
18
27
(% of PBT)
35.1
34.5
36.5
35.0
34.0
PAT (reported)
8
10
21
34
52
Extraordinary Items
(1)
(1)
-
-
-
ADJ. PAT
9
11
21
34
52
% chg
94.0
19.9
98.0
59.5
52.1
(% of Net Sales)
3.2
3.1
5.1
5.7
6.7
Basic EPS (`)
4.0
4.8
9.6
15.2
23.2
Fully Diluted EPS (`)
4.0
4.8
9.6
15.2
23.2
% chg
94.0
19.9
98.0
59.5
52.1
February 16, 2019
4
Safari Industries | 3QFY2019 Result Update
Consolidated Balance Sheet
Y/E March (` cr)
FY2016
FY2017
FY2018
FY2019E
FY2020E
SOURCES OF FUNDS
Equity Share Capital
4
4
4
4
4
Reserves& Surplus
87
97
168
202
254
Shareholders Funds
91
101
173
207
259
Total Loans
58
42
55
57
60
Deferred Tax Liability
1
1
1
1
1
Total Liabilities
150
143
229
265
319
APPLICATION OF FUNDS
Gross Block
42
28
39
58
68
Less: Acc. De preciation
18
4
8
16
26
Net Block
24
23
32
42
42
Capital Work-in-Progress
0
1
0
0
0
Investments
0
-
-
-
-
Current Assets
152
174
249
304
382
Inventories
76
94
123
163
204
Sundry De btors
54
58
104
106
131
Cash
5
5
3
2
5
Loans & Advances
8
13
15
24
31
Other Assets
9
3
6
9
12
Current liabilities
27
55
53
73
96
Net Current Assets
125
119
197
231
286
Deferred Tax Asset
1
0
0
0
0
Mis. Exp. not written off
-
-
-
-
-
Total Assets
150
143
229
265
319
February 16, 2019
5
Safari Industries | 3QFY2019 Result Update
Consolidated Cashflow Statement
Y/E March (` cr)
FY2016
FY2017
FY2018E FY2019E FY2020E
Profit before tax
12
16
34
52
78
Depreciation
4
5
6
8
10
Change in Working Capital
(28)
4
(81)
(35)
(53)
Interest / Dividend (Net)
3
4
3
0
0
Direct taxes paid
(4)
(5)
(11)
(18)
(27)
Others
1
1
2
0
0
C ash Flow from Operati ons
(13)
24
(48)
8
9
(Inc.)/ Dec. i n Fixed Assets
(16)
(5)
(15)
(10)
(10)
(Inc.)/ Dec. i n Inve stments
1
(1)
3
0
0
C ash Flow from Inve sting
(15)
(6)
(13)
(10)
(10)
Issue of Equity
7
0
51
0
0
Inc./(Dec.) in loans
3
1
0
2
3
Dividend Paid (Incl. T ax)
(0)
0
0
0
0
Interest / Divide nd (Net)
20
(19)
8
0
0
C ash Flow from Financing
29
(18)
59
2
3
Inc./(Dec.) in Cash
1
(0)
(2)
(0)
2
O pening Cash balance s
4
5
5
3
2
Closing Cash balances
5
5
3
2
5
February 16, 2019
6
Safari Industries | 3QFY2019 Result Update
Key Ratio
Y/E March
FY2016
FY2017
FY2018
FY2019E FY2020E
Valuati on Ratio (x)
P/E (on FDEPS)
179.5
149.7
75.6
47.4
31.2
P/CEPS
136.4
105.3
58.6
38.1
26.0
P/BV
17.7
16.0
9.3
7.8
6.2
Dividend yield (%)
0.0
0.0
0.0
0.0
0.0
EV/Sales
6.0
4.8
4.0
2.8
2.2
EV/EBITDA
93.3
70.8
40.5
26.2
19.2
EV / Total Assets
11.1
11.5
7.3
6.1
5.1
Per Share Data (Rs)
EPS (Basic)
4.0
4.8
9.6
15.2
23.2
EPS (fully diluted)
4.0
4.8
9.6
15.2
23.2
Cash EPS
5.3
6.9
12.3
19.0
27.8
DPS
0.0
0.0
0.0
0.0
0.0
Book Value
40.8
45.3
77.5
92.8
115.9
Returns (%)
ROCE
9.2
12.7
15.3
21.0
24.0
Angel ROIC (Pre-tax)
9.6
13.2
15.5
21.2
24.4
ROE
9.9
10.7
12.3
16.4
20.0
Turnover rati os (x)
Asset Turnover (Gross Block)
6.6
12.4
10.7
10.3
11.4
Inventory / S ales (days)
100
100
107
100
96
Receivables (days)
71
62
91
65
62
Payables (days)
23
51
41
40
40
Working capital cycle (ex-cash) (days)
148
111
156
125
118
Source: Company, Angel Research
February 16, 2019
7
Safari Industries | 3QFY2019 Result Update
Research Team Tel: 022 - 39357800
DISCLAIMER
Angel Broking Limited (hereinafter referred to as “Angel”) is a registered Member of National Stock Exchange of India Limited, Bombay
Stock Exchange Limited and Metropolitan Stock Exchange Limited. It is also registered as a Depository Participant with CDSL and
Portfolio Manager and Investment Adviser with SEBI. It also has registration with AMFI as a Mutual Fund Distributor. Angel Broking
Limited is a registered entity with SEBI for Research Analyst in terms of SEBI (Research Analyst) Regulations, 2014 vide registration
number INH000000164. Angel or its associates has not been debarred/ suspended by SEBI or any other regulatory authority for
accessing /dealing in securities Market. Angel or its associates/analyst has not received any compensation / managed or co-managed
public offering of securities of the company covered by Analyst during the past twelve months.
This document is solely for the personal information of the recipient, and must not be singularly used as the basis of any investment
decision. Nothing in this document should be construed as investment or financial advice. Each recipient of this document sho uld
make such investigations as they deem necessary to arrive at an independent evaluation of a n investment in the securities of the
companies referred to in this document (including the merits and risks involved), and should consult their own advisors to de termine
the merits and risks of such an investment.
Reports based on technical and derivative analysis center on studying charts of a stock's price movement, outstanding positions and
trading volume, as opposed to focusing on a company's fundamentals and, as such, may not match with a report on a company's
fundamentals. Investors are advised to refer the Fundamental and Technical Research Reports available on our website to evaluate the
contrary view, if any
The information in this document has been printed on the basis of publicly available information, internal data and other rel iable
sources believed to be true, but we do not represent that it is accurate or complete and it should not be relied on as such, as this
document is for general guidance only. Angel Broking Limited or any of its affiliates/ group companies shall not be in any wa y
responsible for any loss or damage that may arise to any person from any inadvertent error in the information contained in this repo rt.
Angel Broking Limited has not independently verified all the information contained within this document. Accordingly, we cann ot testify,
nor make any representation or warranty, express or implied, to the accuracy, contents or data contained within this document. While
Angel Broking Limited endeavors to update on a reasonable basis the information discussed in this material, there may be regulatory,
compliance, or other reasons that prevent us from doing so.
This document is being supplied to you solely for your information, and its contents, information or data may not be reproduc ed,
redistributed or passed on, directly or indirectly.
Neither Angel Broking Limited, nor its directors, employees or affiliates shall be liable for any loss or damage that may ari se from or in
connection with the use of this information.
Disclosure of Interest Statement
Safari
1. Financial interest of research analyst or Angel or his Associate or his relative
No
2. Ownership of 1% or more of the stock by research analyst or Angel or associates or relatives
No
3. Served as an officer, director or employee of the company covered under Research
No
4. Broking relationship with company covered under Research
No
Ratings (Returns):
Buy (> 15%)
Accumulate (5% to 15%)
Neutral (-5 to 5%)
Reduce (-5% to -15%)
Sell (< -15%)
February 16, 2019
8