4QFY2016 Result Update | Infrastructure
May 6, 2016
Sadbhav Engineering
BUY
CMP
`252
Performance Highlights
Target Price
`298
Quarterly highlights - Standalone
Investment Period
12 Months
Y/E March (` cr)
4QFY16 4QFY15
% chg (yoy) 3QFY16
% chg (qoq)
Net sales
858
967
(11.3)
753
13.9
Stock Info
Operating profit
81
96
(15.0)
74
10.2
Sector
Infrastructure
Adj. Profit
50
39
28.0
26
91.7
Market Cap (` cr)
4,330
Source: Company, Angel Research
Net Debt (` cr)
1,022
Sadbhav Engineering (SEL) reported an impressive Adj. PAT for 4QFY2016. On
Beta
1.1
the top-line front, it reported an 11.3% yoy decline to `858cr, which is lower than
52 Week High / Low
370/199
our estimates. Lower contribution from the in-house BOT portfolio led to such
Avg. Daily Volume
154,144
revenue decline. Further, higher employee expenses in addition to low
contribution from in-house BOT projects led SEL to report a 41bp yoy decline in
Face Value (` )
1
EBITDA margin to 9.5%, which is almost in-line with our expectations. PAT for the
BSE Sensex
25,262
quarter came in at `41cr. On adjusting for exceptional item of `9cr, SEL’s Adj.
Nifty
7,736
PAT stood at `50cr, which is ahead of our expectation of `44cr. Adjusted PAT
Reuters Code
SADE.BO
margin stood at 5.8% for the quarter vs 4.0% in corresponding period a year
Bloomberg Code
SADE@IN
ago. 4QFY2016 Adj. PAT benefited from high other income and low tax rate. As
of 4QFY2016, SEL is sitting on an order book of `7,487cr (Order Book to LTM
ratio at 2.4x), which provides good revenue visibility.
Shareholding Pattern (%)
Outlook and Valuation: Road order wins in FY2016, strong NHAI bid pipeline,
Promoters
47.1
uptick in MDO awarding, strengthens our view that Sadbhav is poised to report
MF / Banks / Indian Fls
28.1
2.4x growth in its Order Inflows during FY2016-18E to `6,050cr. Considering
FII / NRIs / OCBs
15.0
execution cycle and Order Book mix, we expect Sadbhav to report 1.6x growth in
its Order book during FY2016-18E to `11,949cr. On the back of their strong
Indian Public / Others
9.8
Order Book, we expect Sadbhav to report 14.0% revenue CAGR during FY2016-
18E to `4,140cr. On assuming 36bps EBITDA margin expansion, conservative
other income and low tax rate for FY2017/2018E, we expect SEL’s PAT margin to
Abs. (%)
3m 1yr
3yr
expand by 75bps during FY2016-18E to 4.9%.
Sensex
4.0
(5.4)
28.4
We value SEL using Sum-Of-The-Parts methodology. We value standalone entity
Sadbhav
(15.7)
(13.3)
121.7
on P/E multiple of 12.0x its FY2018E EPS of `11.9, resulting in value of `143 per
share. We value BOT projects individually using Free Cash flow to Equity holder’s
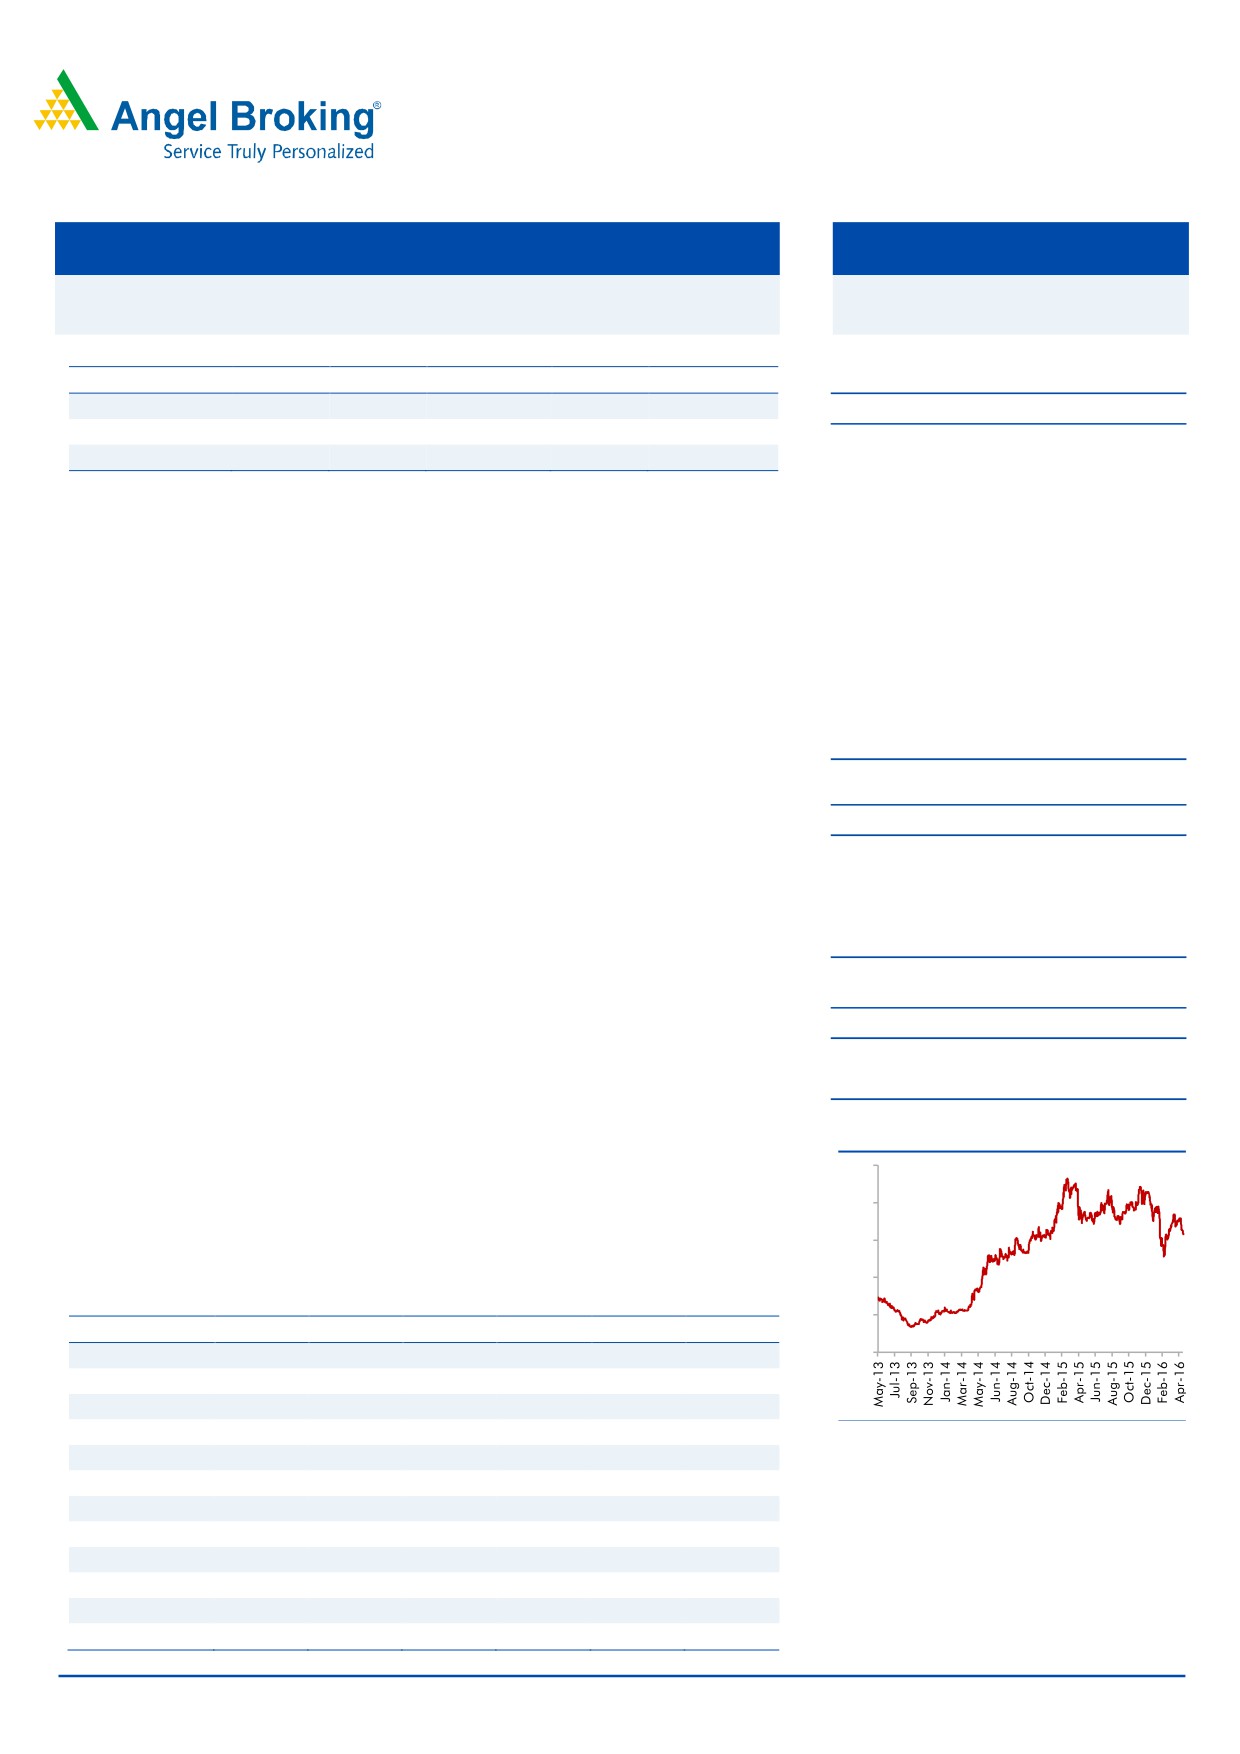
3-Year Daily Price Chart
method. Our value for SIPL’s portfolio of BOT projects comes to `154/share,
400
which is 52% of overall SOTP value for the company. On combining the value of
320
EPC business and BOT projects, we arrive at a combined business value of
`298/share, reflecting 18% upside in stock price from current levels. Accordingly,
240
we upgrade our recommendation on the stock to BUY.
160
Key financials (Standalone)
80
Y/E March (` cr)
FY13
FY14
FY15
FY16
FY17E
FY18E
Net Sales
1,811
2,358
2,970
3,186
3,598
4,140
0
% chg
(32.3)
30.2
25.9
7.3
12.9
15.1
Net Profit
13
145
118
134
155
205
% chg
(47.3)
1000.3
(18.4)
13.4
15.8
32.3
Source: Company, Angel Research
EBITDA (%)
8.6
10.6
10.3
10.2
10.3
10.6
EPS (Rs)
5
7
7
8
9
12
P/E (x)
51.6
36.0
38.1
32.4
27.9
21.1
P/BV (x)
4.6
4.0
3.2
2.9
2.7
2.4
RoE (%)
9.3
11.9
9.9
9.4
9.9
11.9
RoCE (%)
9.0
12.0
10.3
10.5
0.0
12.9
Yellapu Santosh
EV/Sales (x)
2.5
2.0
1.8
1.7
1.5
1.3
022 - 3935 7800 Ext: 6811
EV/EBITDA (x)
28.7
18.5
17.4
16.4
14.4
11.9
Source: Company, Angel Research; Note: CMP as of May 5, 2016
Please refer to important disclosures at the end of this report
1
Sadbhav Engineering | 4QFY2016 Result Update
Exhibit 1: 4QFY2016 performance (Standalone)
Particulars (` cr)
4QFY16
3QFY16
% chg (qoq) 4QFY15
% chg (yoy)
FY16
FY15
% chg (yoy)
Net Sales
858
753
13.9
967
(11.3)
3,186
2,970
7.3
Total Expenditure
777
679
14.3
872
(10.9)
2,861
2,665
7.3
Construction Expenses
700
608
15.1
785
(10.8)
2,590
2,432
6.5
Changes in Inv. Of FG & WIP
0
0
nmf
0
nmf
0
0
nmf
Employee Benefits Expense
31
31
(0.5)
27
15.6
122
97
25.5
Other Expenses
46
40
14.0
60
(23.9)
148
136
8.9
EBITDA
81
74
10.2
96
(15.0)
325
304
6.9
EBIDTA %
9.5
9.8
9.9
10.2
10.3
Depreciation
21
22
(1.6)
15
44.6
85
82
3.9
EBIT
60
52
15.1
81
(25.9)
240
223
8.0
Interest and Financial Charges
27
20
32.9
25
8.6
86
89
(3.2)
Other Income
20
1
1,578.8
12
65.8
25
16
54.0
PBT before Exceptional Items
52
33
59.6
68
(22.6)
179
150
19.6
Exceptional Items
9
(1)
0
19
0
PBT after Exceptional Items
43
34
26.6
68
(36.0)
160
150
6.7
Tax
3
7
(60.7)
29
(90.6)
26
32
(18.0)
% of PBT
6.3
20.2
42.7
16.5
21.4
PAT
41
27
48.7
39
4.7
134
118
13.4
Adj. PAT
50
26
91.7
39
28.0
153
118
29.9
Adj. PAT %
5.8
3.4
4.0
4.8
4.0
Dil. EPS
2.37
1.59
49.1
2.27
4.4
7.79
7.25
7.4
Source: Company, Angel Research
Execution takes beating during the quarter
SEL reported 11.3% yoy revenue decline in 4QFY2016 to `858cr. Revenue decline
is owing to 14.5% decline in revenues booked from in-house BOT projects (46.8%
of 4QFY2016 revenues booked). Completion of BOT projects and lack of
contribution from orders won in FY2016, led to such fall in yoy revenues. Revenue
from EPC road projects declined 15.5% yoy to `160cr, owing to completion of old
projects in the order book.
Exhibit 2: Segment-wise Revenue movement
4Q
3Q
2Q
1Q
4Q
3Q
% chg
Segment
FY16
FY16
FY16
FY16
FY15
FY15
(yoy)
Roads
562
560
593
507
659
445
(14.8)
BOT
402
428
461
407
470
374
(14.5)
EPC
160
132
132
100
189
72
(15.5)
Irrigation
204
100
31
201
166
138
22.9
Mining
87
92
120
120
139
139
(37.2)
Power Gen. & Oth. Inc.
5
1
2
2
1
1
49.5
Revenues
858
753
746
829
965
722
(11.3)
Source: Company, Angel Research
Again, if we look at revenue booking for the quarter from top 5 projects, then the
top 5 projects contributed 55.3% of 4QFY2016 revenues (vs 74.2% in the previous
quarter). Further, all the 3 Captive Road projects contributed a major chunk of the
quarter’s revenues (accounted for 41.8% of the quarter’s revenues).
May 6, 2016
2
Sadbhav Engineering | 4QFY2016 Result Update
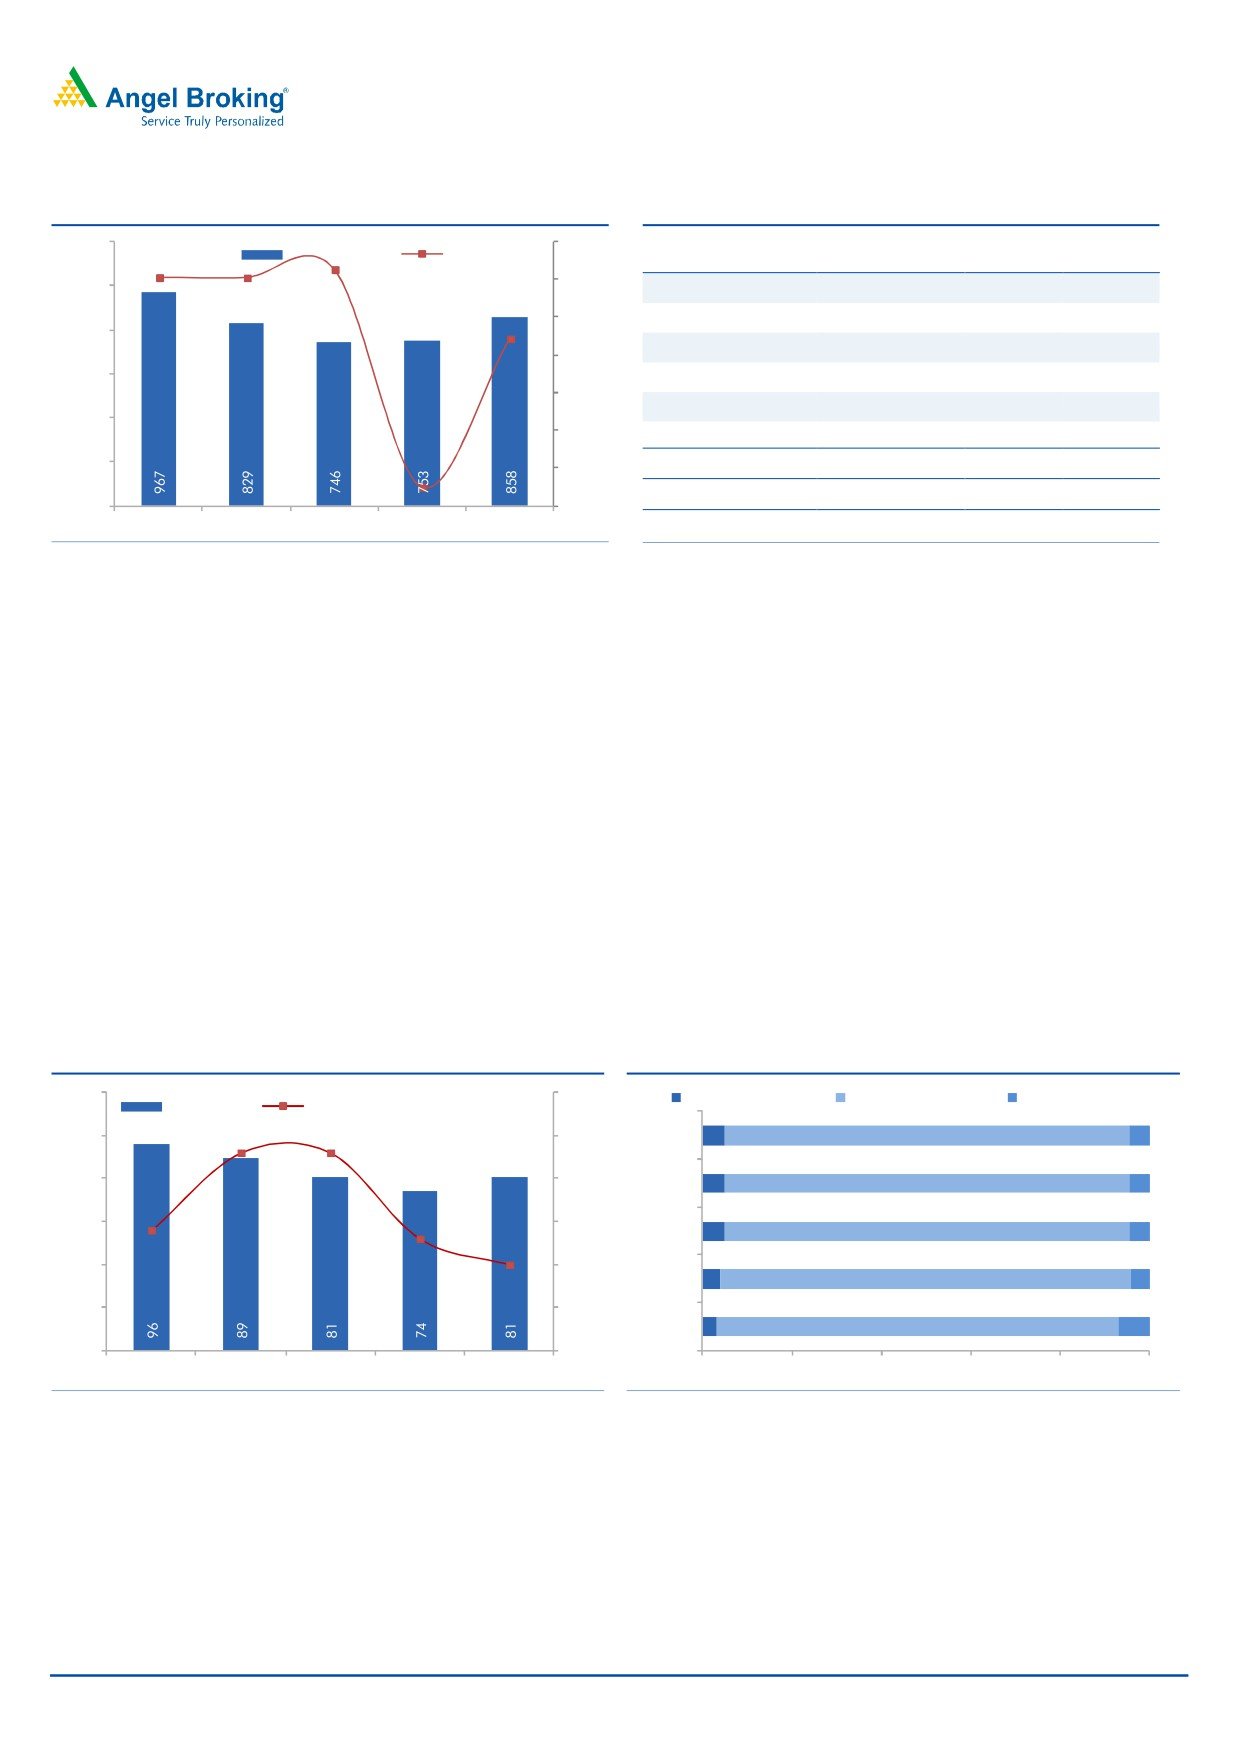
Exhibit 3: Quarterly Revenue movement
Exhibit 4: Revenues from Top 5 Projects
1,200
40
21.1
Revenues (` cr)
yoy growth (%)
Project Name
Vertical
4QFY16 3QFY16
20
1,000
Rohtak-Hissar
Captive Road BOT
126
162
21.0
25.4
(11.3)
0
Mysore-Bellary
Captive Road BOT
176
164
800
(20)
DMRC
Road EPC
69
103
600
Bhilwara-Rajsamand Captive Road BOT
57
83
(40)
Radhanpur-Manpur Irrigation
47
400
(60)
Kachch Branch Cap. Irrigation
48
(89.9)
200
(80)
Total Revenues
858
753
0
(100)
4QFY15
1QFY16
2QFY16
3QFY16
4QFY16
As % of total
55.3%
74.2%
Source: Company, Angel Research
Source: Company, Angel Research
For FY2016, Sadbhav reported 7.3% yoy increase in revenues to `3,186cr, mainly
owing to weak opening order book and minimal revenue contribution from EPC
orders won since Feb-2015. For the full year, revenue from Mining & Road-EPC
projects declined by 20.2% and 13.9% yoy respectively and was compensated by
an impressive 20% yoy growth in revenue from Road-BOT projects segment.
EBITDA Margins decline yoy to 9.5%
SEL reported an EBITDA of `81cr for 4QFY2016, down 15.0% yoy, but up 10.2%
qoq. The EBITDA margin declined 41bp yoy to 9.5%. In addition to slower
execution, a 15.6% yoy increase in employee expenses led to a decline in the
EBITDA margin. Higher yoy contribution of low margin irrigation business and
lower yoy contribution of high margin mining business led to margin decline. Also,
increase in VAT rates for Rohtak-Hissar project also contributed to yoy EBITDA
margin decline.
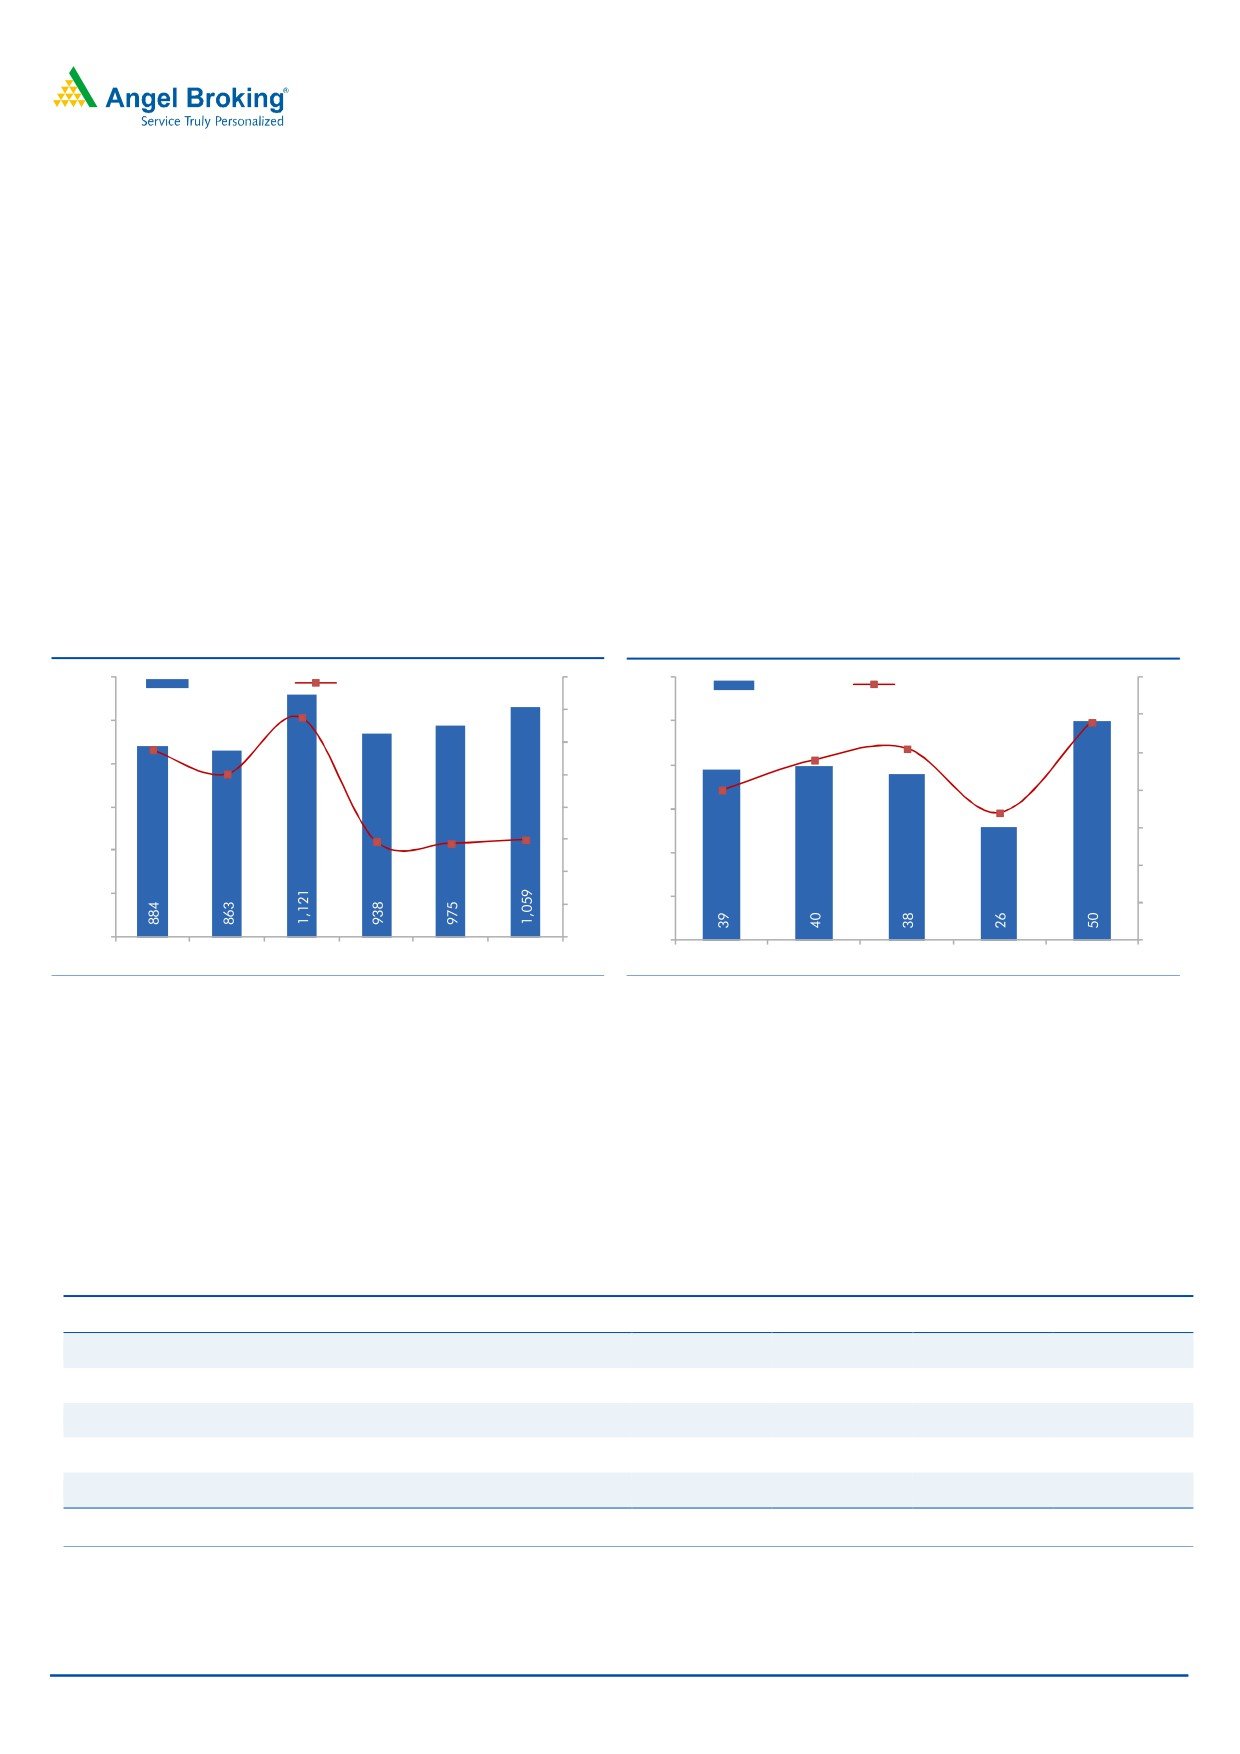
Exhibit 5: EBITDA% declines
Exhibit 6: Quarterly Expense movement
120
11.5
Emp. Exp as % of sales Const. Exp as % of sales Oth. Exp as % of sales
EBITDA (` cr)
EBITDA (%)
10.8
100
10.8
11.0
4QFY16
4.3
81.6
4.1
80
10.5
3QFY16
4.3
80.8
4.1
9.9
60
9.8
10.0
9.5
2QFY16
4.3
80.8
4.1
40
9.5
1QFY16
3.4
82.0
3.8
20
9.0
4QFY15 2.8
81.2
6.2
0
8.5
4QFY15
1QFY16
2QFY16
3QFY16
4QFY16
0%
20%
40%
60%
80%
100%
Source: Company, Angel Research
Source: Company, Angel Research
On the back of high contribution from the low margin Irrigation projects, the
EBITDA margins for FY2016 declined by 4bp to 10.2%.
May 6, 2016
3
Sadbhav Engineering | 4QFY2016 Result Update
Higher Other Income and lower tax aid PAT growth
PAT for the quarter came in at `41cr. Adjusting for exceptional item of `9cr, SEL’s
Adj. PAT stood at `50cr, ahead of our expectation of `44cr. Exceptional item for
the quarter includes, (1) `18.9cr write-off related to settlement agreement with
Ocean Bright Corp., and (2) `9.8cr of provision reversal related to Dhule Palesnar
BOT (as this SPV is no longer required to pay 1% labour cess to state government).
Adjusted PAT margins were at 5.8% for the quarter vs 4.0% in the corresponding
period a year ago. 4QFY2016 Adj. PAT benefited from high other income and low
tax rate. Higher other income is owing to `12.6cr of interest income received from
GKC’s Irrigation projects. Lower tax during the quarter is on account of `2.7cr of
benefits availed sec. 80IA. Interest expenses on yoy basis increased to `27cr, on
account of (1) higher bank guarantees as the company bid for new projects and
(2) higher working capital on mobilization of recently won EPC projects.
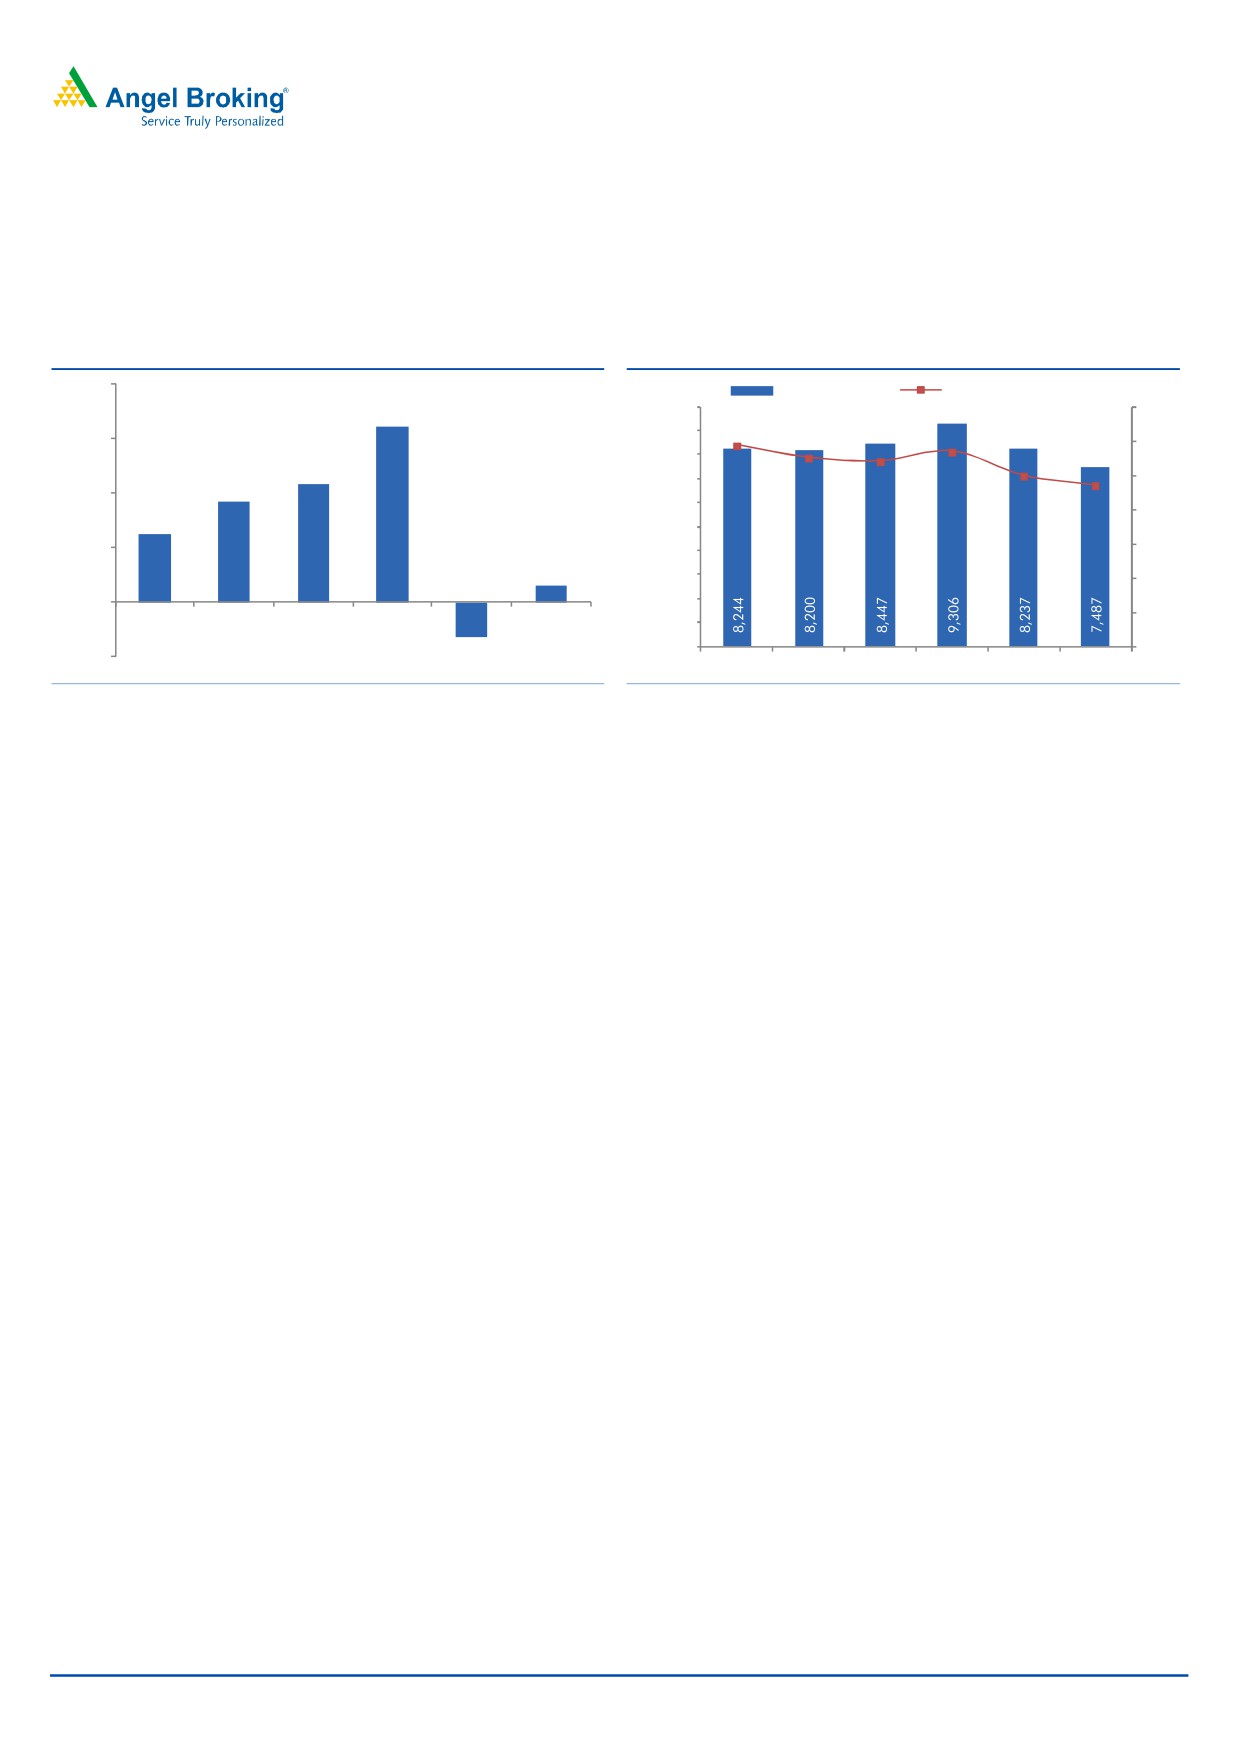
Exhibit 7: D/E ratio at 0.7x
Exhibit 8: PAT% also expands
1,200
1.2
60
7.0
Debt o/s (` cr)
D/E (x)
Adj. PAT (` cr)
Adj. PAT %
5.8
1.1
6.0
1,000
50
5.1
1.1
1.0
4.0
5.0
800
40
1.0
0.9
4.8
3.4
4.0
0.9
600
0.8
30
3.0
0.7
400
20
0.7
0.7
0.7
2.0
0.6
200
10
0.5
1.0
0
0.4
0
0.0
2QFY14
4QFY14
2QFY15
4QFY15
2QFY16
4QFY16
4QFY15
1QFY16
2QFY16
3QFY16
4QFY16
Source: Company, Angel Research
Source: Company, Angel Research
Strong other income and lower tax rate contributed to 84bp yoy Adj. PAT margin
expansion to 4.8% in FY2016.
Execution to pick-up on the back of orders won in FY2016…
In FY2016 SEL reported order inflows of `2,508cr, majorly from Road EPC projects
(worth `2,365cr). In FY2016, SEL won 5 Road EPC projects worth `2,684cr and
reported cancellation of 1 project worth `319cr (Marve-Borivalli Road EPC project).
Exhibit 9: Details of Order Inflows during 1HFY2016
Project Detail
Segment
Length (kms)
TPC (` cr)
Duration
6-lane Eastern peripheral Expressway
Road EPC
21
792
2.5 yrs
6-lane Eastern peripheral Expressway
Road EPC
25
756
2.5 yrs
6-lane of UP/ Haryana border-Yamunanagar-Saha-Barwala-Panchkula
Road EPC
45
468
2.5 yrs
6-lane of UP/ Haryana border-Yamunanagar-Saha-Barwala-Panchkula
Road EPC
42
437
2.5 yrs
4-lane of Tapa-Bathinda (SEL stake-51%)
Road EPC
41
231
2.5 yrs
Total (5 Road Projects)
173
2,684
Source: Company, Angel Research
May 6, 2016
4
Sadbhav Engineering | 4QFY2016 Result Update
SEL has been announced L1 for 2 Hybrid project worth ~`1,350cr. SEL’s
unexecuted order book as of 4QFY2016 (excluding the 2 above-mentioned Hybrid
projects) stands at ~`7,487cr (Order book to LTM sales ratio at 2.4x). Roads &
Highways vertical (54%) continues to dominate SEL’s order book mix.
Exhibit 10: Quarterly Order Inflows (` cr)
Exhibit 11: Order Book (OB/ LTM sales at 2.4x)
2,000
Order Book (` cr)
OB/LTM sales (x)
1,608
10,000
3.5
2.9
2.9
9,000
1,500
2.8
2.7
2.5
2.4
3.0
8,000
1,076
7,000
2.5
923
1,000
6,000
2.0
620
5,000
500
4,000
1.5
144
3,000
1.0
0
2,000
0.5
3QFY2015
4QFY2015
1QFY2016
2QFY2016
3QFY2016
4QFY2016
1,000
0
0.0
(500)
(319)
3QFY2015 4QFY2015 1QFY2016 2QFY2016 3QFY2016 4QFY2016
Source: Company, Angel Research
Source: Company, Angel Research
Debt continues to increase…
Sadbhav has reported higher than expected increase in debt to `10,588cr (v/s
`9,383cr at FY2015-end). This is mainly on account of (1) additional support for
delays in receipt of grant worth `130cr given to SPVs (not yet returned) led to the
surge in debt and (2) stretch in the working capital. Notably, despite stretch in the
working capital cycle, trade payables declined from 141 days in FY2015 to 128
days in FY2016.
May 6, 2016
5
Sadbhav Engineering | 4QFY2016 Result Update
Concall Highlights & Comments:
Huge bid pipeline in the offing: SEL’s management has highlighted that a large
bid pipeline, led by the Roads & Highways sector, is in the offing. SEL has guided
for FY2017E order wins in the range of ~`5,000-7,000cr.
In the Roads & Highways space, the Management currently is seeing tendering
activity of
~`40,000cr (EPC projects-
~`18,400cr; Hybrid Annuity projects-
`3,000cr and BOT projects-`17,700cr). In the Mining space, SEL has submitted
bids for Telangana & Rajasthan Coal/ Mining blocks. Also, SEL plans to submit
bids for 5 more MDO jobs. Further, SEL has already participated in a `1,450cr
Punjab based Irrigation bid.
Execution to catch-up from FY2017E onwards: SEL reported 5 large EPC project
wins in FY2016. Already `65cr has been spent towards gross block to start
execution of these projects. Also, SEL has received mobilization advance of `210cr.
Also, management highlighted that 80% of land towards Hybrid projects has been
acquired and works will start in 2HFY2017. On the whole, the Management
guided for FY2017 revenues of `3,700-3,800cr on the back of `2,500cr revenues
from Roads & Highways segment, ~`400cr from Mining segment and another
`800cr from Irrigation segment. Earlier than expected operationalization of the
Dhanbad mines could add another `100cr to the revenue guidance.
FY2016 EBITDA margins were impacted on account of (1) imposition of additional
VAT charges on 2 of the EPC projects, (2) higher contribution of low margin
Irrigation business, and (3) lower contribution of high margin Mining business. We
do not expect any further impact of additional VAT charges on EPC revenues, as
they would contribute less to FY2017E top-line. However, contribution of ongoing
Irrigation projects would continue to put pressure on FY2017E EBITDA margins.
Accordingly for FY2017E, we assume slightly lower EBITDA margins of 10.3%,
against Management’s guidance of 10.5%.
Management guides for improvement in Working capital cycle: Given that
~`150cr of loans and advances were made towards stalled Irrigation projects,
working capital cycle increased in FY2016. With these Irrigation projects expected
to get completed in FY2017E, we expect Loans & Advances to decline in FY2017E.
Further, Management indicated that SIPL would start repaying Loans & Advances
to SEL as SIPL has started making cash level profits.
May 6, 2016
6
Sadbhav Engineering | 4QFY2016 Result Update
Update on SIPL’s Quarterly performance
SIPL reported 118.9% yoy increase in its 4QFY2016 consolidated revenues to
`281.8cr, reflecting (1) commissioning of Shrinathji-Udaipur project (contributed
`22.8cr of toll income), and (2) increase in O&M revenues (reported under the
standalone financials).
Exhibit 12: Toll Income across Operating BOT Projects
Q1FY15
Q2FY15
Q3FY15
Q4FY15
Q1FY16
Q2FY16
Q3FY16
Q4FY16
yoy (%)
Ahmedabad Ring Road (ARRIL)
19
20
22
22
22
21
23
25
10.6
Aurangabad-Jalna (AJTL)
9
8
9
10
9
7
8
9
(8.6)
Dhule-Palasner (DPTL)
34
32
34
36
36
37
38
39
9.8
Maharashtra Border (MBCPNL)
20
22
24
26
34
37
42
43
65.6
Rohtak Panipat (RPTL)
22
20
21
22
22
20
22
18
(19.5)
Bijapur- Hungund (BHTPL)
26
26
25
27
28
28
28
30
10.3
Hyderabad-Yadgiri (HYTPL)
11
11
11
12
13
12
14
15
29.7
Shreenathji-Udaipur (SUTPL)
0
0
0
0
0
0
6
23
Source: Company, Angel Research
AJTL reported 8.6% yoy decline in toll income to `8.7cr, owing to (1) 53.3%
decline in Trucks category (to `1.8cr), and (2) loss of toll income owing to
exemption on passenger cars and Maharashtra state government buses. However,
on like-to-like basis, toll income of LCV and MAV category grew 22.1% to `6.9cr.
Amongst all 8 operating BOT projects, HYTPL reported an impressive 29.7% yoy
increase to `15.2cr (includes benefit of 3.2% tariff hike). MBPCL BOT project on
the other hand, reported 65.6% yoy increase in fee income to `43.1cr, reflecting
benefits of 4 more check posts getting operational. RPTPL BOT project reported
19.5% yoy decline in toll income to `18.0cr, reflecting loss of toll income owing to
agitation/violence impact from 17th to 27th Feb 2016.
On the back of strong yoy top-line growth, EBITDA grew 136.5% to `177cr.
Alternatively, EBITDA margins also improved 467bp yoy to 62.8%. EBITDA margin
expansion on a yoy basis is despite `30.1cr of periodic maintenance. SIPL reported
net profit of `0.17cr against loss of `81.6cr in 4QFY2015. Net profit for
4QFY2016 includes the impact of one-time exceptional gain of `61.6cr resulting
from stake sale of Mumbai Nashik Expressway for consideration of `72cr (net cost
`10.4cr). On adjusting for exceptional gain, SIPL posted a net loss of `61.4cr.
With commissioning of Shrinathji Udaipur BOT project and consolidation of Dhule
Palesnar BOT project, interest expenses increased
32.3% yoy to
`185cr.
Consolidated debt of SIPL at 4QFY2016-end stands at `7,952cr against `6,204cr
as of 4QFY2015-end.
Update on SIPL’s FY2016 Yearly Financials
SIPL reported consolidated revenue of `742cr for FY2016, up 48.3% yoy, reflecting
the benefits of commissioning of Shrinathji-Udaipur BOT project, commencement
of additional check posts at MBCPNL and consolidation of the Dhule Palesnar BOT
project. EBITDA increased 54.5% yoy to `477cr in FY2016. Alternatively, EBITDA
margins expanded from 61.7% in FY2015 to 64.3% in FY2016. On adjusting for
exceptional gains of `11.7cr/`61.6cr in FY2015/FY2016, SIPL’s net loss stood at
`343cr/ `260.5cr in FY2015/ FY2016, respectively.
May 6, 2016
7
Sadbhav Engineering | 4QFY2016 Result Update
Outlook and Valuation
Considering the Road order wins in FY2016, strong NHAI bid pipeline, uptick in
MDO awarding, strengthens our view that Sadbhav is poised to report 2.4x growth
in its Order Inflows during FY2016-18E to `6,050cr. Considering execution cycle
and Order Book mix, we expect Sadbhav to report 1.6x growth in its Order book
during FY2016-18E to `11,949cr.
On the back of strong `7,487cr of Order Book at 4QFY2016-end, we expect
Sadbhav to report 14.0% revenue CAGR during FY2016-18E to `4,140cr. With
contribution from the low margin Irrigation projects expected to further decline in
FY2017E, we have modeled 36bps EBITDA margin expansion during FY2016-18E
to 10.6%. Further, we have modeled conservative other income numbers and low
tax rate for FY2017/2018E at `14cr/14cr and 24%, respectively. Accordingly, we
expect Sadbhav’s PAT margin to expand by 75bp during FY2016-18E to 4.9%.
Exhibit 13: FY2017E Estimates & FY2018E Roll-Out
FY2017E
FY2018E
Y/E March (` cr)
Old
New
Change (%)
Net Sales
4,219
3,598
(14.7)
4,140
EBITDA
456
370
(18.8)
438
EBITDA Margins (%)
10.8
10.3
10.6
PAT
213
155
(27.2)
205
PAT Margins (%)
5.0
4.3
4.9
Source: Company, Angel Research
We have valued SEL using Sum-Of-The-Parts method. SEL’s EPC business (under
standalone entity) has been valued using FY2018E P/E multiple, whereas we have
used free cash flow to equity holders method to value BOT Road projects, which
are held under SIPL, the holding company for BOT Road projects.
Value of Core EPC business
Considering visibility on SEL’s core EPC business (standalone entity), we have
valued the standalone entity on P/E multiple of 12.0x its FY2018E EPS of `11.9cr,
resulting in a value of `143 per share.
Value of BOT projects
We have used free cash flow to equity holders method to value BOT Road projects,
which are held under SIPL, the holding company for BOT Road projects. Our value
for SIPL’s portfolio of BOT projects comes to `154/share, which is 52% of the
overall SOTP value for the company.
On combining the value of EPC business and BOT projects, we arrive at a
combined business value of `298/share, reflecting 18% upside in the stock price
from the current levels. Accordingly, we upgrade our recommendation on the stock
to BUY.
May 6, 2016
8
Sadbhav Engineering | 4QFY2016 Result Update
Exhibit 14: SOTP break-up
FY18E Std.
Target
Target
Value/
% of
Particulars
Segment
Basis
PAT (` cr)
Multiple
Value (` cr)
share (`)
SoTP
EPC business
Construction
205
12.0
2,459
143
48
P/E of 12.0x
Total
2,459
143
48
Disounted
Subsidiary
Adj. FCFE
Value/
% of
Subsidiary
Segment
Basis
FCFE (` cr)
Stake
Value (` cr)
share (`)
SoTP
Sadbhav Infra. Projects
BOT Projects
3,826
69%
2,646
154
52
FCFE valuation
Total
3,826
2,646
154
52
Grand Total
5,106
298
100
Upside
18%
CMP
252
Source: Company, Angel Research
Risks & Concerns
Any slowdown in orders from NHAI / State governments could affect the
company’s order inflow adversely.
Delays in the commencement of BOT projects than the estimated time-line.
May 6, 2016
9
Sadbhav Engineering | 4QFY2016 Result Update
Investment arguments
Strong Order Backlog: SEL in FY2016 reported order wins to the tune of `2,509cr.
All these EPC order wins are Non-Captive Road projects. As of 4QFY2016-end,
SEL is sitting on a healthy order book of `7,487cr (2.4x order book to LTM ratio).
We expect the awarding activity from NHAI & MoRTH to further gain momentum
and SEL to emerge as a strong beneficiary. Accordingly, we model 1.6x growth in
order backlog from `7,487cr in FY2016 to `11,949cr by FY2018E.
Order Backlog gives strong revenue visibility: At 4QFY2016-end, SEL was sitting
on a strong order book of `7,487cr. Considering their diligent bidding strategy,
and past execution track record, we are comforted that project execution
momentum would further gain from the current levels. Accordingly, we expect SEL
to report a strong 14.0% top-line CAGR during FY2016-18E.
Strong execution to further drive PAT growth: At the backdrop of strong execution,
benign bitumen costs and other operating levers coming into play, we expect SEL
to report 16.0% EBITDA CAGR during FY2016-18E. In-line with EBITDA growth,
we expect SEL to report 23.8% PAT CAGR during FY2016-18E.
Sound Balance Sheet: SEL has a sound balance sheet with consol. net debt/equity
of 0.7x as of 4QFY2016. SEL’s working capital position (Working Capital to LTM
sales ratio as of FY2016 stands at 24.9%) is better than most of its peers. This has
helped the company maintain strong earnings growth up to a certain extent.
Funds tied up for SIPL projects in the portfolio: SEL successfully raised `400cr
through 22% stake dilution in its subsidiary SIPL in Aug-2010. Further, in Sep-
2015, SIPL got listed on the Indian bourses, where it raised equity for its last
pending project Shreenathji-Udaipur. Now, SIPL is fully tied-up for all of its BOT
projects in-hand. Timely fund raising exercise at regular intervals has helped SEL
focus on project execution, thereby, leading to early completion of projects.
Company background
SEL was incorporated in 1988. The company is a leading EPC and infrastructure
development company based in Ahmedabad. SEL is present in the Roads and
Highways (54.3% of order book), Irrigation (19.3%) and Mining (26.4%) sectors.
The company forayed into the road sector in 1995 and has since then executed
several projects for NHAI and state governments. Currently, SEL through its
subsidiary SIPL is one of the largest BOT players in India with 12 projects in its
portfolio.
May 6, 2016
10
Sadbhav Engineering | 4QFY2016 Result Update
Profit & loss statement (Standalone)
Y/E March (` cr)
FY13
FY14
FY15
FY16
FY17E FY18E
Net Sales
1,811
2,358
2,970
3,186
3,598
4,140
% Chg
(32.3)
30.2
25.9
7.3
12.9
15.1
Total Expenditure
1,655
2,109
2,665
2,861
3,228
3,703
Construction Expenses
1,520
1,945
2,432
2,590
2,950
3,395
Employee benefits Expense
43
60
97
122
116
132
Other Expenses
93
104
136
148
162
176
EBITDA
156
249
304
325
370
438
% Chg
(46.3)
60.1
22.1
6.9
13.7
18.3
EBIDTA %
8.6
10.6
10.3
10.2
10.3
10.6
Depreciation
32
47
82
85
89
96
EBIT
124
202
223
240
281
342
% Chg
(51.0)
63.0
10.3
8.0
16.8
21.7
Int. and Fin. Charges
84
93
89
86
91
86
Other Income
10
11
16
25
14
14
PBT
50
120
150
180
204
270
Tax
37
(24)
32
26
49
65
% of PBT
73.7
(20.1)
21.4
14.7
24.0
24.0
PAT before Exceptional item
13
145
118
153
155
205
Exceptional item
0
0
0
19
0
0
PAT
13
145
118
134
155
205
% Chg
(47.3)
1000.3
(18.4)
13.4
15.8
32.3
PAT %
0.7
6.1
4.0
4.2
4.3
4.9
Basic EPS
5
7
7
8
9
12
Diluted EPS
1
10
7
8
9
12
% Chg
(47.7)
43.3
(5.4)
17.6
15.8
32.3
May 6, 2016
11
Sadbhav Engineering | 4QFY2016 Result Update
Balance sheet (Standalone)
Y/E March (` cr)
FY13
FY14
FY15
FY16
FY17E
FY18E
Sources of Funds
Equity Capital
15
15
17
17
17
17
Reserves Total
817
942
1,335
1,472
1,609
1,796
Networth
833
957
1,352
1,489
1,626
1,813
Total Debt
673
863
938
1,059
1,074
959
Other Long-term Liabilities
80
52
34
3
6
6
Deferred Tax Liability
32
36
24
23
23
23
Total Liabilities
1,618
1,908
2,348
2,574
2,729
2,801
Application of Funds
Gross Block
515
726
851
955
1,054
1,163
Accumulated Depreciation
185
228
315
400
489
585
Net Block
330
498
536
555
565
578
Capital WIP
0
0
0
0
0
0
Investments
538
521
531
528
568
603
Current Assets
Inventories
102
164
213
141
220
230
Sundry Debtors
736
732
907
999
1,129
1,265
Cash and Bank Balance
22
76
35
37
58
69
Loans, Adv. & Deposits
535
489
651
595
700
805
Other Current Asset
33
46
64
85
100
127
Current Liabilities
873
1,120
1,177
1,062
1,329
1,518
Net Current Assets
555
387
693
795
878
977
Other Assets
194
502
588
679
717
643
Total Assets
1,618
1,908
2,348
2,557
2,727
2,801
May 6, 2016
12
Sadbhav Engineering | 4QFY2016 Result Update
Cash flow statement (Standalone)
Y/E March (` cr)
FY13
FY14
FY15
FY16
FY17E
FY18E
Profit before tax
74
106
114
134
155
205
Depreciation
32
47
82
85
89
96
Change in Working Capital
(107)
312
(296)
(246)
33
168
Interest & Fin. Charges
84
118
138
86
91
86
Direct taxes paid
(49)
(49)
(59)
(26)
(49)
(65)
Other Non-Cash Charges
32
(11)
(15)
(3)
(1)
(1)
Cash Flow from Operations
66
524
(37)
29
318
489
(Inc)/ Dec in Fixed Assets
(70)
(218)
(149)
(104)
(99)
(109)
(Inc)/ Dec in Inv. & Oth. Adj.
(263)
(349)
(103)
99
(154)
(152)
Cash Flow from Investing
(332)
(568)
(252)
(5)
(253)
(260)
Issue/ (Buy Back) of Equity
3
27
315
0
0
0
Inc./ (Dec.) in Loans
310
258
66
120
15
(115)
Dividend Paid (Incl. Tax)
(10)
(11)
(12)
(10)
(18)
(18)
Interest Expenses
(84)
(118)
(132)
(86)
(91)
(86)
Cash Flow from Financing
218
157
237
24
(94)
(219)
Inc./(Dec.) in Cash
(48)
113
(52)
48
(28)
9
Opening Cash balances
55
6
58
6
55
26
Closing Cash balances
6
120
6
55
26
35
May 6, 2016
13
Sadbhav Engineering | 4QFY2016 Result Update
Key Ratios
Y/E March
FY13 FY14 FY15 FY16 FY17E FY18E
Valuation Ratio (x)
P/E (on FDEPS)
51.6
36.0
38.1
32.4
27.9
21.1
P/CEPS
85.3
20.0
22.1
19.8
17.8
14.4
Dividend yield (%)
0.2
0.3
0.3
0.2
0.4
0.4
EV/Sales
2.5
2.0
1.8
1.7
1.5
1.3
EV/EBITDA
28.7
18.5
17.4
16.4
14.4
11.9
EV / Total Assets
2.8
2.4
2.2
2.1
2.0
1.9
Per Share Data (`)
EPS (Basic)
4.9
7.0
6.6
7.8
9.0
11.9
EPS (fully diluted)
0.9
9.5
6.6
7.8
9.0
11.9
Cash EPS
3.0
12.6
11.4
12.7
14.2
17.5
DPS
0.6
0.7
0.7
0.5
0.9
0.9
Book Value
55
63
79
87
95
106
Returns (%)
RoCE (Pre-tax)
9.0
12.0
10.3
10.5
0.0
12.9
Angel RoIC (Pre-tax)
10.5
13.4
11.9
11.2
0.0
13.4
RoE
9.3
11.9
9.9
9.4
9.9
11.9
Turnover ratios (x)
Asset Turnover (Gross Block) (x)
5.9
5.7
5.7
5.8
6.4
7.2
Inventory / Sales (days)
19
21
23
20
18
20
Receivables (days)
150
114
101
109
108
106
Payables (days)
176
154
141
128
121
126
Leverage Ratios (x)
D/E ratio (x)
0.8
0.8
0.7
0.7
0.6
0.5
Net Debt/ EBITDA (x)
4.2
3.2
3.0
3.1
2.7
2.0
May 6, 2016
14
Sadbhav Engineering | 4QFY2016 Result Update
Research Team Tel: 022 - 39357800
DISCLAIMER
Angel Broking Private Limited (hereinafter referred to as “Angel”) is a registered Member of National Stock Exchange of India Limited,
Bombay Stock Exchange Limited and Metropolitan Stock Exchange of India Limited. It is also registered as a Depository Participant with
CDSL and Portfolio Manager with SEBI. It also has registration with AMFI as a Mutual Fund Distributor. Angel Broking Private Limited is
a registered entity with SEBI for Research Analyst in terms of SEBI (Research Analyst) Regulations, 2014 vide registration number
INH000000164. Angel or its associates has not been debarred/ suspended by SEBI or any other regulatory authority for accessing
/dealing in securities Market. Angel or its associates including its relatives/analyst do not hold any financial interest/beneficial
ownership of more than 1% in the company covered by Analyst. Angel or its associates/analyst has not received any compensation /
managed or co-managed public offering of securities of the company covered by Analyst during the past twelve months. Angel/analyst
has not served as an officer, director or employee of company covered by Analyst and has not been engaged in market making activity
of the company covered by Analyst.
This document is solely for the personal information of the recipient, and must not be singularly used as the basis of any investment
decision. Nothing in this document should be construed as investment or financial advice. Each recipient of this document should
make such investigations as they deem necessary to arrive at an independent evaluation of an investment in the securities of the
companies referred to in this document (including the merits and risks involved), and should consult their own advisors to determine
the merits and risks of such an investment.
Reports based on technical and derivative analysis center on studying charts of a stock's price movement, outstanding positions and
trading volume, as opposed to focusing on a company's fundamentals and, as such, may not match with a report on a company's
fundamentals.
The information in this document has been printed on the basis of publicly available information, internal data and other reliable
sources believed to be true, but we do not represent that it is accurate or complete and it should not be relied on as such, as this
document is for general guidance only. Angel Broking Pvt. Limited or any of its affiliates/ group companies shall not be in any way
responsible for any loss or damage that may arise to any person from any inadvertent error in the information contained in this report.
Angel Broking Pvt. Limited has not independently verified all the information contained within this document. Accordingly, we cannot
testify, nor make any representation or warranty, express or implied, to the accuracy, contents or data contained within this document.
While Angel Broking Pvt. Limited endeavors to update on a reasonable basis the information discussed in this material, there may be
regulatory, compliance, or other reasons that prevent us from doing so.
This document is being supplied to you solely for your information, and its contents, information or data may not be reproduced,
redistributed or passed on, directly or indirectly.
Neither Angel Broking Pvt. Limited, nor its directors, employees or affiliates shall be liable for any loss or damage that may arise from
or in connection with the use of this information.
Note: Please refer to the important ‘Stock Holding Disclosure' report on the Angel website (Research Section). Also, please refer to the
latest update on respective stocks for the disclosure status in respect of those stocks. Angel Broking Pvt. Limited and its affiliates may
have investment positions in the stocks recommended in this report.
Disclosure of Interest Statement
Sadbhav Engg
1. Analyst ownership of the stock
No
2. Angel and its Group companies ownership of the stock
No
3. Angel and its Group companies' Directors ownership of the stock
No
4. Broking relationship with company covered
No
Note: We have not considered any Exposure below ` 1 lakh for Angel, its Group companies and Directors.
Ratings (Based on expected returns
Buy (> 15%)
Accumulate (5% to 15%)
Neutral (-5 to 5%)
over 12 months investment period):
Reduce (-5% to -15%)
Sell (< -15)
May 6, 2016
15