IPO Note | Chemicals
October 27, 2015
S H Kelkar and Company
AVOID
Issue Open: October 28, 2015
IPO Note - Valuation expensive
Issue Close: October 30, 2015
S H Kelkar & Company Ltd (SHKCL) is the largest fragrance and flavour company
Issue Details
in India by revenue, with a market share of approximately 12.0%. The company
has four manufacturing facilities, three of which are located in India and one in
Face Value: `10
The Netherlands, with a total installed manufacturing capacity of over 19,819
Present Eq. Paid up Capital: `133.0cr
tonne annually.
Offer Sale:1.7cr Shares
Established Market Leadership: The company has established brands like SHK,
Cobra and Keva, which enjoy leadership positions in their respective categories
Post Eq. Paid up Capital: `144.6cr
and draw substantial brand equity in India. For the year ended December 31,
Market Lot: 80 Shares
2013, SHKCL had a market share of 12.0% in the Indian fragrance and flavour
(F&F) industry. On bifurcating, the company’s market share stood at 20.5% in the
Fresh Issue (amount): `210cr
fragrance industry and 2.0% in the flavour industry.
Price Band: `173-180
Comprehensive Product Offering and Diverse Customer Base: SHKCL has a wide
Post-issue implied mkt. cap `2,502cr*-
portfolio of offerings with over 9,700 fragrances, ingredients and flavour products
2,603cr**
and a large library of product formulations created over the past 90 years. The
Note:*at Lower price band and **Upper price band
company enjoys a competitive advantage over its peers on the back of its wide
product portfolio. It has a deep understanding of its customers’ requirements and
preferences and has over 4,100 customers, including leading national and
Book Building
multi-national FMCG companies, blenders of fragrances and flavours, and
QIBs
50%
fragrance and flavour producers.
Non-Institutional
15%
Outlook and Valuation: SHKCL is valued at a P/E multiple of 40.4x its FY2015
EPS. In terms of P/BV, the company is valued at 5.1x its pre-IPO and 3.2x its post-
Retail
35%
IPO at the upper end of the price band. In our view, the valuation is expensive,
considering its low ROE numbers (around 12-13%) and considering that they are
expected to continue to remain in the same range. Further, the domestic F&F industry is
Post Issue Shareholding Pattern(%)
not a high growth industry, expected to grow at a subtle rate of 9-10% going forward.
Promoters Group
56.7
The company’s global peers Givaudan S.A. and International Flavors &
MF/Banks/Indian
Fragrances Inc trade at 28.1x and 20.1x their CY2014 earnings, respectively.
FIs/FIIs/Public & Others
43.3
Givaudan S.A. and International Flavors & Fragrances Inc have strong market
shares in the global market of ~21% and ~12%, respectively, and deliver higher
RoEs. On the other hand, SHKCL has negligible market share at the global level.
Thus, SHKCL’s valuation looks expensive vis-a-vis these companies.
Hence, we recommend an “Avoid” on the issue. Investors having conviction in the
long term growth prospects of the company and the emerging consumption story in
India, and wanting to enter the stock to tap this perceived opportunity, could consider
waiting for a possible correction in the stock price post the listing of the IPO.
Key Financials
Y/E March (` cr)
FY2013
FY2014
FY2015E
1QFY16E
Net Sales
666
761
837
222
% chg
16.9
14.3
9.9
-
Net Profit
58
79
64
21
% chg
31.0
46.6
(18.6)
-
OPM (%)
17.7
18.0
14.3
17.3
EPS (`)
4.1
6.0
4.8
1.6
P/E (x)
44.3
30.2
37.2
-
P/BV (x)
5.0
5.0
4.7
-
RoE (%)
12.3
16.4
12.6
Amarjeet S Maurya
EV/Sales (x)
3.7
3.3
3.0
-
+91 22 3935 7800 Ext: 6831
EV/EBITDA (x)
20.8
18.5
21.2
-
Source: Company, Angel Research; Note:*EPS and other valuation parameters is based on Pre IPO
outstanding shares at upper price band
Please refer to important disclosures at the end of this report
1
S H Kelkar and Company | IPO Note
Company background
SHKCL is the largest F&F company in India by revenue, with a market share of
approximately 12.0%. The company initiated business in 1922 as a manufacturer
of industrial perfumes in British India. It now has four manufacturing facilities,
three of which are located in India and one in The Netherlands, with a total
installed manufacturing capacity of over 19,819 tonne annually.
Last year, the company manufactured and supplied over 6,300 fragrances. The
offerings included fragrance ingredients and flavours for the personal and home
care products industry and the food and beverage industry, either in the form of
compounds or individual ingredients. The company has a large and diverse mix of
over 3,500 customers, including leading national and multi-national FMCG
companies, blenders of F&F, and F&F producers.
The flavour products produced by the company are used as a raw material by
producers of baked goods, dairy products, beverages and pharmaceutical
products. The company has over 300 customers for its flavour products and a
dedicated research team of 18 scientists. The research team has developed 12
molecules over the last three years, of which, the company has filed patent
applications for three.
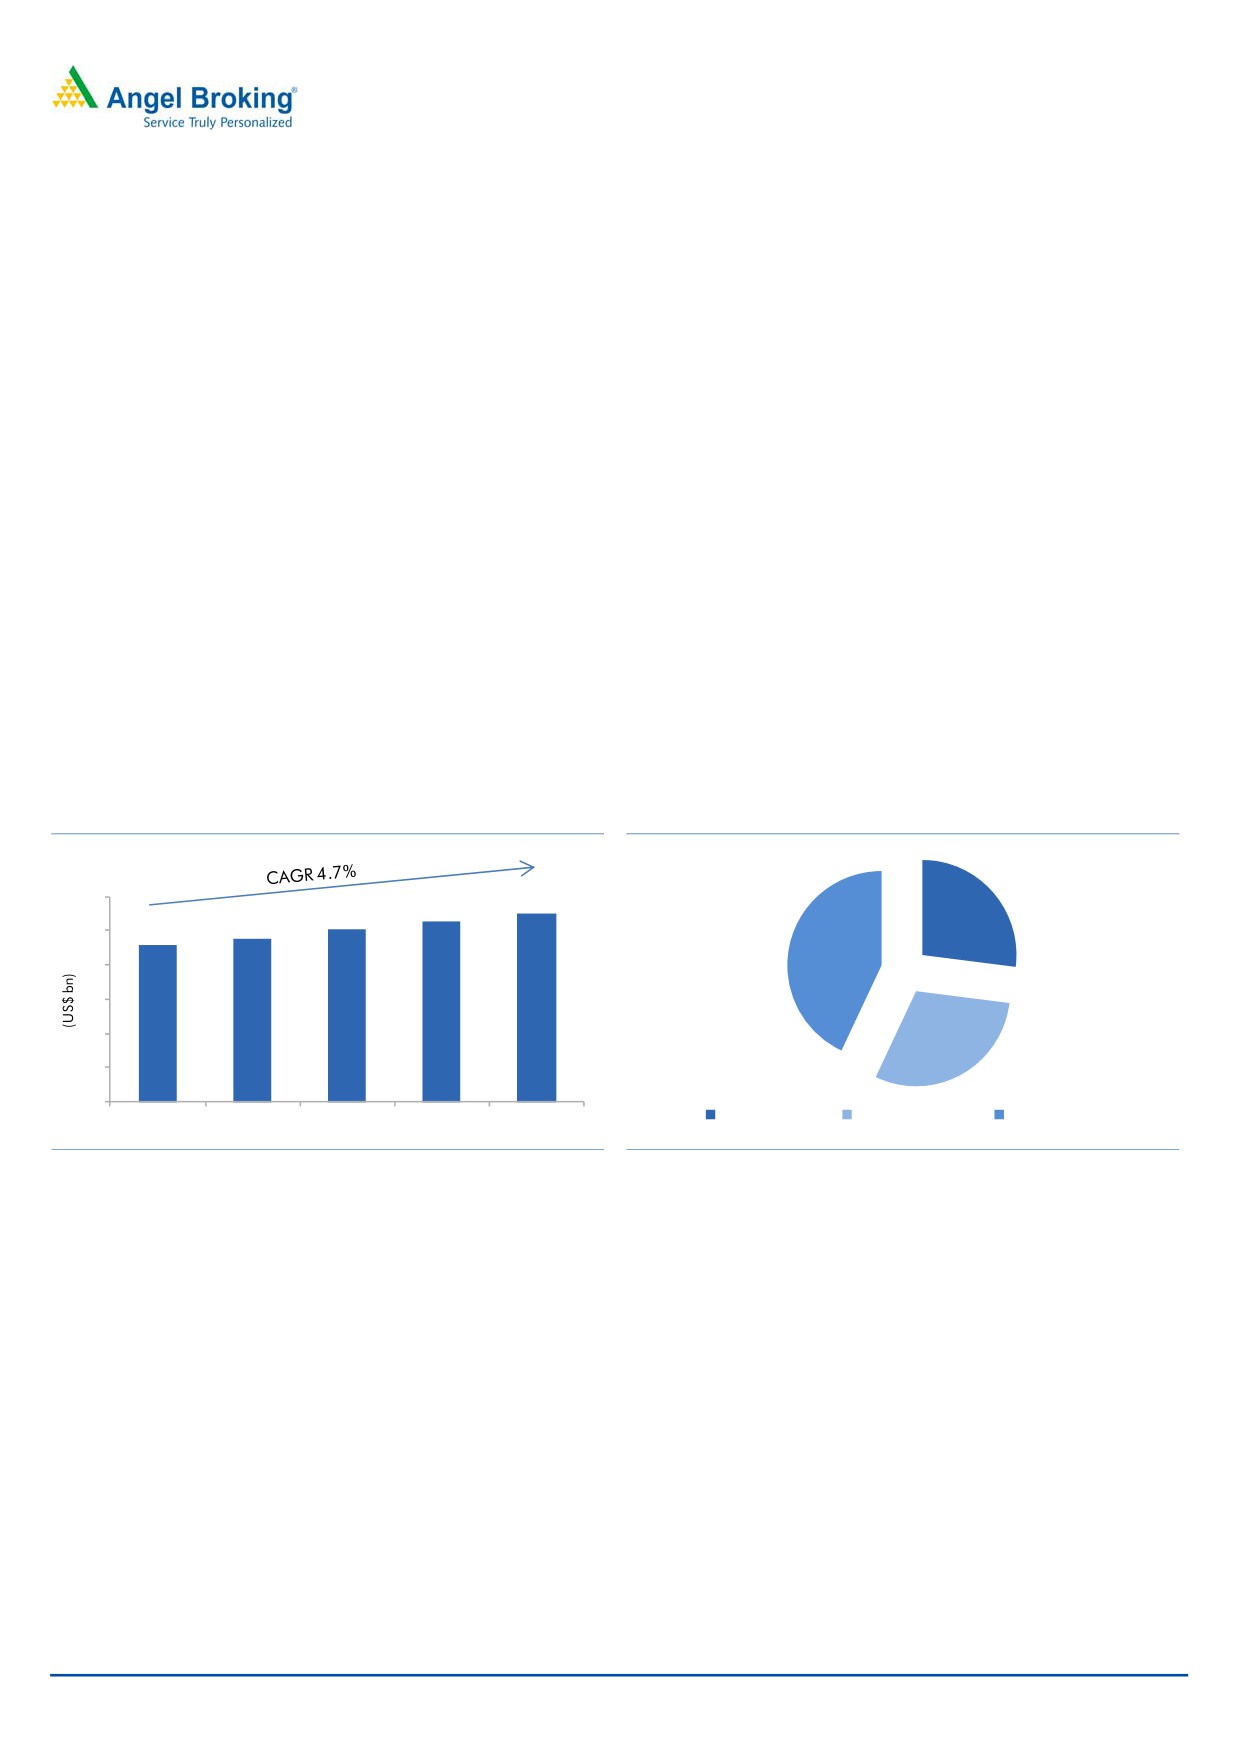
Exhibit 1: Global fragrance and flavour industry
Exhibit 2: Geographic revenue break-up for FY13
30
27.5
26.3
25.2
27%
23.9
25
22.9
43%
20
15
10
30%
5
0
North American
Western European
Rest of the world
CY2012
CY2013
CY2014
CY2015
CY2016
Source: RHP
Source: RHP
October 27, 2015
2
S H Kelkar and Company | IPO Note
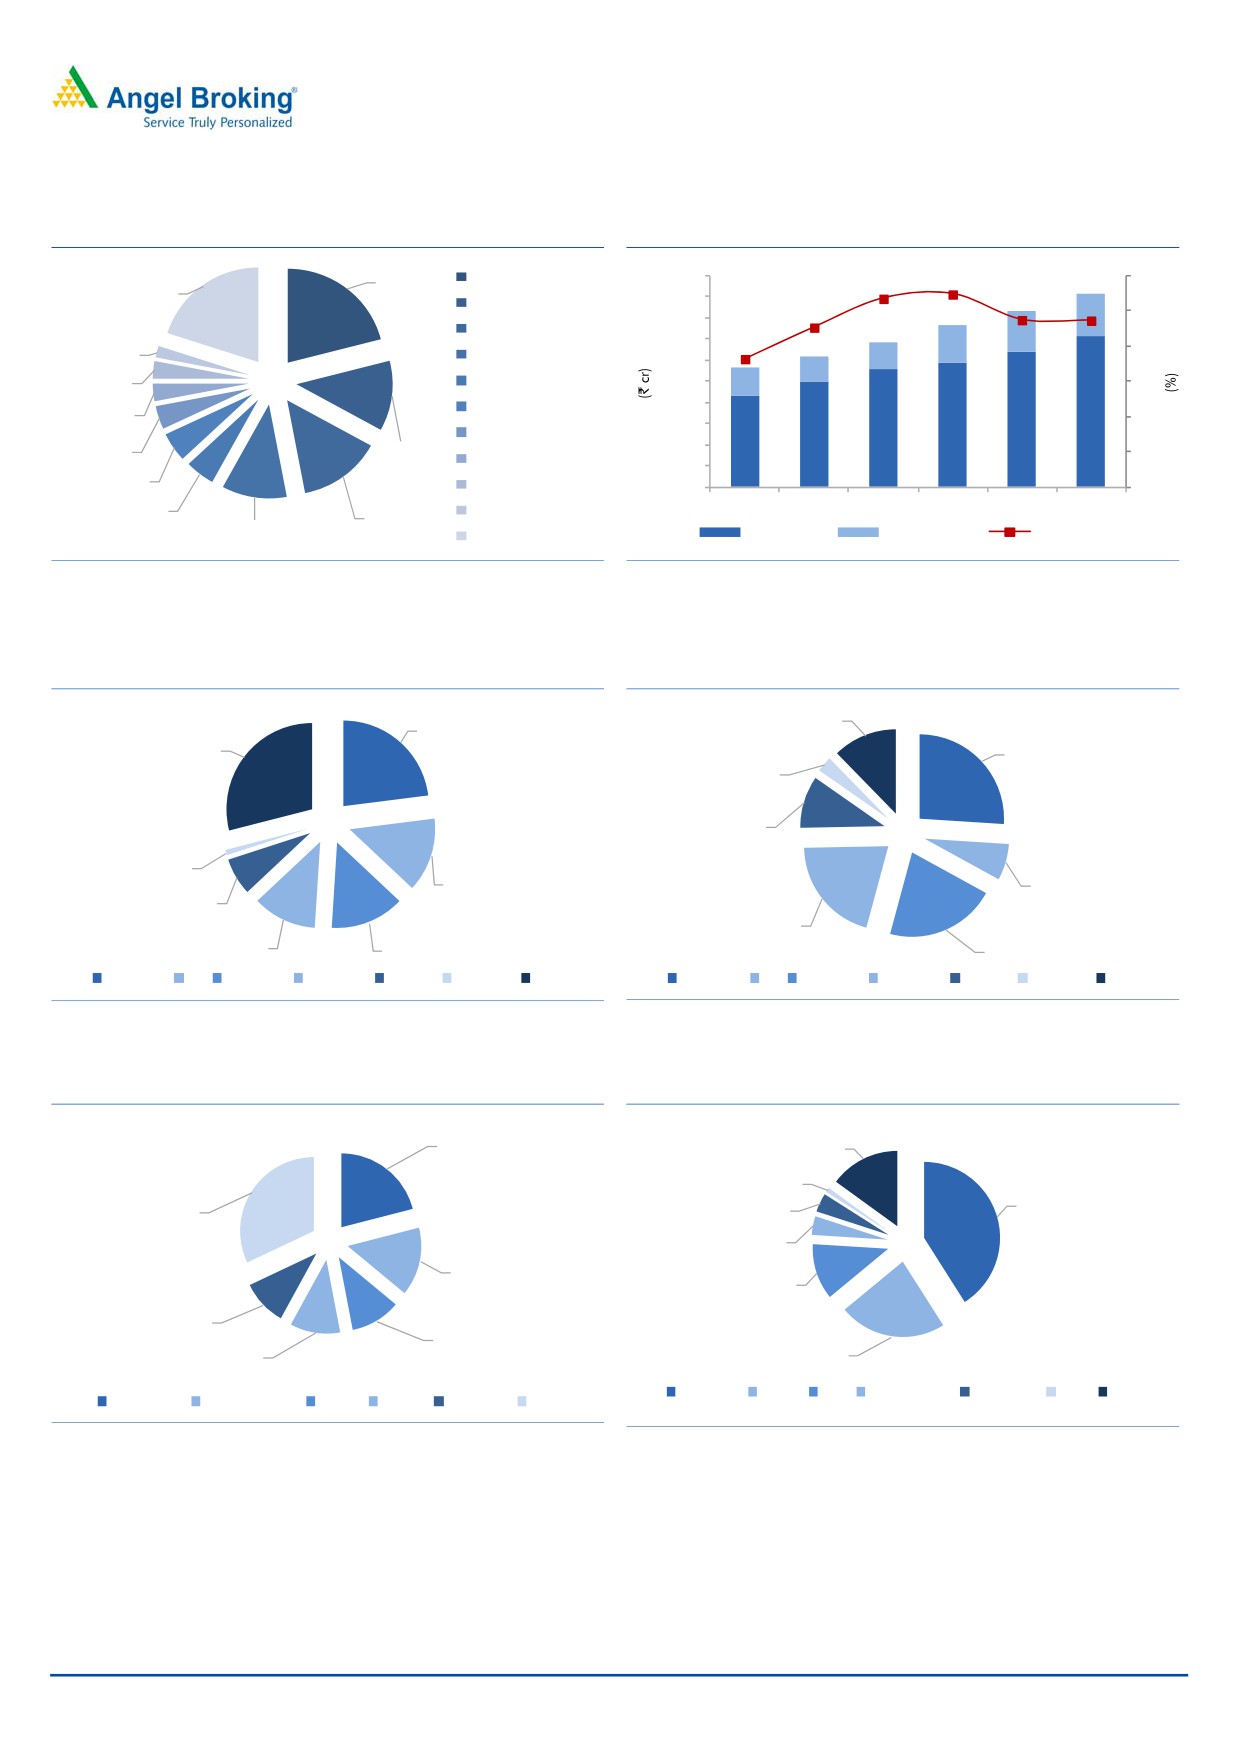
Exhibit 3: Market shares of the top 10 players in the
Exhibit 4: Organised and unorganised Indian
global fragrance and flavour industry
fragrance and flavour industry trend.
21.0%
Givaudan
5,000
10.7
11.0
12
20.0%
4,500
9.5
IFF
9.1
10
4,000
1,014
Firmenich
967
9.5
3,500
7.3
2.0%
879
8
Symrise
654
3,000
601
3.0%
Takasago
2,500
672
6
Wild Flavors
2,000
3.0%
3,548
1,500
3,200
4
Mane SA
2,775
2,926
12.0%
2,496
4.0%
1,000
2,167
Frutarom
2
500
5.0%
Sensient Flavors
-
0
5.0%
Robertet SA
CY2011
CY2012
CY2013
CY2014
CY2015
CY2016
14.0%
11.0%
Organised
Unorganised
yoy growth (%)
Others
Source: RHP
Source: RHP
Exhibit 5: Market share in Indian F&F
industry
Exhibit 6: Market share in Indian Fragrance industry
`34.29bn
`18.8bn
12.3%
23%
29%
26.0%
3.0%
10.0%
1%
14%
7.0%
7%
20.5%
12%
14%
21.2%
Givaudan IFF Firmenich SH Kelkar Symrise Goldfield Others
Givaudan IFF Firmenich SH Kelkar Symrise Goldfield Others
Source: RHP
Source: RHP
Exhibit 7: End user industry for fragrances
Exhibit 8: End user industry for Flavours
21%
15%
1%
41%
32%
4%
4%
15%
12%
10%
11%
11%
23%
Beverages Bakery Oral Confectionery Salty snack Dairy Others
Home care Personal wash Fabric Beauty Hair care
Others
Source: Company, Angel Research
Source: Company, Angel Research
October 27, 2015
3
S H Kelkar and Company | IPO Note
Issue details
The company’s `210cr IPO comprises of a fresh issue/Offer for Sale of upto
1.66cr shares, in which Blackstone PE Fund is selling ~10% share and the
promoter is selling ~2.5% share of the total pre-IPO outstanding shares. Shares
could be subscribed to in the price band of `173-180 (face value of shares: `10/-
each) via the book building route. The fresh issue of shares will constitute ~8% (at
the upper end of the price band) of the post-issue paid-up equity share capital of
the company.
Exhibit 9: Shareholding pattern
Particulars
Pre-Issue
Post-Issue
No. of shares
(%)
No. of shares
(%)
Promoter group
853,52,000
64.2
820,14,414
56.7
Others
476,02,135
35.8
626,06,388
43.3
Total
1329,54,135
100.0
1446,20,802
100.0
Source: Company, Angel Research Note: calculation is based on upper price band
Objects of the Fresh Issue are as below
Repayment/pre-payment in full or in part of certain loans availed by the
company - `126cr
Investment in its subsidiary K.V. Arochem Pvt Ltd (KVA) and for
repayment/prepayment of certain loans availed by KVA in full or in part -
`32cr.
The balance would be utilized towards general corporate purposes.
October 27, 2015
4
S H Kelkar and Company | IPO Note
Key investment rational
Established Market Leadership
The company has established brands like SHK, Cobra and Keva which enjoy
leadership positions in their respective categories, and have substantial brand
equity in India. For the year ended December 31, 2013, SHKCL had a market
share of 12.0% in the Indian F&F industry. For the same period, the company had
a market share of 20.5% in the Indian fragrance industry and 2.0% in the Indian
flavour industry. (Source: “Market Study on Fragrances and Flavours” by Nielsen,
March 22, 2015). The company is the largest domestic fragrance producer in
India, while it also exports fragrance products to over 52 countries.
Comprehensive Product Offering and Diverse Customer Base
SHKCL has a wide product portfolio with over 9,700 fragrances, ingredients and
flavour products and a large library of product formulations created over 90 years.
The company enjoys a competitive advantage over its peers on the back of its wide
product portfolio. It has a deep understanding of its customers’ requirements and
preferences and has over 4,100 customers, including leading national and multi-
national FMCG companies, blenders of fragrances and flavours, and fragrance
and flavour producers. The company enjoys long term relationships with several
customers for its F&F products spanning over 15 years. Its diversified and
comprehensive product portfolio and large customer base, spread across several
countries and customer categories, mitigates concentration risk.
Research and development skills
SHKCL has a strong research & development (R&D) team, which has contributed to
the company’s growth over the past several years. The company currently
employs 18 scientists; over the last three years the R&D team has developed
12 molecules, of which, patent applications have been filed for three
molecules by the company. As in FY2015, the company had 12 perfumers and
2 flavourists in its
5 creation and development centres. The company
developed over 502 new fragrance and flavour compounds during the year,
which it sold commercially.
Experienced Promoters and Management Team
SHKCL is led by a qualified and experienced management team that has the
expertise and vision to manage and grow business. Its Promoters have an
experience of over 50 years in the fragrance industry and of over 15 years in the
flavour industry. Its senior and mid-level management teams are also very
experienced, having worked in large multi-national companies, in the F&F and
FMCG industries, with an average experience of over 20 years. The knowledge
and experience of its Promoters, senior and middle-management, and its team of
R&D personnel and perfumers provides the company a significant competitive
advantage as it seeks to expand in its existing markets and enter new geographic
markets.
October 27, 2015
5
S H Kelkar and Company | IPO Note
Valuation
SHKCL is valued at a P/E multiple of 40.4x its FY2015 EPS. In terms of P/BV, the
company is valued at 5.1x its pre-IPO and 3.2x its post-IPO at the upper end of the
price band. In our view, the valuation is expensive, considering its low ROE numbers
(around 12-13%) and considering that they are expected to continue to remain in the
same range. Further, the domestic F&F industry is not a high growth industry, expected to
grow at a subtle rate of 9-10% going forward.
The company’s global peers Givaudan S.A. and International Flavors &
Fragrances Inc trade at 28.1x and 20.1x their CY2014 earnings, respectively.
Givaudan S.A. and International Flavors & Fragrances Inc have strong market
shares in the global market of ~21% and ~12%, respectively, and deliver higher
RoEs. On the other hand, SHKCL has negligible market share at the global level.
Thus, SHKCL’s valuation looks expensive vis-a-vis these companies.
Hence, we recommend an “Avoid” on the issue. Investors having conviction in the
long term growth prospects of the company and the emerging consumption story in
India, and wanting to enter the stock to tap this perceived opportunity, could consider
waiting for a possible correction in the stock price post the listing of the IPO.
Exhibit 10: Valuation table
Year
Currency
Net Sales
EBITDA
Margin (%)
PAT
PE
ROE
*S H Kelkar & Company
FY2015
` cr
837
119
14.3
64
40.4
12.6
Givaudan S.A.
CY2014
CHF mn
4,404
760
17.3
563
28.1
16.5
International Flavors & Fragrances Inc
CY2014
US$ mn
3,089
601
19.5
449
20.1
29.5
Source: Company, Angel Research, Note: * EPS and other valuation parameters is based on Post IPO outstanding shares at upper price band
Risks to upside
Higher than expected growth in the FMCG industry and launches of strong
brands by the company would be a risk to our recommendation.
Decline in input costs for the company could increase the profitability of the
company.
October 27, 2015
6
S H Kelkar and Company | IPO Note
Consolidated Profit & Loss Statement
Y/E March (` cr)
FY2013
FY2014
FY2015
1QFY16
Total operating income
666
761
837
222
% chg
16.9
14.3
9.9
Total Expenditure
548
624
718
184
Raw Materials Costs
351
399
466
125
Personnel Expenses
89
103
115
26
Others Expenses
108
122
137
33
EBITDA
118
137
119
39
% chg
13.1
16.1
(12.9)
-
(% of Net Sales)
17.7
18.0
14.3
17.3
Depreciation& Amortisation
17
19
29
7
EBIT
101
118
90
31
% chg
15.7
17.4
(23.9)
(% of Net Sales)
15.1
15.5
10.8
14.1
Interest & other Charges
22
18
19
5
Other Income
2
8
23
2
(% of PBT)
1.9
7.2
24.6
6.4
Share in profit of Associates
-
-
-
-
Recurring PBT
80
109
95
28
% chg
(74.0)
34.8
(12.7)
Prior Period & Extraordinary Exp./(Inc.)
(2)
-
-
-
PBT (reported)
83
109
95
28
Tax
24
29
30
8
(% of PBT)
29.3
27.1
32.1
26.7
PAT (reported)
58
79
64
21
Less: Minority interest (MI)
-
-
0
-
PAT after MI (reported)
58
79
64
21
% chg
31.0
46.6
(18.6)
-
(% of Net Sales)
8.8
10.4
7.7
9.3
Basic EPS (`)
4.1
6.0
4.8
1.6
Note: *EPS calculation is based on Pre IPO outstanding shares
October 27, 2015
7
S H Kelkar and Company | IPO Note
Consolidated Balance Sheet
Y/E March (` cr)
FY2013
FY2014
FY2015
1QFY16
SOURCES OF FUNDS
Equity Share Capital
12
14
141
141
Reserves& Surplus
412
467
369
397
Equity Application Money
52
-
-
-
Shareholders Funds
477
481
510
538
Minority Interest
-
-
-
-
Total Loans
133
184
214
176
Deferred Tax Liability
6
6
5
5
Total Liabilities
616
671
728
719
APPLICATION OF FUNDS
Net Block
140
169
196
192
Capital Work-in-Progress
43
50
10
15
Goodwill
71
83
78
83
Investments
41
0
0
0
Current Assets
480
557
650
629
Inventories
225
279
318
308
Sundry Debtors
172
179
195
215
Cash
33
42
76
40
Loans & Advances
47
56
56
60
Other Assets
2
2
5
7
Current liabilities
164
196
216
212
Net Current Assets
316
361
434
417
Deferred Tax Asset
5
8
10
12
Mis. Exp. not written off
-
-
-
-
Total Assets
616
671
728
719
October 27, 2015
8
S H Kelkar and Company | IPO Note
Consolidated Cash Flow Statement
Y/E March (` cr)
FY2013
FY2014
FY2015
1QFY16
Profit before tax
78
109
95
28
Depreciation
17
19
29
7
Change in Working Capital
11
(73)
(38)
(13)
Interest / Dividend (Net)
0
(1)
(0)
(0)
Direct taxes paid
(26)
(34)
(28)
(12)
Others
23
13
5
6
Cash Flow from Operations
103
32
62
16
(Inc.)/ Dec. in Fixed Assets
(26)
(105)
(18)
(6)
(Inc.)/ Dec. in Investments
(8)
41
0
-
Cash Flow from Investing
(33)
(64)
(17)
(6)
Issue of Equity
1
-
-
-
Inc./(Dec.) in loans
(79)
52
32
(41)
Dividend Paid (Incl. Tax)
(11)
-
(18)
-
Interest / Dividend (Net)
28
(16)
(22)
(7)
Cash Flow from Financing
(61)
36
(7)
(48)
Inc./(Dec.) in Cash
9
4
37
(38)
Opening Cash balances
19
29
35
72
Effect of exch. rate changes
0
2
1
1
on cash & bank bal.
Closing Cash balances
29
35
72
36
October 27, 2015
9
S H Kelkar and Company | IPO Note
Key Ratios
Y/E March
FY2013E
FY2014
FY2015
Valuation Ratio (x)
P/E (on FDEPS)
44.3
30.2
37.2
P/CEPS
33.6
24.4
25.6
P/BV
5.0
5.0
4.7
EV/Sales
3.7
3.3
3.0
EV/EBITDA
20.8
18.5
21.2
EV / Total Assets
3.1
2.9
2.7
Per Share Data (`)
EPS (Basic)
4.1
6.0
4.8
EPS (fully diluted)
4.1
6.0
4.8
Cash EPS
5.4
7.4
7.0
Book Value
35.9
36.2
38.4
Returns (%)
ROCE
16.5
17.8
12.4
Angel ROIC (Pre-tax)
18.8
19.0
13.9
ROE
12.3
16.4
12.6
Turnover ratios (x)
Inventory / Sales (days)
123
134
138
Receivables (days)
94
86
85
Payables (days)
40
42
15
WC cycle (ex-cash) (days)
177
178
208
Note:*EPS and other valuation parameters is based on Pre IPO outstanding shares at upper price
band
October 27, 2015
10
S H Kelkar and Company | IPO Note
Research Team Tel: 022 - 39357800
DISCLAIMER
Angel Broking Private Limited (hereinafter referred to as “Angel”) is a registered Member of National Stock Exchange of India Limited,
Bombay Stock Exchange Limited and Metropolitan Stock Exchange of India Limited. It is also registered as a Depository Participant with
CDSL and Portfolio Manager with SEBI. It also has registration with AMFI as a Mutual Fund Distributor. Angel Broking Private Limited is
a registered entity with SEBI for Research Analyst in terms of SEBI (Research Analyst) Regulations, 2014 vide registration number
INH000000164. Angel or its associates has not been debarred/ suspended by SEBI or any other regulatory authority for accessing
/dealing in securities Market. Angel or its associates including its relatives/analyst do not hold any financial interest/beneficial
ownership of more than 1% in the company covered by Analyst. Angel or its associates/analyst has not received any compensation /
managed or co-managed public offering of securities of the company covered by Analyst during the past twelve months. Angel/analyst
has not served as an officer, director or employee of company covered by Analyst and has not been engaged in market making activity
of the company covered by Analyst.
This document is solely for the personal information of the recipient, and must not be singularly used as the basis of any investment
decision. Nothing in this document should be construed as investment or financial advice. Each recipient of this document should
make such investigations as they deem necessary to arrive at an independent evaluation of an investment in the securities of the
companies referred to in this document (including the merits and risks involved), and should consult their own advisors to determine
the merits and risks of such an investment.
Reports based on technical and derivative analysis center on studying charts of a stock's price movement, outstanding positions and
trading volume, as opposed to focusing on a company's fundamentals and, as such, may not match with a report on a company's
fundamentals.
The information in this document has been printed on the basis of publicly available information, internal data and other reliable
sources believed to be true, but we do not represent that it is accurate or complete and it should not be relied on as such, as this
document is for general guidance only. Angel Broking Pvt. Limited or any of its affiliates/ group companies shall not be in any way
responsible for any loss or damage that may arise to any person from any inadvertent error in the information contained in this report.
Angel Broking Pvt. Limited has not independently verified all the information contained within this document. Accordingly, we cannot
testify, nor make any representation or warranty, express or implied, to the accuracy, contents or data contained within this document.
While Angel Broking Pvt. Limited endeavors to update on a reasonable basis the information discussed in this material, there may be
regulatory, compliance, or other reasons that prevent us from doing so.
This document is being supplied to you solely for your information, and its contents, information or data may not be reproduced,
redistributed or passed on, directly or indirectly.
Neither Angel Broking Pvt. Limited, nor its directors, employees or affiliates shall be liable for any loss or damage that may arise from
or in connection with the use of this information.
Note: Please refer to the important ‘Stock Holding Disclosure' report on the Angel website (Research Section). Also, please refer to the
latest update on respective stocks for the disclosure status in respect of those stocks. Angel Broking Pvt. Limited and its affiliates may
have investment positions in the stocks recommended in this report.
October 27, 2015
11