IPO Note | Financials
Oct 24, 2017
SUBSCRIBE
Reliance Nippon Life Asset Management Ltd
sue Open: Oct 25, 2017
Is
Issue Close: Oct 27, 2017
Reliance Nippon Life Asset Management Ltd (RNAM) is the third largest Asset
Management Company (AMC) in terms of quarterly average AUM (QAAUM) with
11.4% market share and is ranked second most profitable AMC. RNAM managed
Issue Details
`3,84,061cr as on August 2017, which includes Mutual Fund (`2,28,329cr),
Face Value: `10
Managed Account
(`1,53,509cr) and offshore funds & advisory mandates
Present Eq. Paid up Capital: `41.5cr
(`2,223cr). It is also the second largest AMC among retail investors (market share
of 13.6%), having 7.01 million investor folios, of which 6.72 million retail folios.
Offer for Sale: **3.67cr Shares
Huge potential for growth (Industry) in Mutual Fund AUM: In the past three years,
Fresh issue: `617cr
equity assets under management for Indian MF industry have increased three-
fold, from ` 2 lakh cr to `7 lakh cr. Overall AUM has nearly doubled from `10
Post Eq. Paid up Capital: `66cr
lakh cr to `20 lakh cr. Moreover, the industry is receiving about `5,000cr per
Issue size (amount): *`1,512cr -
month through SIP (Systematic Investment Plan). We believe that this trend would
**1,542 cr
continue in the coming years owing to (1) Continuation of black money crack
down;
(2) Lower fixed deposit rates;
(3) Increase in awareness;
(4) Low
Price Band: `247 - 252
penetration (AUM/GDP -13% v/s. +50% in developed market).
Lot Size: 59 shares and in multiple
thereafter
Wide distribution network with strong focus on retail investors: RNAM has a pan-
Post-issue implied mkt. cap:
India network of 171 branches, of which 132 branches are located in B15
*`15,116cr - **`15,422cr
(Beyond top 15 Cities) locations. Distributors contributed 54% and Direct 46% of
Promoters holding Pre-Issue: 96%
monthly average AUM on June 2017. Retail contribution to total AAAUM has
increased by 1600bps to 26.5% from FY2013 to FY2017. Its MF AUM has grown
Promoters holding Post-Issue: 86%
at healthy CAGR of 26% over FY2013-17. PAN India presence & superior fund
*Calculated on lower price band
performance would continue to help them to garner big chunk of new flow.
** Calculated on upper price band
Healthy financials to support higher dividend payout: Revenue/EBITDA has grown
Book Building
at healthy CAGR of 21%/28% over FY2013-17. Return on equity (ROE) for
FY2017 was 21.3% and last 5 years average ROE was 20%. For FY2017, RNAM
QIBs
50% of issue
made dividend payout of 61% and it has maintain dividend payout of 55% on an
Non-Institutional
15% of issue
average for last 5 years.
Retail
35% of issue
Outlook & Valuation: At the upper end of the IPO price band it is offered at 37x
its FY2017 EPS and 8x its FY2017 book value (Pre-IPO), demanding `15,442cr
market cap, which is 6.8% of the MF AUM (`2,28,329cr for the month of August
Post Issue Shareholding Patter
2017). Considering that RNAM is the third largest AMC coupled with huge
Promoters
86%
potential of MF industry to grow, strong return ratios, asset light business, higher
dividend payout ratio and track record of superior investment performance, we
Others
14%
are positive on this IPO and rate it as SUBSCRIBE.
Key Financials
Y/E March (` cr)
FY13
FY14
FY15
FY16
FY17
Net Sales
609
676
847
1,200
1,307
% chg
11.0
25.4
41.6
9.0
Net Profit
230
271
354
396
403
% chg
17.5
31.0
11.8
1.6
EBITDA (%)
29
36
43
34
36
EPS (Rs)
4
5
6
7
7
P/E (x)
64
55
42
37
37
P/BV (x)
10
10
10
8
8
Jaikishan J Parmar
ROE (%)
16
17
23
22
21
+022 39357600, Extn: 6810
ROA (%)
15
16
21
21
20
Source: RHP, Angel Research; Note: Valuation ratios based on pre-issue outstanding shares and at upper end of the price band
Please refer to important disclosures at the end of this report
1
Reliance Nippon Life Asset Management Ltd | IPO Note
Company background
Reliance Nippon Life Asset Management Ltd is a joint venture between Reliance
ADAG and Nippon Life of Japan (formerly Reliance Capital Asset Management
Limited). It began mutual fund operations in 1995 as the asset manager for
Reliance Mutual Fund, managed QAAUM of
`2,22,964cr and 7.01 million
investor folios, as of June 30, 2017. It is managing 55 open-ended mutual fund
schemes including 16 ETFs and 174 closed ended schemes for Reliance Mutual
Fund as of June 30, 2017. RNAM has a pan-India network of 171 branches and
approximately 58,000 distributors including banks, financial institutions, national
distributors and independent financial advisors (“IFAs”), as of June 30, 2017.
The company is involved in managing
Mutual Funds (Including EFTs)
Managed account, including portfolio management services (PMS), alternative
investment funds (AIF) and Pension funds
Offshore funds and advisory mandates
Exhibit 1: fund wise information on mutual fund AUM
2015
2016
2017
Q1FY18
% of total
% of total
% of total
% of total
` in Cr
` in Cr
` in Cr
` in Cr
QAAUM
QAAUM
QAAUM
QAAUM
Debt
5,74,936
46
70,151
46
93,888
50
1,02,840
46
Equity
3,59,510
29
48,981
32
53,360
28
64,410
29
Debt - Liquid
2,90,011
23
32,299
21
36,216
19
41,564
19
Gold
17,232
1
1,369
1
1,953
1
2,674
1
ETF
3,379
0.3
453
0.3
3,744
2
11,475
5
12,45,068
100
1,53,251
100
1,89,161
100
2,22,964
100
Source: RHP
Oct 24, 2017
2
Reliance Nippon Life Asset Management Ltd | IPO Note
Issue details
The IPO of Reliance Nippon Life AMC, a joint venture of Reliance group (ADAG)
and Japan’s Nippon Life, aims to raise `1,542cr through mix of Offer for sale and
fresh issue. The issue would constitute fresh issue worth of `617cr and Offer for
sale worth of `925cr. The company would divest 10% of its shareholding. While
Nippon Life would divest 5%, Reliance Capital will divest 1.5%, the balance being
issue of fresh shares.
Exhibit 2: Exhibit 2: Pre and Post-IPO shareholding pattern
No of shares
No of shares
%
%
(Pre-issue)
(Post-issue)
Promoter
56,15,10,000
96
52,47,90,000
86
Investor/Public
2,60,10,000
4
8,72,10,000
14
58,75,20,000
100
61,20,00,000
100
Source: RHP, Note: Calculated on upper price band
Objects of the offer
Setting up new branches and relocating certain existing branches (`38.3cr)
Upgrading the IT system (`40.6cr)
Advertising, marketing and brand building activities (`72cr)
Lending to our Subsidiary (Reliance AIF) for investment as continuing interest in
the new AIF schemes managed by Reliance AIF (`125cr)
Investing towards our continuing interest in new mutual fund schemes
managed by us (`100)
Funding inorganic growth and other strategic initiatives (`165)
Meeting expenses towards general corporate purposes
Key Management
Mr. Sundeep Sikka, is an Executive Director and Chief Executive Officer of the
Company (a nominee of Reliance Capital). He holds a Master’s degree in
Business Administration from the University of Pune. Prior to joining the
Company, he had also worked with ICICI Bank Ltd for more than four years.
Mr. Prateek Jain is the Chief Financial Officer of the Company. He cleared the
final examinations held by ICWAI in 1994 and by ICAI and ICSI in 1996. He
has, in the past, also worked with Pine Bridge Investments Asset Management
Company Private Ltd as CFO & Head - Risk Management.
Mr. Manish Gunwani is the CIO - Equity Investments of the Company. He has
been associated with the Company since September 5, 2017. He holds a
bachelor’s degree in technology from IIT, Madras and a post-graduate
diploma in management from IIM, Bangalore. Prior to joining the Company,
he had also worked with ICICI Prudential Asset Management Company
Limited.
Oct 24, 2017
3
Reliance Nippon Life Asset Management Ltd | IPO Note
Investment Rationale
Huge potential for growth in (Industry) MF AUM: In the past three years, equity
assets under management (AUM) for the Indian MF industry have increased three-
fold from `2 lakh cr to `7 lakh cr. Overall AUM has nearly doubled from `10 lakh
cr to ` 20 lakh cr. The AUM has grown from ₹3.26 lakh cr as on 31st March,
2007 to ₹20 lakh cr as on 30th September, 2017, more than six-fold increase in a
span of about 10 and half years. Moreover, the industry is receiving about
`5,000cr per month through SIP (Systematic Investment plan).
We believe this trend would continue in the coming years owing to
(1)
Continuation of black money crack down; (2) Lower fixed deposit rate; (3) Increase
in awareness; (4) Low penetration (AUM/GDP -13% V/s +50% in developed
market).
Exhibit 3: Trend in AUM/GDP across economies
Equity AUM to GDP
Debt AUM to GDP
Total AUM/GDP
Australia
51
85
136
USA
66
38
104
Germany
35
24
59
Brazil
14
42
56
Global
30
25
55
UK
29
25
54
South Africa
12
34
46
India
7
3
10
Source: RHP,FY16 Data
Mutual Fund industry in India still has very huge potential to grow. Mutual fund’s
AUM/GDP in the US is around 104%, 59% in Germany, above 55% in Brazil,
while in India it is still around 11%. Despite the increase, the share of mutual fund
savings continues to remain a small proportion. As on FY2016, mutual fund as %
of net financial savings was just 2.94%. This clearly indicates the penetration level
is very low.
Exhibit 4: Mutual fund penetration
3.5
41.5
45
36.5
36.1
40
3
32.9
31.1
35
2.94
2.5
30
2
1.8
25
1.53
1.32
20
1.5
1.12
15
1
10
0.5
5
0
0
FY12
FY13
FY14
FY15
FY16
Mutual Fund % of Net Financial Saving
Net Fiancial Saving % as house hold saving
Source: RHP
Oct 24, 2017
4
Reliance Nippon Life Asset Management Ltd | IPO Note
Wide distribution network with strong focus on retail investors: RNAM has a pan-
India network of 171 branches, of which 132 branches are located in B15
locations. Distributors contributed 54% and Direct 46% of monthly average AUM
on June 2017. Retail contribution to total AAAUM has increased by 1600bps to
26.5% from FY2013 to FY2017. Its MF AUM has grown at healthy CAGR of 26%
over FY2013-17. PAN India presence & superior fund performance would continue
to garner big chunk of new flow.
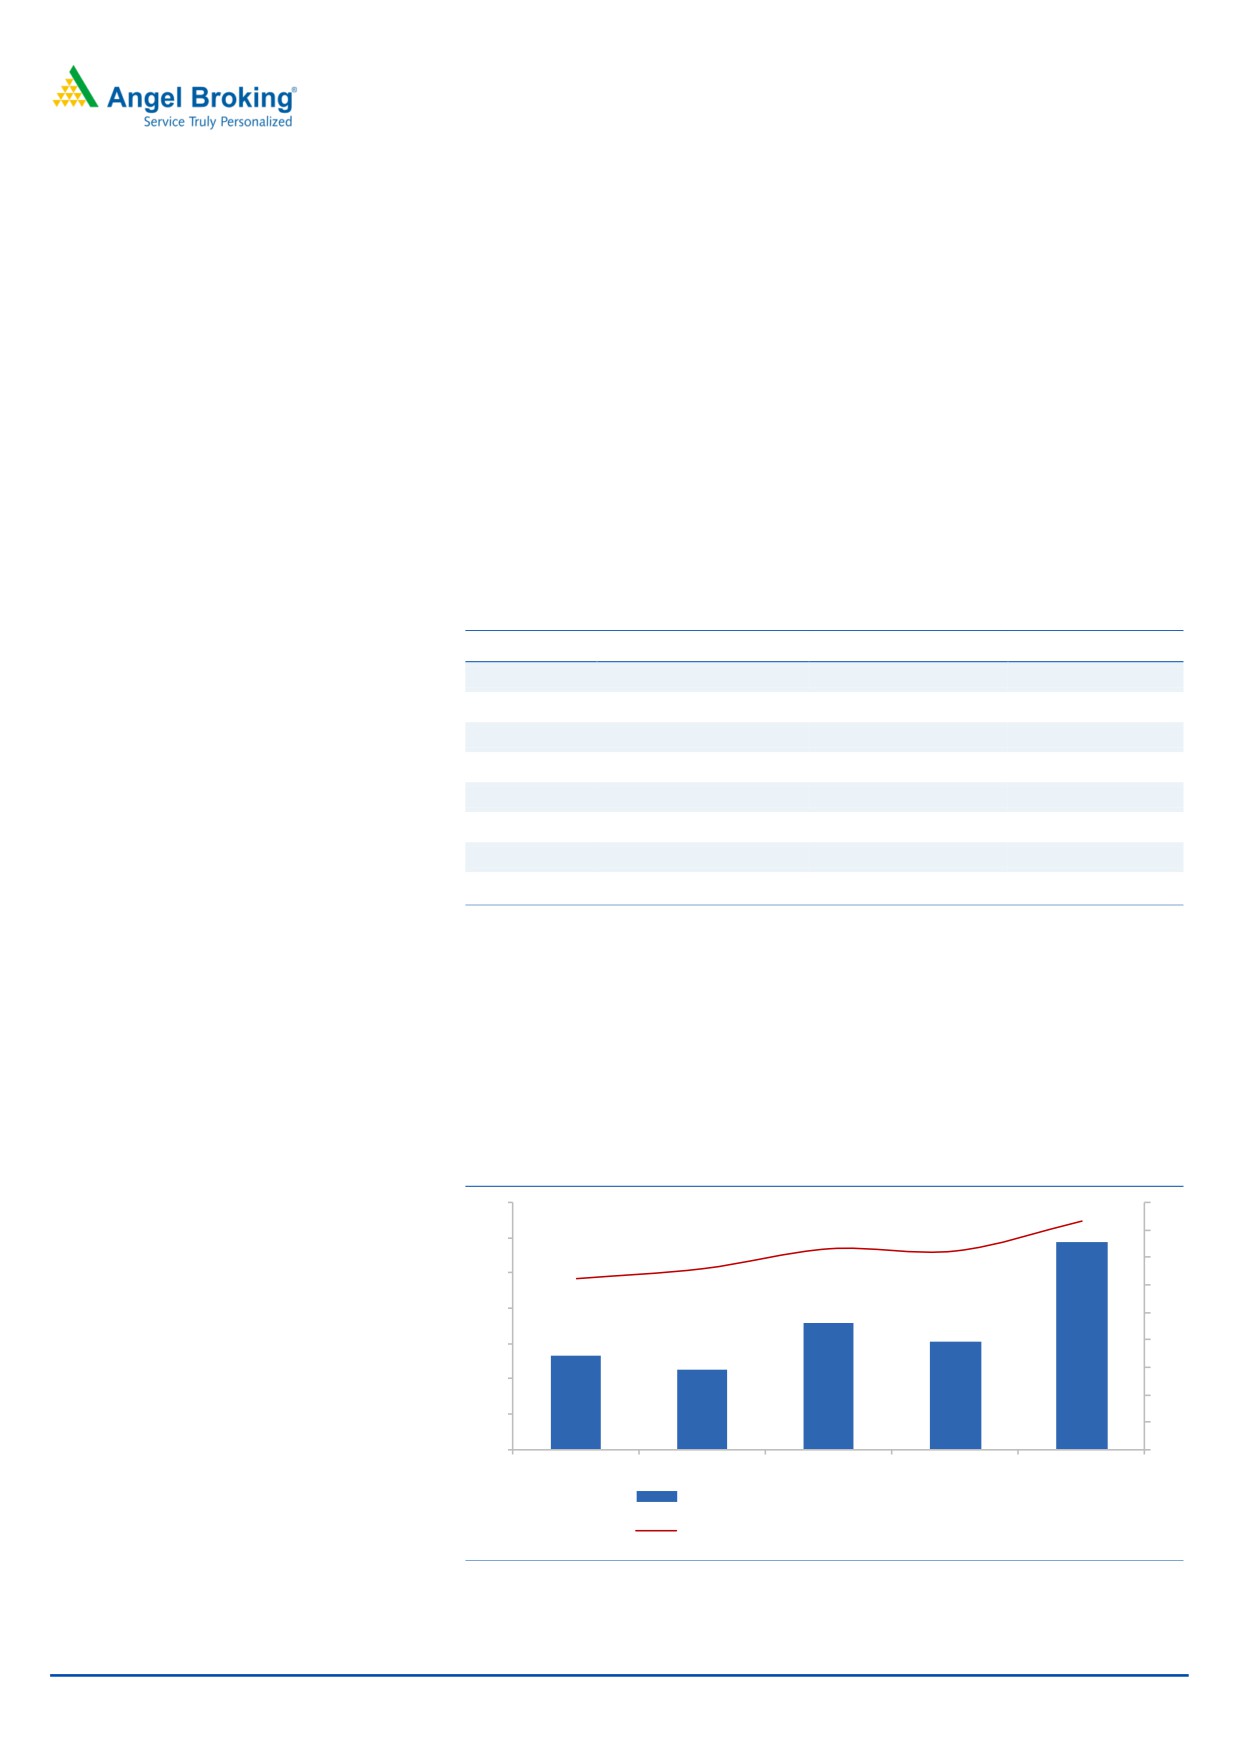
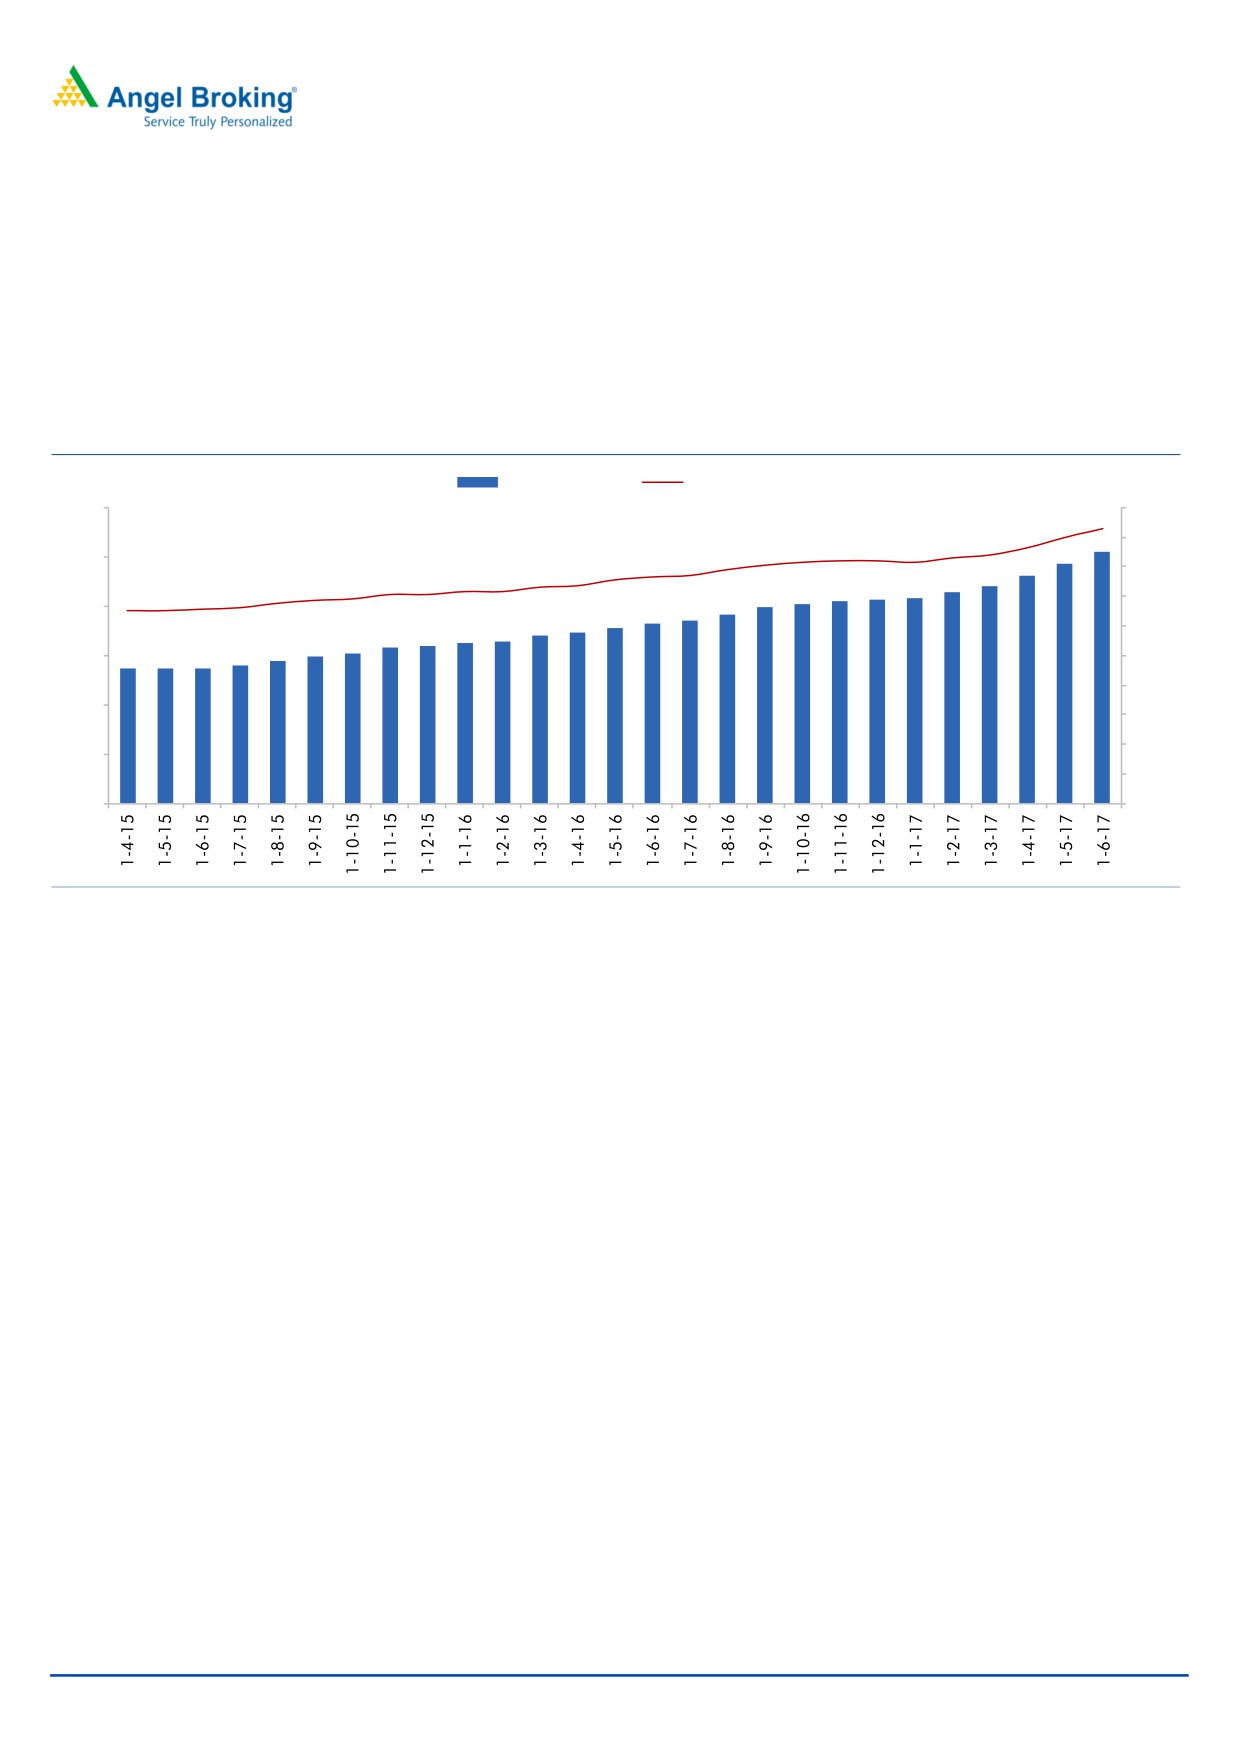
Exhibit 5: RNAM’s growing SIP Book
SIP Book (in bn)
SIP Count (mn)
6.0
1.9
2.0
1.8
1.7
1.6
1.6
1.6
1.6
1.7
1.7
1.8
1.6
1.6
4.9
5.1
5.0
1.5
1.5
1.5
4.6
1.5
1.5
1.4
1.4
1.4
1.4
4.4
1.6
1.4
1.4
4.3
1.4
4.1
4.1
4.2
1.3
1.3
1.3
1.3
4.0
4.0
3.8
1.4
4.0
3.6
3.7
3.5
3.6
3.2
3.3
3.3
3.4
1.2
3.0
3.1
2.9
3.0
2.7
2.7
2.7
2.8
3.0
1.0
0.8
2.0
0.6
0.4
1.0
0.2
-
-
Source: RHP
SIP Highlights
RNAM is sourcing INR 5.1 Bn of monthly flow through 1.86 mn SIP accounts
(as of Jun‟17)
In the last 2 years:
Total SIP count and monthly inflow have increased by
43% and 86%
respectively
Incremental (New) SIP count has doubled and New SIP Book amount (inflow)
has almost tripled (3x)
Average Ticket Size has increased from ~INR 2,102 (June 2015) to INR 2,745
(June 2017)
As of June 30, 2017, 77% of new SIPs have a tenure of over 5 years
High tenure implies continuity and sustainability in inflows
Oct 24, 2017
5
Reliance Nippon Life Asset Management Ltd | IPO Note
Robust Investment Process
The company has very strong team consisting of 28 senior members having an
average investment management experience of approximately 19 years. Equity
team is headed by Mr. Manish Gunwani and Debt team is headed by Mr. Amit
Tripathi. Reliance growth fund/ Reliance equity opportunity fund has given stellar
return of 23.75%/18.82% since inception.
Exhibit 6: Investment (Equity Scheme) performance
Compounded Annual Yield Period Ended August 31, 2017 (%)
MAAUM as
of August
Equity Funds
Since Inception
1 year
3 Years
5 years
31, 2017
(` in cr)
Reliance Equity Opportunities
9,715
18.82
12.33
10.56
17.7
S&P BSE 100
14
14.34
8.76
14.45
S&P BSE Sensex
13.58
11.52
5.98
12.72
Reliance Tax Saver (ELSS)
8,914
16.24
20.58
14.95
23.43
S&P BSE 100
12.17
14.34
8.76
14.45
S&P BSE Sensex
11.67
11.52
5.98
12.72
Reliance Regular Savings Fund (Balanced)
8,159
14.53
17.95
14.25
18.35
S&P BSE Sensex
13.33
11.52
5.98
12.72
Reliance Growth Fund
6,538
23.75
18.91
16.78
20.5
S&P BSE Sensex
10.4
11.52
5.98
12.72
Reliance Top 200 Fund*
4,148
11.6
17.47
13.49
19.15
S&P BSE 200
8.71
15.02
10.22
15.32
S&P BSE Sensex
7.51
11.52
5.98
12.72
Source: RHP
Growth Strategy
For next stage of growth, apart from MF, the company is developing alternative
investment fund and is open for inorganic growth through strategic acquisitions.
Reliance AIF launched its first AIF in 2014 and is currently managing six schemes
of which, four are closed for subscription. As of June 30, 2017, Reliance AIF was
raising funds in three alternative investment schemes across asset classes in
categories including long only equity, sector agnostic credit and high yield real
estate structured debt. The total capital commitment raised across these schemes
as of June 30, 2017 was `13,36.7cr. Reliance AIF intends to introduce and launch
various offerings to capitalize on market opportunities.
Reliance AIF intends to launch 6 to 10 new schemes (Category II and Category III)
over the next three financial years (“Proposed Schemes”) and utilize `1,25cr from
the net proceeds towards such continuing interest at or above the minimum level
prescribed by law for the Proposed Schemes.
Oct 24, 2017
6
Reliance Nippon Life Asset Management Ltd | IPO Note
Healthy financials to support higher dividend payout: Revenue/EBITDA has grown
at healthy CAGR of 21%/28% over FY2013-17. Return on equity (ROE) for FY2017
was 21.3% and last 5 years average ROE was 20%. For FY2017, RNAM had made
dividend payout of 61% and it has maintained dividend payout of 55% on an
average for last 5 years.
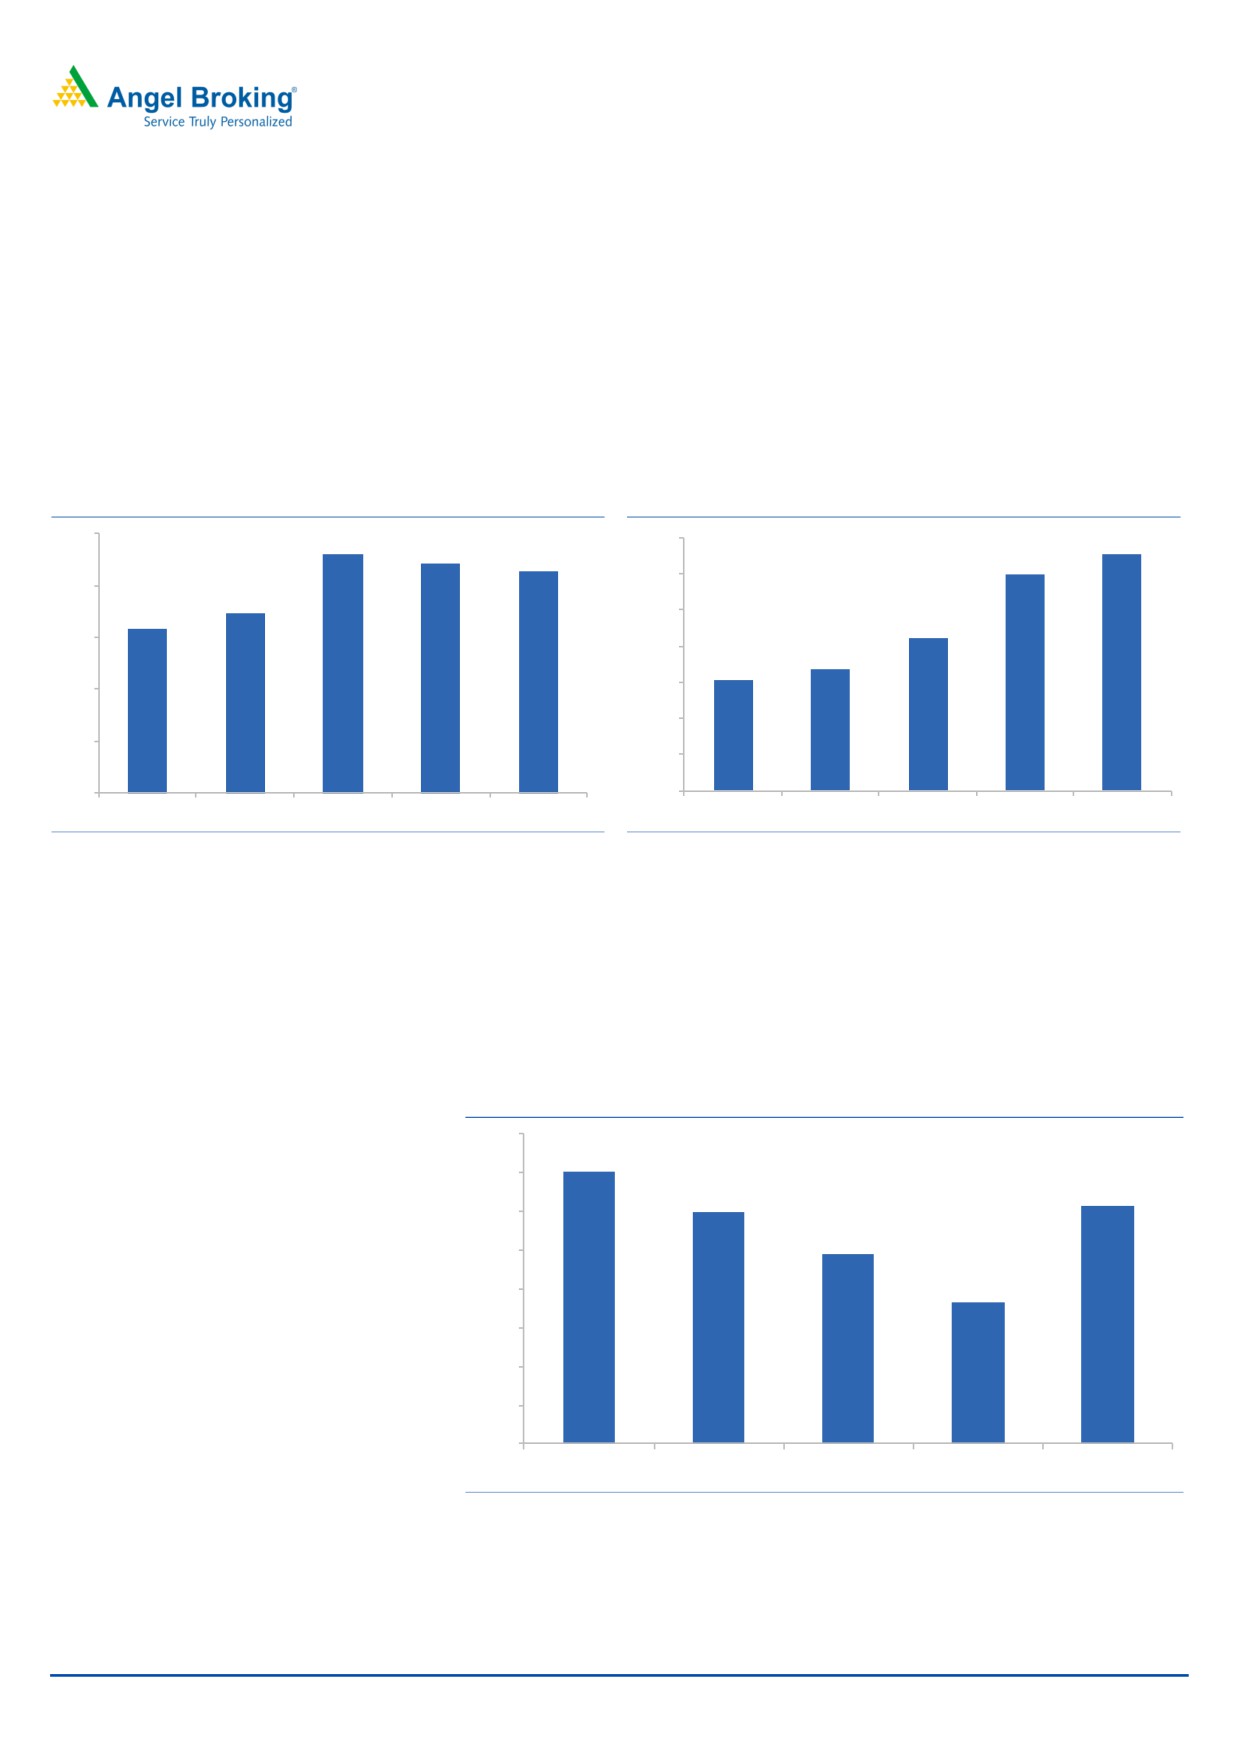
Exhibit 7: ROE trend (%)
Exhibit 8: Revenue trend (`in cr)
25
1400
1307
23
22
21
1200
1200
20
17
16
1000
847
15
800
676
609
600
10
400
5
200
-
0
FY13
FY14
FY15
FY16
FY17
FY13
FY14
FY15
FY16
FY17
Source: RHP
Source: RHP
At upper end of the IPO price band dividend yield is 1.7%. We believe RNAM
would continue to maintain higher dividend payout ratio. As AMC business is
capital light business and company is debt free, so company would remain with
healthy free cash flow to distribute as dividend to the shareholder of the company.
Exhibit 9: History of dividend payout ratio (%)
80%
70%
70%
61%
60%
60%
49%
50%
40%
36%
30%
20%
10%
0%
FY13
FY14
FY15
FY16
FY17
Source: RHP
Oct 24, 2017
7
Reliance Nippon Life Asset Management Ltd | IPO Note
Outlook & Valuation: At the upper end of the IPO price band it is offered at 37x its
FY2017 EPS and 8x its FY2017 book value (Pre-IPO), demanding `15,442cr
market cap, which is 6.8% of the MF AUM (`2,28,329cr for the month of August
2017). Considering that RNAM is the third largest AMC coupled with huge
potential of MF industry to grow, strong return ratios, asset light business, higher
dividend payout ratio and track record of superior investment performance, we are
positive on this IPO and rate it as SUBSCRIBE.
Key Risk
Overall underperformance of investment would adversely affect new
investment flow and could lead to redemption of exiting investment.
Correction in the stock market would impact revenue and profitability of the
company.
Any step taken by SEBI to further reduce management fees would impact
revenue very sharply.
Oct 24, 2017
8
Reliance Nippon Life Asset Management Ltd | IPO Note
Income Statement
Y/E March (` cr)
FY13
FY14
FY15
FY16
FY17
Revenues from Operations
609
676
847
1200
1307
- YoY Growth (%)
11.0
25.4
41.6
9.0
Employee Expenses
160
151
161
192
196
- YoY Growth (%)
-5.6
6.7
19.2
1.8
Other Expenses
273
283
323
595
641
- YoY Growth (%)
3.9
14.0
84.1
7.8
Total Expenses
433
435
484
787
837
- YoY Growth (%)
0.4
11.4
62.5
6.3
EBITDA
176
241
363
413
471
- YoY Growth (%)
37.1
50.4
13.8
14.0
Depreciation
9
14
7
4
18
- YoY Growth (%)
68.0
(52)
(37)
316
Other Income
126
103
108
114
128
- YoY Growth (%)
-18.3
4.9
5.4
12.9
Profit Before Tax
293
330
464
522
581
- YoY Growth (%)
12.5
40.6
12.6
11.3
Exceptional Items
0.0
0.0
0.0
0.0
0.0
PBT After Exceptional Item
293
330
464
522
581
Prov. for Taxation
62.8
59.1
109.4
126.0
178.6
- as a % of PBT
PAT
230
271
354
396
403
- YoY Growth (%)
17.5
31.0
11.8
1.6
Balance sheet
Y/E March (` cr)
FY13
FY14
FY15
FY16
FY17
Share Capital
11
11
41
42
42
Reserve & Surplus
1446
1543
1495
1750
1851
Net Worth
1458
1554
1536
1792
1893
Minority Interest
3.8
3.8
8.9
8.9
0.0
Other Long Term Liabilities
2.9
2.5
3.3
7.5
11.6
Total Current Liabilities
96.6
148.5
153.4
122.5
147.1
Total Liabilities
1561
1709
1702
1931
2051
Total Fixed Assets
16.3
11.6
4.4
8.5
8.7
Total Non Current Assets
796
141
317
398
402
Investments
308
289
403
527
589
Cash & Cash equivalents
55.2
65.2
60.2
79.5
39.7
Other Current Assets
385.0
1202.9
917.5
917.7
1011.0
Total Assets
1561
1709
1702
1931
2051
Growth YoY
9.5%
-0.4%
13.5%
6.2%
Oct 24, 2017
9
Reliance Nippon Life Asset Management Ltd | IPO Note
Cash Flow Statement
Y/E March (` cr)
FY13
FY14
FY15
FY16
FY17
Profit before tax
293
330
464
522
581
Depreciation
9
14
7
4
18
Change in Working Capital
107
256
57
361
715
Interest / Dividend (Net)
(86)
(72)
(70)
(41)
(70)
Direct taxes paid
(59)
(79)
(99)
(143)
(158)
Others
216
272
401
485
529
Cash Flow from Operations
48
177
(42)
218
556
(Inc.)/ Dec. in Fixed Assets
(8)
(3)
(5)
(9)
(257)
(Inc.)/ Dec. in Investments
173
17
449
(19)
(37)
Cash Flow from Investing
164
14
445
(28)
(294)
Issue of Equity
-
(0)
-
-
-
Inc./(Dec.) in loans
-
-
-
-
-
Others
(187)
(189)
(404)
(174)
(300)
Cash Flow from Financing
(187)
(189)
(404)
(174)
(300)
Effect of exchange fluctuation
5
7
(3)
3
(2)
Inc./(Dec.) in Cash
30
10
(5)
19
(40)
Opening Cash balances
25
55
65
60
79
Closing Cash balances
55
65
60
79
40
Key Ratio
Y/E March (` cr)
FY13
FY14
FY15
FY16
FY17
Per Share Data
EPS
3.9
4.6
6.0
6.7
6.9
BVPS
24.8
26.5
26.1
30.5
32.2
DPS
2.7
2.7
2.9
2.5
4.2
Valuation Ratio (x)
P/E
64.4
54.8
41.8
37.4
36.8
P/BV
10.2
9.5
9.6
8.3
7.8
EV/EBITDA
83.9
60.6
40.0
34.9
30.7
EV/Sales
24.3
21.6
17.1
12.0
11.0
Dividend Yield (%)
1.1
1.1
1.2
1.0
1.7
Profitability Ratios (%)
ROE
15.8
17.4
23.1
22.1
21.3
ROA
14.7
15.8
20.8
20.5
19.6
PAT/AAUM
0.25
0.26
0.25
0.25
0.19
EBITDA
28.9
35.7
42.8
34.4
36.0
PAT
37.9
40.0
41.8
33.0
30.8
Source: RHP, Note: ratios are Calculated on upper price band
Oct 24, 2017
10
Reliance Nippon Life Asset Management Ltd | IPO Note
Research Team Tel: 022 - 39357800
DISCLAIMER
Angel Broking Private Limited (hereinafter referred to as “Angel”) is a registered Member of National Stock Exchange of India Limited,
Bombay Stock Exchange Limited and Metropolitan Stock Exchange Limited. It is also registered as a Depository Participant with CDSL
and Portfolio Manager and investment advisor with SEBI. It also has registration with AMFI as a Mutual Fund Distributor. Angel Broking
Private Limited is a registered entity with SEBI for Research Analyst in terms of SEBI (Research Analyst) Regulations, 2014 vide
registration number INH000000164. Angel or its associates has not been debarred/ suspended by SEBI or any other regulatory
authority for accessing /dealing in securities Market. Angel or its associates/analyst has not received any compensation / managed or
co-managed public offering of securities of the company covered by Analyst during the past twelve months.
This document is solely for the personal information of the recipient, and must not be singularly used as the basis of any investment
decision. Nothing in this document should be construed as investment or financial advice. Each recipient of this document should
make such investigations as they deem necessary to arrive at an independent evaluation of an investment in the securities of the
companies referred to in this document (including the merits and risks involved), and should consult their own advisors to determine
the merits and risks of such an investment.
Reports based on technical and derivative analysis center on studying charts of a stock's price movement, outstanding positions and
trading volume, as opposed to focusing on a company's fundamentals and, as such, may not match with a report on a company's
fundamentals. Investors are advised to refer the Fundamental and Technical Research Reports available on our website to evaluate the
contrary view, if any.
The information in this document has been printed on the basis of publicly available information, internal data and other reliable
sources believed to be true, but we do not represent that it is accurate or complete and it should not be relied on as such, as this
document is for general guidance only. Angel Broking Pvt. Limited or any of its affiliates/ group companies shall not be in any way
responsible for any loss or damage that may arise to any person from any inadvertent error in the information contained in this report.
Angel Broking Pvt. Limited has not independently verified all the information contained within this document. Accordingly, we cannot
testify, nor make any representation or warranty, express or implied, to the accuracy, contents or data contained within this document.
While Angel Broking Pvt. Limited endeavors to update on a reasonable basis the information discussed in this material, there may be
regulatory, compliance, or other reasons that prevent us from doing so.
This document is being supplied to you solely for your information, and its contents, information or data may not be reproduced,
redistributed or passed on, directly or indirectly.
Neither Angel Broking Pvt. Limited, nor its directors, employees or affiliates shall be liable for any loss or damage that may arise from
or in connection with the use of this information.
Oct 24, 2017
11