2QFY2016 Result Update | Agrichemical
November 4, 2015
Rallis India
NEUTRAL
CMP
`206
Performance Highlights
Target Price
-
Y/E March (` cr)
2QFY2016 1QFY2016
% chg (qoq) 2QFY2015
% chg (yoy)
Investment Period
-
Net sales
500
464
7.8
636
(21.4)
Other income
5
6
(19.6)
7
(31.3)
Stock Info
Gross profit
233
243
(4.1)
245
(4.8)
Sector
Agrichemical
Operating profit
95
52
82.7
116
(18.4)
Market Cap (` cr)
4,010
Adj. Net profit
57
33
73.1
73
(22.0)
Net debt (` cr)
126
Source: Company, Angel Research
Beta
0.8
Rallis India (Rallis) posted disappointing results for 2QFY2016. Sales for the
52 Week High / Low
299/201
quarter came in at `499.7cr V/s `635.9cr in 2QFY2015, a dip of 21.4% yoy.
Avg. Daily Volume
47,701
Sales were adversely impacted due to poor monsoon in India, while the
Face Value (`)
1
international market also faced pressure with Brazil (a key market for the
BSE Sensex
26,591
company) witnessing a severe drought. In USA, low crop commodity prices
Nifty
8,061
along with higher inventory prices impacted consumption. On the operating
Reuters Code
RALL.BO
front, the gross margins came in at 46.7% V/s 38.5% in 2QFY2015, which lead
Bloomberg Code
RALI@IN
the OPM to come in at 18.9% V/s 18.2% in 2QFY2015. The PAT came in at
`57cr V/s `73cr in 2QFY2015, a yoy dip of 22.0%. We remain Neutral on the
stock.
Shareholding Pattern (%)
Promoters
50.1
Disappointing sales: For 2QFY2016, sales came in at `499.7cr V/s `635.9cr in
MF / Banks / Indian Fls
14.5
in 2QFY2015, a dip of 21.4% yoy. Sales were adversely impacted due to poor
FII / NRIs / OCBs
13.6
monsoon in India, while the international market also faced pressure with Brazil
(a key market for the company) witnessing a severe drought. In USA, low crop
Indian Public / Others
21.7
commodity prices along with higher inventory prices impacted consumption. On
the operating front, the gross margins came in at 46.7% V/s 38.5% in
Abs. (%)
3m 1yr 3yr
2QFY2015, which lead the OPM to come in at 18.9% V/s 18.2% in 2QFY2015.
Sensex
(5.7)
(4.6)
41.8
The PAT came in at `57cr V/s `73cr in 2QFY2015, a yoy dip of 22.0%.
Rallis India
(3.4)
(9.9)
46.0
Outlook and valuation: The Management is confident about the long-term
prospects of the agrochemicals industry. We expect Rallis to register a CAGR of
15.1% and 16.7% in net sales and profit, respectively, over FY2015-17E. At the
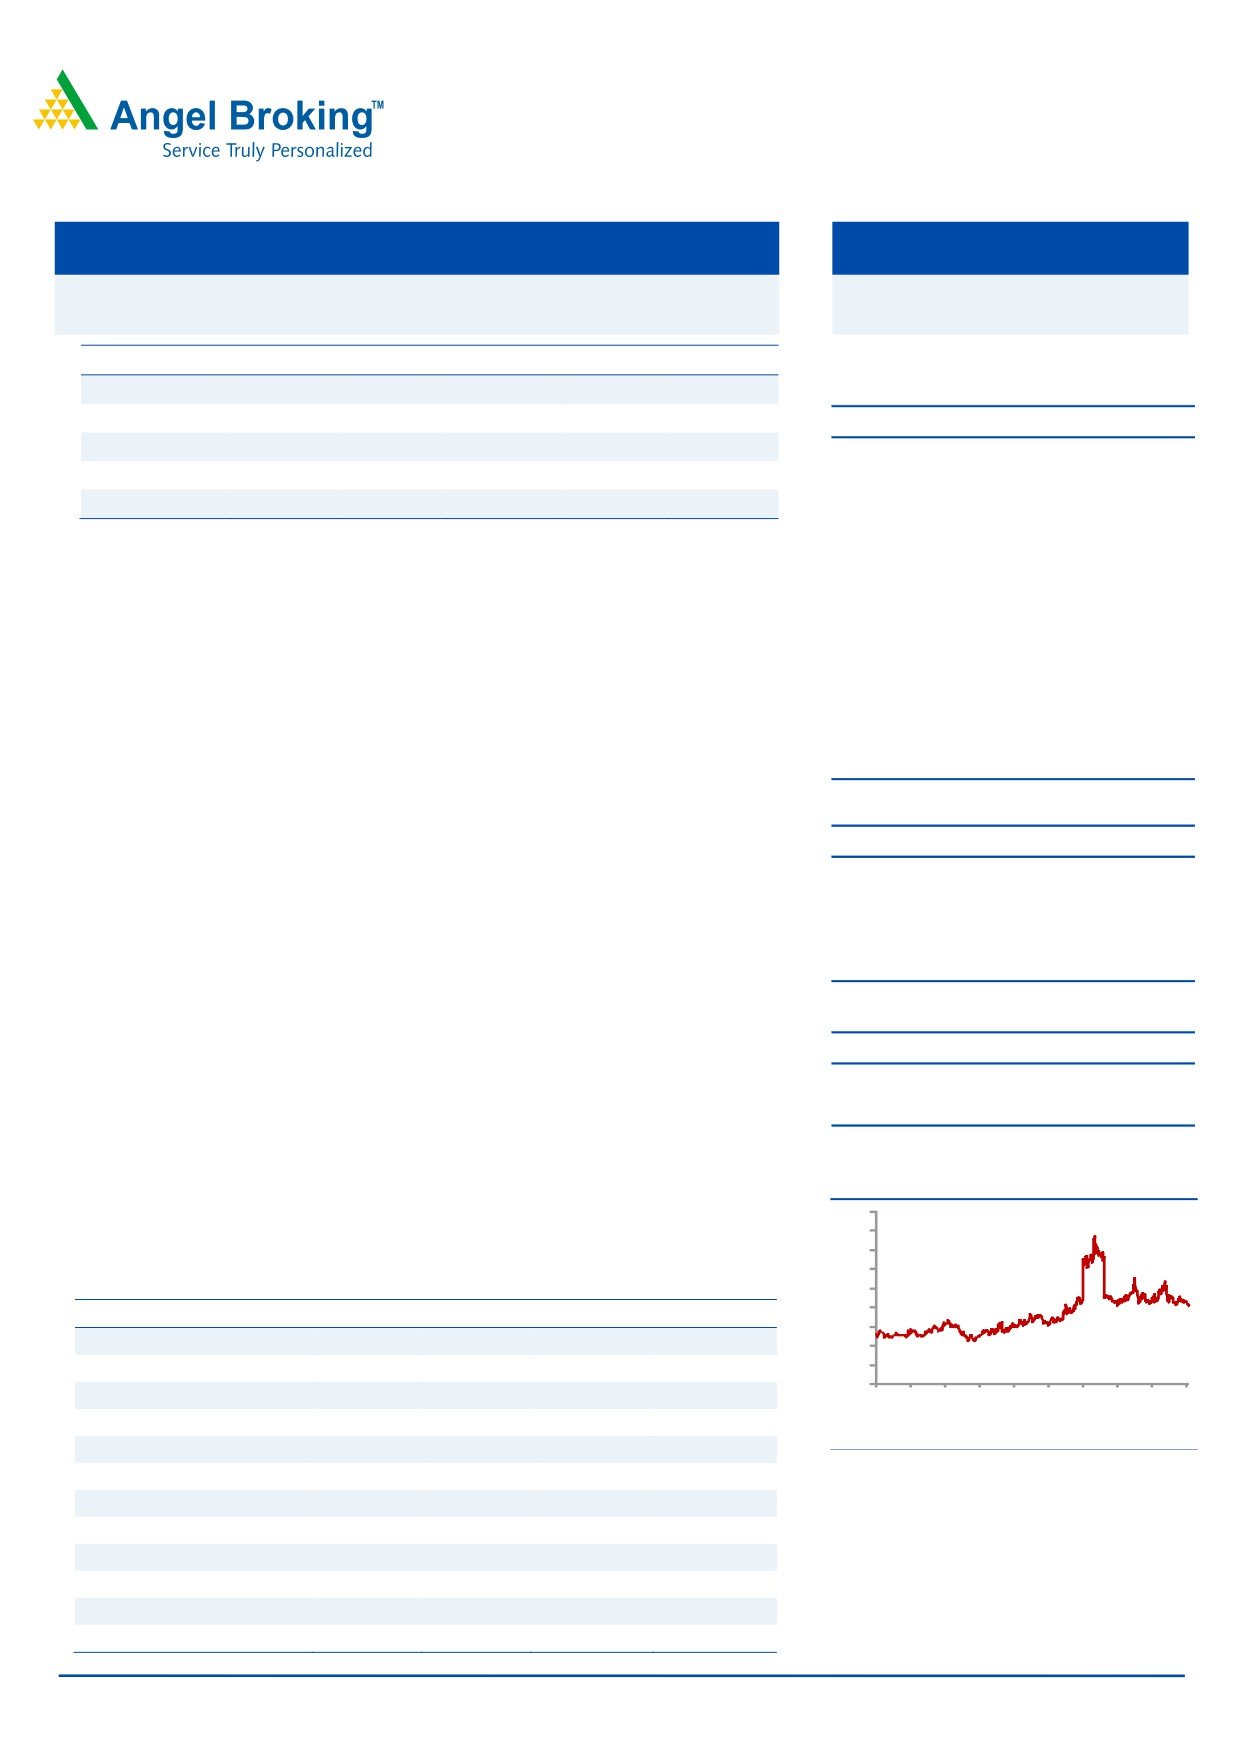
3-year price chart
450
current levels, the stock is trading at a fair valuation of 18.7x its FY2017E EPS.
400
Hence, we maintain our Neutral recommendation on the stock.
350
300
Key financials (Consolidated)
250
200
Y/E March (` cr)
FY2014
FY2015
FY2016E
FY2017E
150
Net Sales
1,747
1,822
2,097
2,415
100
50
% chg
19.8
4.3
15.1
15.2
0
Adj.Net Profit
152
157
184
214
2
2
2
3
3
4
4
4
5
5
1
1
1
1
1
1
1
1
1
1
n
n
v
r
p
b
-
c
y
ŧ
% chg
32.9
3.5
16.9
16.4
a
u
o
p
e
e
uJ
e
a
c
J
J
N
A
S
F
D
M
O
EBITDA %
13.9
14.2
14.4
14.4
Source: Company, Angel Research
FDEPS (`)
7.8
8.1
9.5
11.0
P/E (x)
26.4
25.5
21.8
18.7
P/BV (x)
5.6
4.9
4.3
3.7
RoE (%)
22.7
20.5
21.1
21.3
RoACE (%)
26.4
24.7
25.6
26.6
Sarabjit Kour Nangra
EV/Sales (x)
2.4
2.3
2.0
1.7
+91-22-39357800 ext. 6806
EV/EBITDA (x)
17.4
16.4
14.0
11.9
Source: Company, Angel Research; Note: CMP as of November 3, 2015
Please refer to important disclosures at the end of this report
1
Rallis India | 2QFY2016 Result Update
Exhibit 1: 2QFY2016 performance (Consolidated)
Y/E March (` cr)
2QFY2016
1QFY2016
% chg (qoq) 2QFY2015
% chg (yoy)
1HFY2016 1HFY2015
% chg
Net sales
500
464
7.8
636
(21.4)
963
1,101
(12.5)
Other income
5
6
(19.6)
7
(31.3)
11
13
(17.0)
Total income
505
470
7.4
643
(21.5)
974
1,114
(12.6)
Gross profit
233
243
(4.1)
245
(4.8)
477
479
(0.5)
Gross margin (%)
46.7
52.5
38.5
49.5
43.5
EBDITA
95
52
82.7
116
(18.4)
146
172
(14.9)
EBDITA margin (%)
18.9
11.2
18.2
15.2
15.6
Financial cost
3
4
(30.3)
3
(5.0)
7
5
38.8
Depreciation
13
12
10.9
13
0.0
25
24
3.0
PBT
84
42
99.2
107
(21.9)
126
156
(19.5)
Provision for taxation
28
2
1,386.1
34
(18.3)
30
40
(25.9)
PAT Before Exc. And MI
56
40
39.2
73
(23.6)
96
116
(17.3)
Minority
(1)
7
(1)
6
5
-
Exceptional
0
0
0
0
0
Reported PAT
57
33
73.1
73
(22.0)
90
110
(18.2)
Adjusted PAT
57
33
73.1
73
(22.0)
90
110
(18.2)
EPS (`)
2.9
1.7
3.8
4.6
5.7
Source: Company, Angel Research
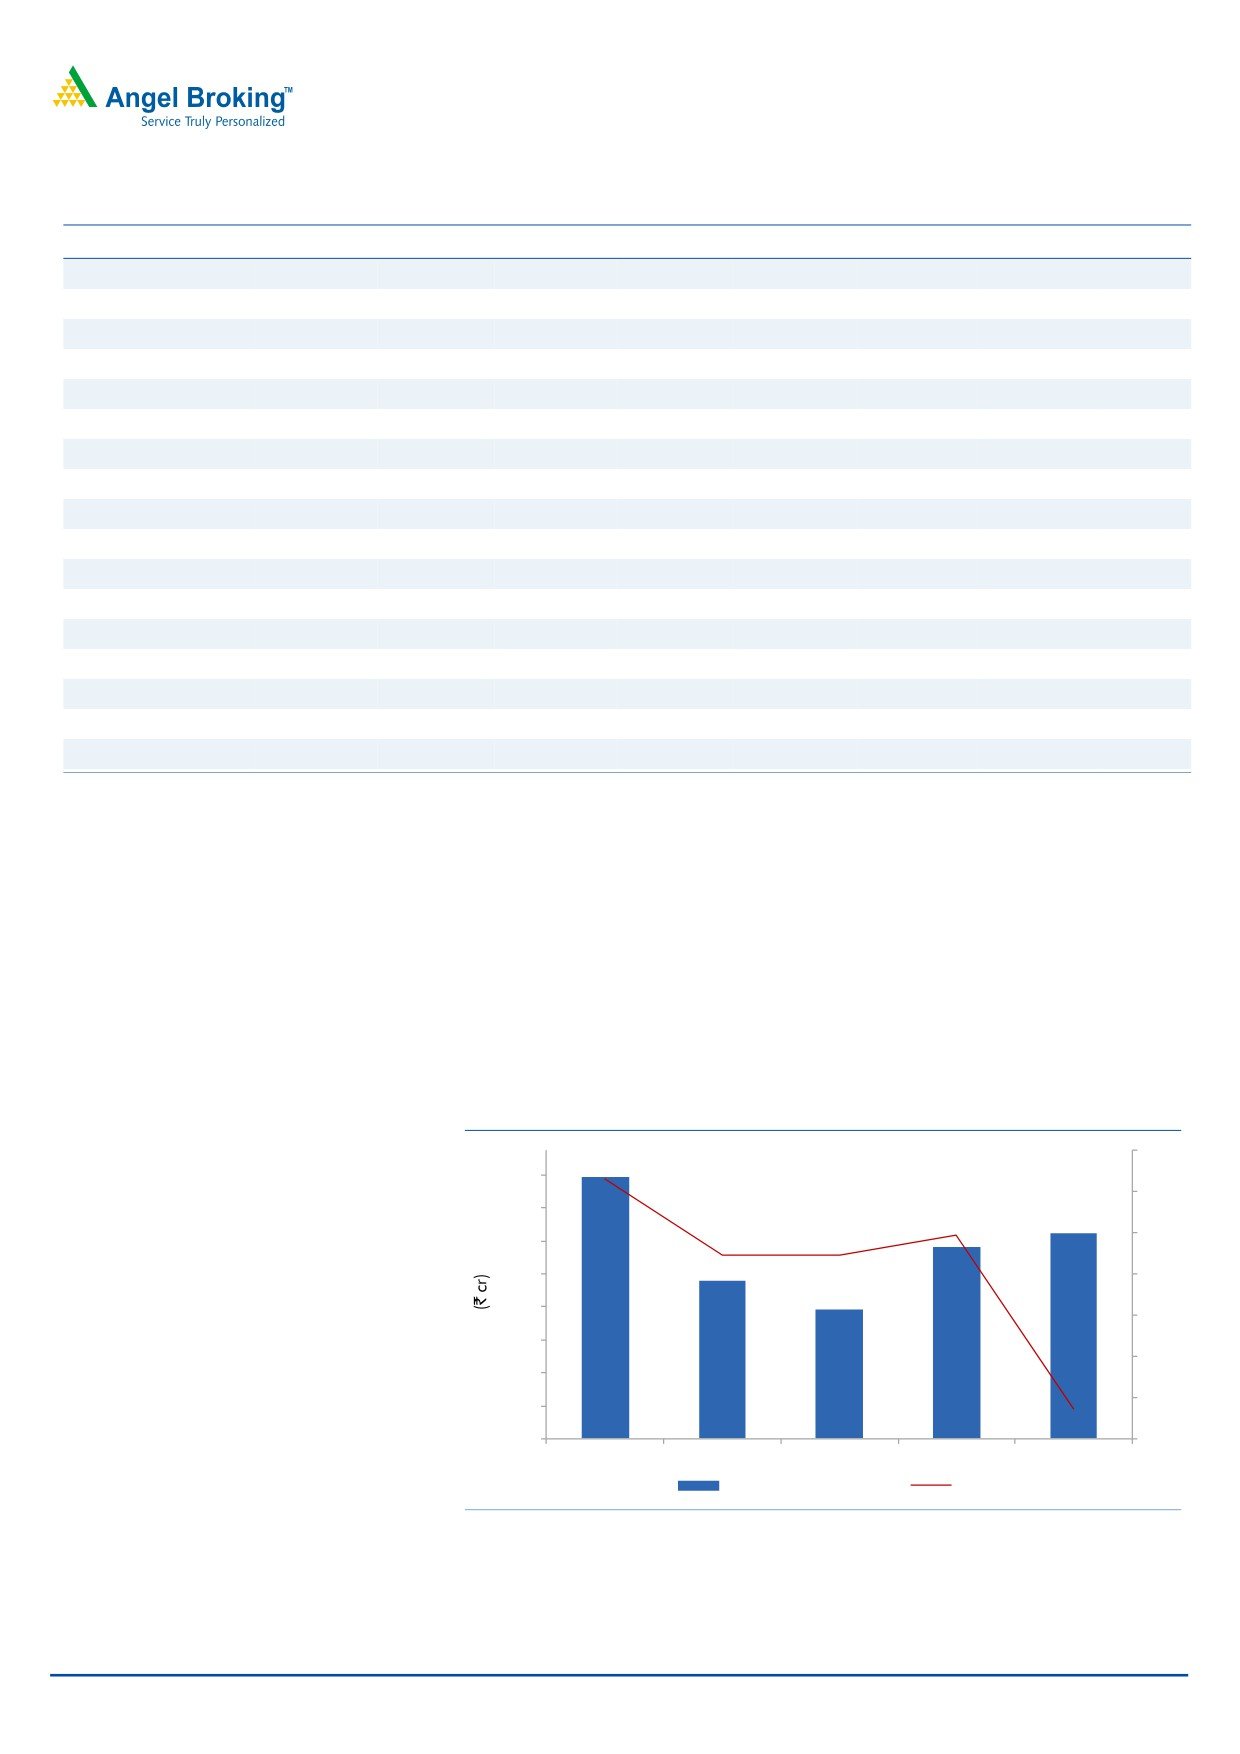
Sales de-grew by 21.4% yoy
For 2QFY2016, sales were adversely impacted due to poor monsoon in India,
while the international market also faced pressure with Brazil (a key market for the
company) witnessing a severe drought. In USA, low crop commodity prices along
with higher inventory prices impacted consumption. The company’s seed business
also posted a 35% yoy drop in sales due to lower purchases by the government
and shift in cropping pattern. On account of weak monsoon, the company’s
domestic business posted flat growth.
Exhibit 2: Total revenue performance
10
636
640
5
560
500
464
0
480
385
400
(5)
315
320
(10)
240
(15)
160
(20)
80
0
(25)
2QFY2015
3QFY2015
4QFY2015
1QFY2016
2QFY2016
Total Revenue
% YoY
Source: Company, Angel Research
November 4, 2015
2
Rallis India | 2QFY2016 Result Update
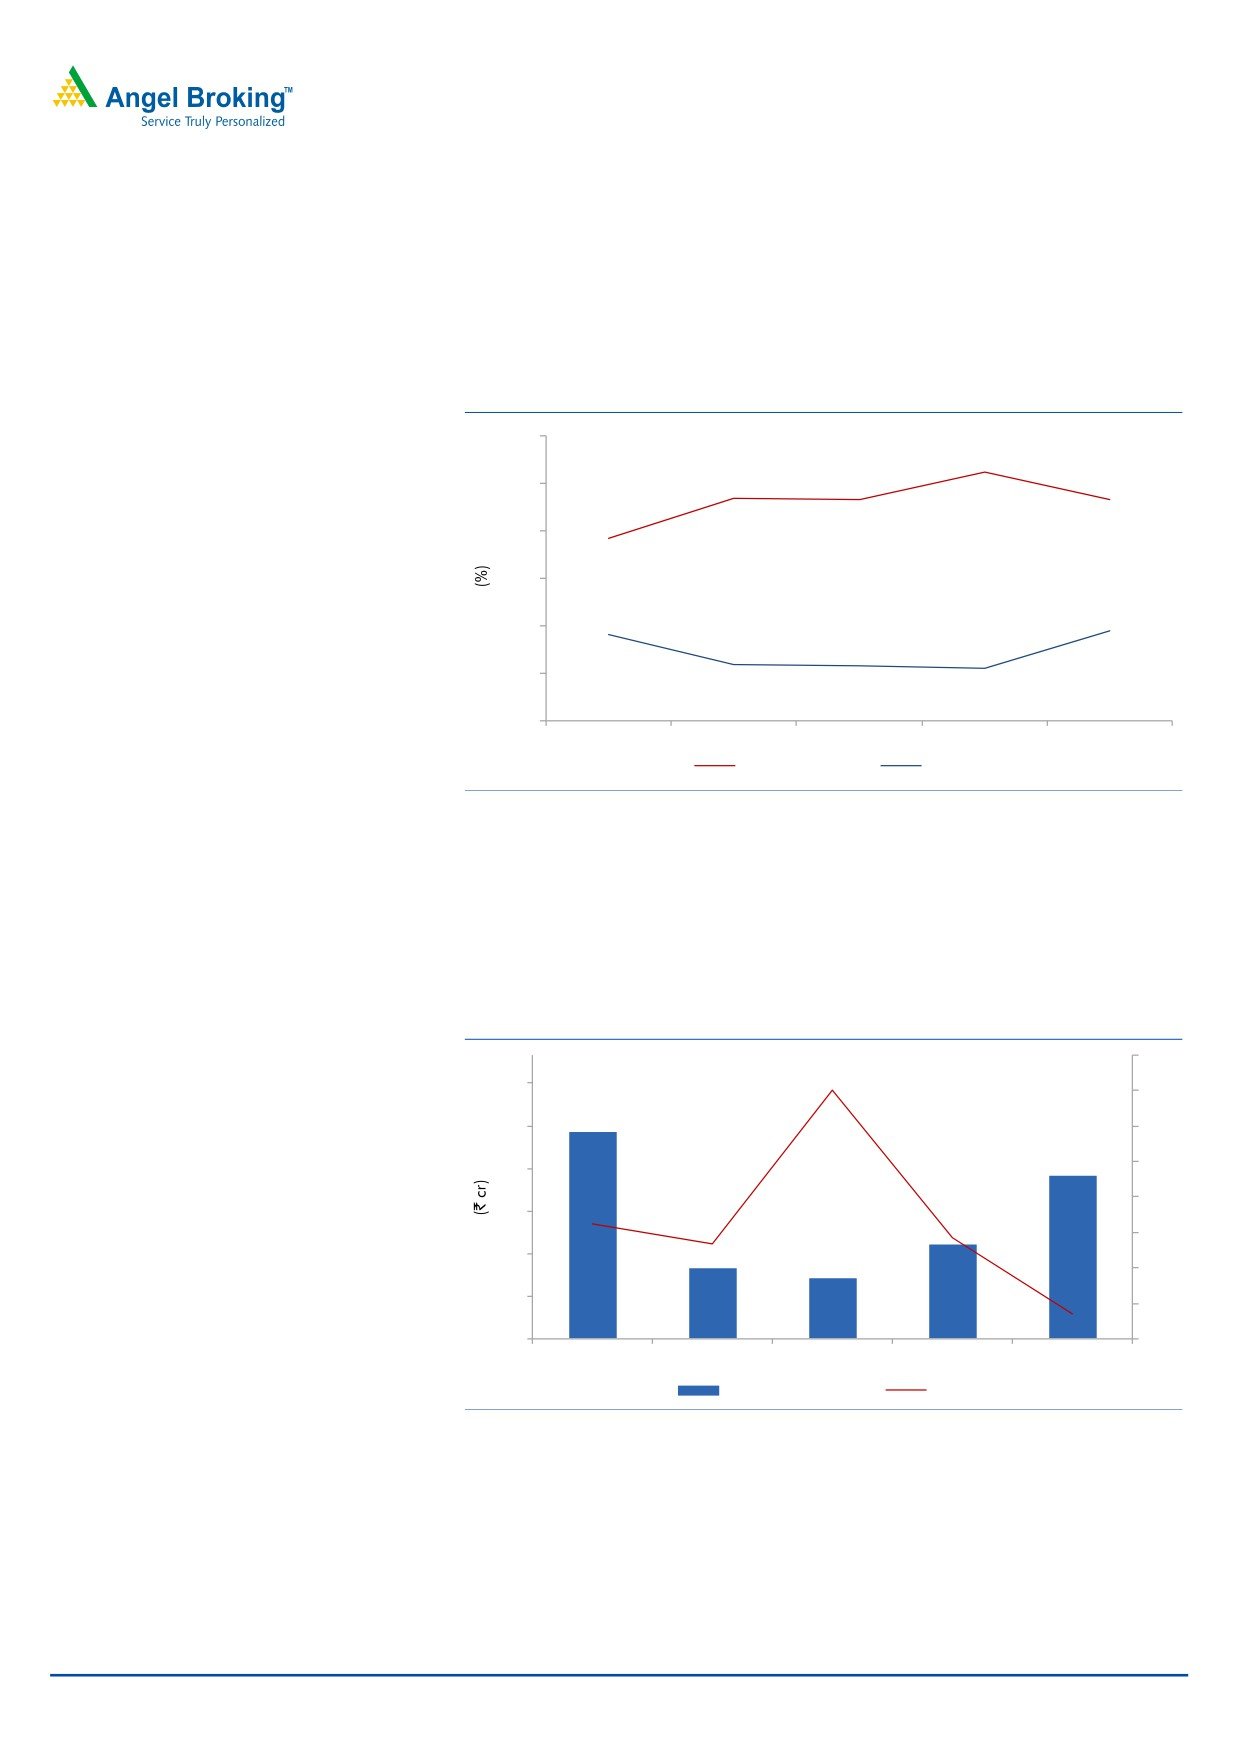
OPM dips yoy
On the operating front, the gross margin for the quarter came in at 46.7% V/s
38.5% in 2QFY2015, which led the OPM to come in at 18.9% V/s 18.2% in
2QFY2015. An 11% and 5.0% yoy rise in staff costs and other expenditure,
respectively, weighed down margins.
Exhibit 3: Margin trend (%)
60.0
52.5
46.8
46.6
46.7
50.0
38.5
40.0
30.0
20.0
18.2
18.9
10.0
11.9
11.7
11.2
0.0
2QFY2015
3QFY2015
4QFY2015
1QFY2016
2QFY2016
Gross margin
EBITDA margin
Source: Company, Angel Research
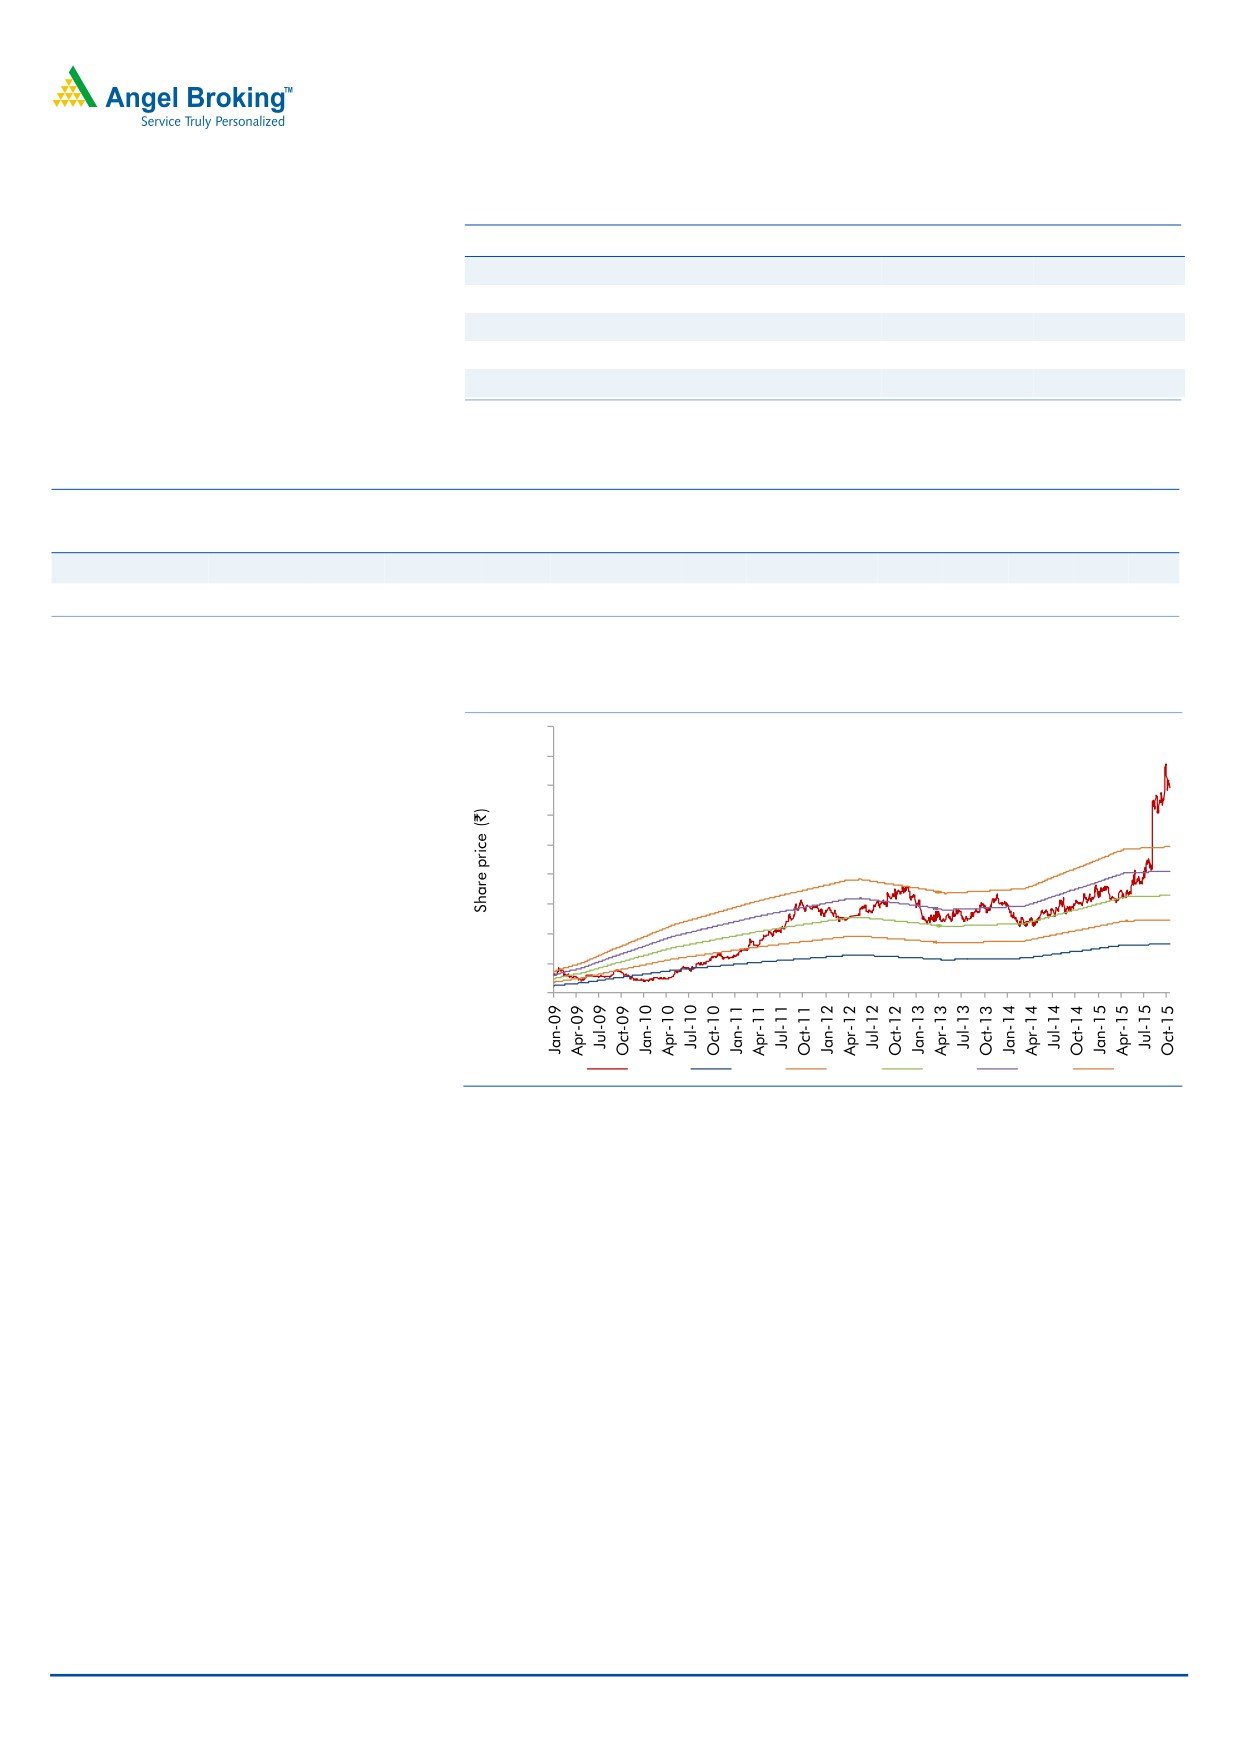
Earnings decline
The PBT for the quarter posted a decline of 21.9% yoy owing to a 31.3% dip in
other income. The Adj. net profit declined by 22.0% yoy to ~`57cr. Tax expenses
during the quarter dipped by 18.3% to `28cr V/s `34cr in 2QFY2015.
Exhibit 4: Adjusted PAT trend
15
90
10
73
75
5
57
0
60
(5)
45
33
(10)
30
25
21
(15)
15
(20)
0
(25)
2QFY2015
3QFY2015
4QFY2015
1QFY2016
2QFY2016
Adj PAT
% YoY
Source: Company, Angel Research
November 4, 2015
3
Rallis India | 2QFY2016 Result Update
Concall Highlights
The Management has maintained its cautious outlook for the ensuing Rabi
season as low ground water level remains a concern. Water in reservoirs is
lower by 20-25% compared to the average levels. However, rainfall in late
September, especially in the farming regions of Maharashtra and Karnataka,
has given some hope to farmers of a decent harvest.
The company has taken a decision to offer higher credit to its dealers /
distributors and bring it in line with the industry.
Investment arguments
Company set to seize rising opportunities in the domestic crop protection market:
India's overall pesticide consumption is one of the lowest in the world, and has a
huge potential to grow. We believe Rallis is well placed to seize this opportunity on
the back of its wide distribution network, strong brands, and a robust new-product
pipeline. According to industry estimates, the unorganized market accounts for
50% of the industry. Nonetheless, we believe Rallis is in a position to wrest market
share as well as charge a premium for its products. Further, the company has
enhanced focus on the non-pesticide side of the business, which is a high growth
segment, and now constitutes around 30% of its overall sales. Thus, we estimate
Rallis to post a13.0% CAGR in its domestic sales over FY2015-17E.
Exports to register steady growth: Although a late entrant, the company has been
enhancing its focus in the exports market, which is now turning out to be its main
growth driver. Overall exports formed ~30% of sales in FY2015. Going forward,
the segment will continue to post a 20% CAGR over FY2015-17E.
Contract manufacturing to be the next growth driver: Rallis plans to focus on
contract manufacturing for exports and selectively target top players. To facilitate
the same, the company has set up a plant at Dahej, which in FY2013 was working
at full capacity and contributed significantly to the overall growth of the company.
Overall, Rallis targets to achieve a cumulative revenue of `1,000cr over the next
five years from this segment alone. Currently, the company is working on 12-13
projects in the CRAMS business and expects this business to ramp up significantly
over the next few years
Outlook and valuation
The Management is confident of the prospects of key crops such as cotton and
paddy due to generally normal monsoons, which should aid continued healthy
growth in the agrochemicals industry. We expect Rallis to register a CAGR of
15.1% and 16.7% in net sales and profit respectively, over FY2015-17E. At the
current levels, the stock is trading at a fair valuation of 18.7x its FY2017E EPS.
Hence, we maintain our Neutral recommendation on the stock.
November 4, 2015
4
Rallis India | 2QFY2016 Result Update
Exhibit 5: Key assumptions
Particulars (%)
FY2016E
FY2017E
Domestic growth
13.0
13.0
Export growth
20.0
20.0
Total revenue growth
15.1
15.2
EBITDA margin
14.4
14.4
Capex (` cr)
50
70
Source: Company, Angel Research
Exhibit 6: Peer valuation
Company
Reco
Mcap CMP TP Upside
P/E (x)
EV/Sales (x)
EV/EBITDA (x)
RoE (%)
CAGR (%)
(` cr)
(`)
(`)
(%) FY16E FY17E FY16E FY17E FY16E FY17E FY16E FY17E
Sales PAT
Rallis
Neutral
4,011
206
-
-
21.8
18.7
2.0
1.7
14.0
11.9
21.1
21.3
15.1
16.7
United Phosphorus Accumulate
19,347
451
510
13.1
14.0
11.6
1.8
1.5
10.3
8.6
21.4
21.3
15.0
20.0
Source: Company, Angel Research, Bloomberg
Exhibit 7: One-year forward P/E band
450.0
400.0
350.0
300.0
250.0
200.0
150.0
100.0
50.0
0.0
Price
10x
15x
20x
25x
30x
Source: C-line, Angel Research
Company Background
Rallis is one of the oldest and second largest pesticide agrichemical companies in
the country with a market share of around 13% and belongs to the Tata Group.
The company also has a credible presence in the international market. Pesticides
account for 97% of the company's total revenues, while plant nutrients, seeds and
leather chemicals contribute the balance. Contribution from the domestic business
stands at ~70%, while exports account for the balance.
November 4, 2015
5
Rallis India | 2QFY2016 Result Update
Profit & loss (Consolidated)
Y/E March (` cr)
FY2012
FY2013
FY2014
FY2015
FY2016E
FY2017E
Gross sales
1,328
1,535
1,840
1,922
2,212
2,548
Less: Excise duty
79
95
114
121
136
154
Net Sales
1,249
1,440
1,726
1,801
2,075
2,394
Other operating income
25
18
21
21
21
21
Total operating income
1,275
1,458
1,747
1,822
2,097
2,415
% chg
17.4
14.4
19.8
4.3
15.1
15.2
Total Expenditure
1,058
1,241
1,485
1,545
1,777
2,050
Net Raw Materials
695
823
1,008
995
1,206
1,391
Other Mfg costs
255
304
342
341
393
454
Personnel
90
94
111
129
149
172
Other
18
20
24
25
29
33
EBITDA
192
199
240
256
298
344
% chg
10.0
3.9
20.8
6.5
16.5
15.3
(% of Net Sales)
15.3
13.8
13.9
14.2
14.4
14.4
Depreciation & Amortisation
29
32
41
50
50
54
EBIT
188
186
221
228
269
311
% chg
6.3
(1.5)
18.9
3.1
18.4
15.4
(% of Net Sales)
15.1
12.9
12.8
12.6
13.0
13.0
Interest & other Charges
17
21
13
10
11
10
Other Income
5
5
6
4
4
4
(% of PBT)
3
3
3
2
2
1
Share in profit of Associates
-
-
-
-
-
-
Recurring PBT
176
170
214
222
263
306
% chg
(4.2)
(3.5)
26.3
3.4
18.5
16.4
Extraordinary Expense/(Inc.)
(23)
3
-
-
-
-
PBT (reported)
153
172
214
222
263
306
Tax
49
53
62
62
79
92
(% of PBT)
31.8
31.0
28.8
27.9
30.0
30.0
Minority Interest
2
(0)
0.8
2.6
2.6
2.6
PAT (reported)
99
119
152
157
184
214
ADJ. PAT
109
114
152
157
184
214
% chg
(13.3)
4.6
32.9
3.5
16.9
16.4
(% of Net Sales)
8.7
7.9
8.8
8.7
8.9
8.9
Basic EPS (`)
5.6
5.9
7.8
8.1
9.5
11.0
Fully Diluted EPS (`)
5.6
5.9
7.8
8.1
9.5
11.0
% chg
(13.3)
4.6
32.9
3.5
16.9
16.4
November 4, 2015
6
Rallis India | 2QFY2016 Result Update
Balance sheet (Consolidated)
Y/E March (` cr)
FY2012
FY2013
FY2014
FY2015
FY2016E
FY2017E
SOURCES OF FUNDS
Equity Share Capital
19
19
19
19
19
19
Preference Capital
-
-
-
-
-
-
Reserves & Surplus
534
601
699
795
910
1,056
Shareholders Funds
553
621
718
815
930
1,075
Minority Interest
1
5
10
10
10
10
Total Loans
151
131
75
111
111
80
Other Long Term Liabilities
0
6
4
4
4
4
Long Term provisions
18
30
15
19
19
19
Deferred Tax Liability
13
28
32
36
36
36
Total Liabilities
736
821
853
993
1,113
1,227
APPLICATION OF FUNDS
Gross Block
551
581
651
687
737
807
Less: Acc. Depreciation
189
195
233
282
332
386
Net Block
362
386
418
405
405
421
Capital Work-in-Progress
60
35
21
21
21
21
Goodwill
155
169
186
196
196
196
Investments
23
20
25
24
24
24
Long Term Loans and Adv.
91
92
98
110
119
137
Current Assets
432
488
549
680
850
1,007
Cash
11
26
9
7
32
64
Loans & Advances
45
28
40
28
75
86
Other
375
435
500
645
743
857
Current liabilities
387
368
445
443
502
579
Net Current Assets
45
120
104
237
348
428
Mis. Exp. not written off
-
-
-
-
-
-
Total Assets
736
821
853
993
1,113
1,227
November 4, 2015
7
Rallis India | 2QFY2016 Result Update
Cash flow statement (Consolidated)
Y/E March (` cr)
FY2012
FY2013
FY2014
FY2015
FY2016E FY2017E
Profit before tax
153
172
214
222
263
306
Depreciation
29
32
41
50
50
54
(Inc)/Dec in Working Capital
(28)
(61)
(7)
(147)
(94)
(67)
Direct taxes paid
(38)
(53)
(62)
(62)
(79)
(92)
Cash Flow from Operations
144
150
186
63
139
201
(Inc.)/ Dec. in Fixed Assets
(55)
(5)
(56)
(36)
(50)
(70)
(Inc.)/ Dec. in Investments
3
3
(5)
1
-
-
Inc./ (Dec.) in loans and adv.
-
-
-
-
-
-
Cash Flow from Investing
(52)
(2)
(61)
(35)
(50)
(70)
Issue of Equity
-
-
-
-
-
-
Inc./(Dec.) in loans
35
(6)
(73)
40
0
(31)
Dividend Paid (Incl. Tax)
(47)
(50)
(55)
(68)
(68)
(68)
Others
(82)
(78)
(14)
(1)
-
-
Cash Flow from Financing
(95)
(134)
(142)
(29)
(64)
(99)
Inc./(Dec.) in Cash
(3)
15
(17)
(2)
25
32
Opening Cash balances
15
11
26
9
7
32
Closing Cash balances
11
26
9
7
32
64
November 4, 2015
8
Rallis India | 2QFY2016 Result Update
Key ratios
Y/E March
FY2012
FY2013
FY2014
FY2015
FY2016E
FY2017E
Valuation Ratio (x)
P/E (on FDEPS)
36.7
35.1
26.4
25.5
21.8
18.7
P/CEPS
22.3
26.6
20.8
19.4
17.2
15.0
P/BV
7.3
6.5
5.6
4.9
4.3
3.7
Dividend yield (%)
1.0
1.0
1.0
1.0
1.5
1.9
EV/Sales
3.4
2.9
2.4
2.3
2.0
1.7
EV/EBITDA
22.3
21.3
17.4
16.4
14.0
11.9
EV / Total Assets
5.8
5.2
4.9
4.2
3.8
3.3
Per Share Data (`)
EPS (Basic)
5.6
5.9
7.8
8.1
9.5
11.0
EPS (fully diluted)
5.6
5.9
7.8
8.1
9.5
11.0
Cash EPS
9.3
7.7
9.9
10.6
12.0
13.8
DPS
2.0
2.0
2.0
2.0
3.0
4.0
Book Value
28.4
31.9
36.9
41.9
47.8
55.3
Dupont Analysis
EBIT margin
15.1
12.9
12.8
12.6
13.0
13.0
Tax retention ratio
68.2
69.0
71.2
72.1
70.0
70.0
Asset turnover (x)
1.8
1.9
2.1
2.0
2.0
2.1
ROIC (Post-tax)
19.0
16.6
19.0
18.0
18.1
18.8
Cost of Debt (Post Tax)
8.9
10.1
8.7
7.9
7.0
7.0
Leverage (x)
0.3
0.2
0.2
0.2
0.2
0.1
Operating ROE
22.4
18.0
20.6
19.7
19.8
19.8
Returns (%)
ROCE (Pre-tax)
27.3
23.8
26.4
24.7
25.6
26.6
Angel ROIC (Pre-tax)
44.1
33.7
35.9
32.4
33.0
34.4
ROE
20.6
19.5
22.7
20.5
21.1
21.3
Turnover ratios (x)
Asset Turnover (Gross Block)
2.7
2.6
2.8
2.7
2.9
3.1
Inventory / Sales (days)
72
67
62
74
80
84
Receivables (days)
30
34
35
37
40
42
Payables (days)
131
111
98
105
97
96
WC cycle (ex-cash) (days)
4
16
20
33
48
52
Solvency ratios (x)
Net debt to equity
0.3
0.2
0.1
0.2
0.1
0.0
Net debt to EBITDA
0.8
0.7
0.3
0.5
0.3
0.1
Interest Coverage (EBIT / Int.)
10.9
9.0
17.5
22.5
24.3
32.6
November 4, 2015
9
Rallis India | 2QFY2016 Result Update
Research Team Tel: 022 - 39357800
DISCLAIMER
Angel Broking Private Limited (hereinafter referred to as “Angel”) is a registered Member of National Stock Exchange of India Limited, Bombay Stock
Exchange Limited and Metropolitan Stock Exchange of India Limited. It is also registered as a Depository Participant with CDSL and Portfolio Manager
with SEBI. It also has registration with AMFI as a Mutual Fund Distributor. Angel Broking Private Limited is a registered entity with SEBI for Research
Analyst in terms of SEBI (Research Analyst) Regulations, 2014 vide registration number INH000000164. Angel or its associates has not been debarred/
suspended by SEBI or any other regulatory authority for accessing /dealing in securities Market. Angel or its associates including its relatives/analyst do
not hold any financial interest/beneficial ownership of more than 1% in the company covered by Analyst. Angel or its associates/analyst has not
received any compensation / managed or co-managed public offering of securities of the company covered by Analyst during the past twelve months.
Angel/analyst has not served as an officer, director or employee of company covered by Analyst and has not been engaged in market making activity of
the company covered by Analyst.
This document is solely for the personal information of the recipient, and must not be singularly used as the basis of any investment decision. Nothing in
this document should be construed as investment or financial advice. Each recipient of this document should make such investigations as they deem
necessary to arrive at an independent evaluation of an investment in the securities of the companies referred to in this document (including the merits
and risks involved), and should consult their own advisors to determine the merits and risks of such an investment.
Reports based on technical and derivative analysis center on studying charts of a stock's price movement, outstanding positions and trading volume, as
opposed to focusing on a company's fundamentals and, as such, may not match with a report on a company's fundamentals.
The information in this document has been printed on the basis of publicly available information, internal data and other reliable sources believed to be
true, but we do not represent that it is accurate or complete and it should not be relied on as such, as this document is for general guidance only. Angel
Broking Pvt. Limited or any of its affiliates/ group companies shall not be in any way responsible for any loss or damage that may arise to any person
from any inadvertent error in the information contained in this report. Angel Broking Pvt. Limited has not independently verified all the information
contained within this document. Accordingly, we cannot testify, nor make any representation or warranty, express or implied, to the accuracy, contents
or data contained within this document. While Angel Broking Pvt. Limited endeavors to update on a reasonable basis the information discussed in this
material, there may be regulatory, compliance, or other reasons that prevent us from doing so.
This document is being supplied to you solely for your information, and its contents, information or data may not be reproduced, redistributed or
passed on, directly or indirectly.
Neither Angel Broking Pvt. Limited, nor its directors, employees or affiliates shall be liable for any loss or damage that may arise from or in connection
with the use of this information.
Note: Please refer to the important ‘Stock Holding Disclosure' report on the Angel website (Research Section). Also, please refer to the latest update on
respective stocks for the disclosure status in respect of those stocks. Angel Broking Pvt. Limited and its affiliates may have investment positions in the
stocks recommended in this report.
Disclosure of Interest Statement
Rallis India
1. Analyst ownership of the stock
No
2. Angel and its Group companies ownership of the stock
No
3. Angel and its Group companies' Directors ownership of the stock
No
4. Broking relationship with company covered
No
Note: We have not considered any Exposure below ` 1 lakh for Angel, its Group companies and Directors
Ratings (Based on expected returns
Buy (> 15%)
Accumulate (5% to 15%)
Neutral (-5 to 5%)
over 12 months investment period):
Reduce (-5% to -15%)
Sell (< -15)
November 4, 2015
10