Quick take | BANK
January 7, 2018
RBL Bank
BUY
CMP
`573
Target Price
`690
RBL Bank (RBL), formerly Ratnakar Bank, was founded in 1943 and is a 75-year
Investment Period
12 Months
old bank now. Post induction of Mr. Vishwavir Ahuja, RBL has transformed from
a small & regional bank to a new age bank with all the products and
technologies that any private bank has to offer. The bank’s advances have
Stock Info
registered healthy CAGR of 42% over FY2014-18. As of Q2FY2019, it has
Sector
Banking
branch network of 268 and CASA ratio of 24.5%; wholesale lending forms 59%
Market Cap (` cr)
24,122
of advances and retail 41%.
Beta
1.1
VISION 2020 - Well on track: In FY2016, RBL came up with an IPO and had set
52 Week High / Low
652/439
VISION 2020 with a target to grow advances at 30-35% CAGR, increase CASA
Avg. Daily Volume
73,296
by 75-100bps every year and elevate ROA to 1.5% by 2020. Since, then, the
Face Value (`)
10
bank has been progressing on the path to achieve this target. Advances grew at
BSE Sensex
35,850
healthy CAGR of 38% over FY2016-18 and CASA increased by 590bps to 24.5%
Nifty
10,771
in Q2FY2019. Further, cost control measures, improvement in core fee income
Reuters Code
RATB.NS
and stable asset quality has aided ROA improvement by 0.28bps to 1.26% in
Bloomberg Code
RBK.IN
Q2FY2019.
Impeccable asset quality: Despite growing the loan book aggressively, RBL
Bank’s asset quality has not deteriorated like that of other corporate lenders.
Shareholding Pattern (%)
RBL’s GNPA rose from 1% in FY2016 to 1.40% in Q2FY2019 however, other
Promoters
7.8
corporate lenders witnessed deterioration in asset quality by more than 400bps
MF / Banks / Indian Fls
20.7
during the same time. As on Q2FY2019, restructured assets are 0.7% of
FII / NRIs / OCBs
39.8
advances, exposure to IBC list I/II is negligible and in RBI annual review of Asset
Indian Public / Others
31.7
quality banks divergence was negligible, where RBI checks that all NPA are
disclosed as per norms. This clearly indicates strong risk management practice of
the bank.
Abs.(%)
3m 1yr
3yr
NIM to sustain: NIM has improved 120bps from FY2016 to 3.8% in Q2FY2019.
Sensex
(1.7)
6.1
-
Despite offering differential rates in SA deposits, NIM has been improving
RBL Bank
8.5
10.8
-
continuously, owing to rising share of high yielding retail loans and lower interest
reversals, as slippages remain under control. We expect that NIMs will remain
stable over FY2018-20E, as retail contribution is likely to grow and COF to
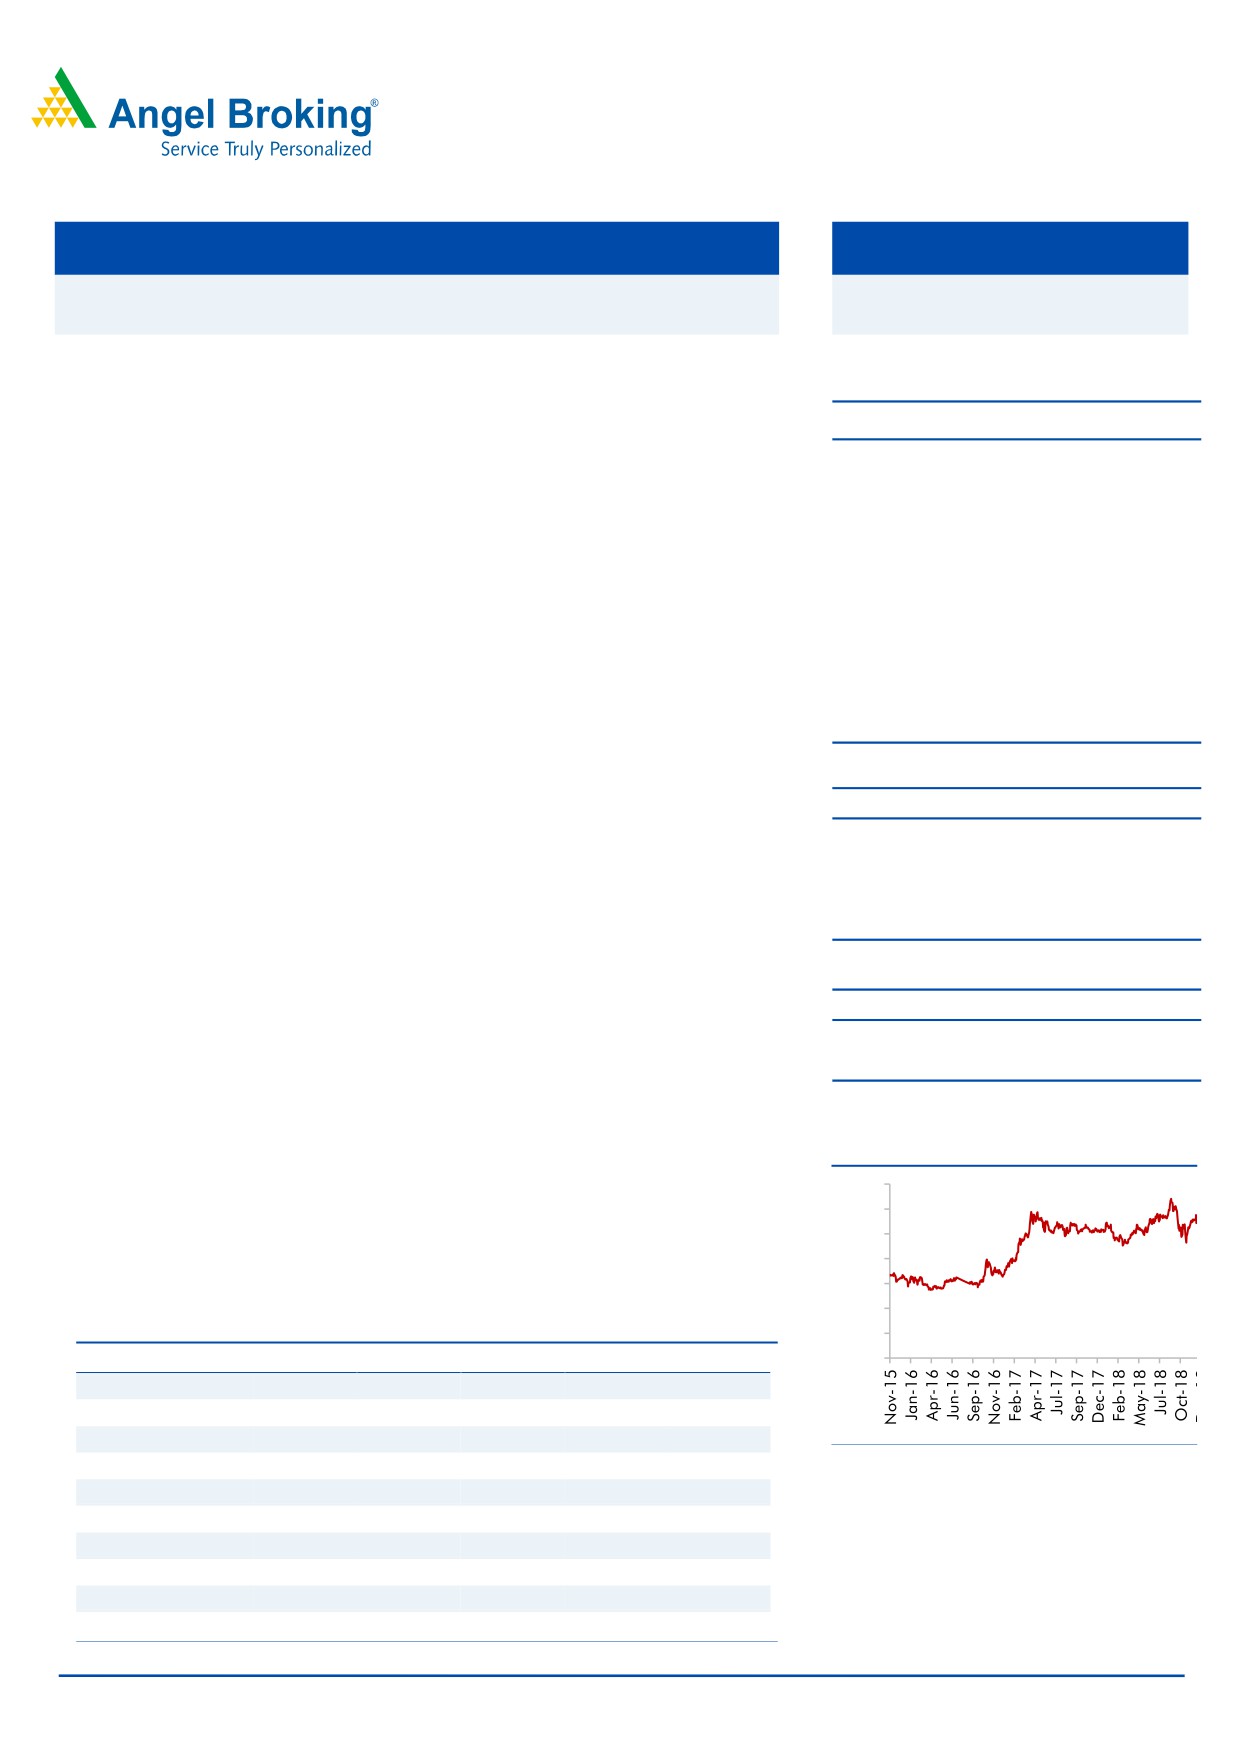
3-year price chart
remain moderate with rising CASA.
700
Outlook & valuation: RBL Bank currently trades at 2.9x its FY2020E book value,
600
500
which we believe is reasonable for a bank with focused management, high-
400
growth traction, improving CASA and prospects of improvement in NIM & return
300
ratio. Hence, we recommend Buy on the stock, with a Target Price of `690.
200
Exhibit 1: Key Financials
100
Y/E March (` cr)
FY16
FY17
FY18
FY19E
FY20E
0
NII
819
1,221
1,766
2,478
3,219
% chg
42
42
27
33
34
Net profit
292
446
635
914
1,195
Source: Company, Angel Research
% chg
41.2
52.5
42.3
44.0
30.7
NIM (%)
2.6
2.9
3.4
3.6
3.6
EPS ( `)
7.0
10.6
15.1
21.8
28.5
P/E (x)
75
49
35
24
18
Jaikishan Parmar
P/ABV (x)
7.5
5.2
3.4
3.0
2.7
Research Analyst
RoA (%)
0.9
1.0
1.1
1.3
1.3
022 - 3935 7800 Ext: 6810
RoE (%)
11.2
12.2
11.5
12.9
15.0
Source: Company CMP as on 07/01/2019
Please refer to important disclosures at the end of this report
1
RBL Bank
Key investment arguments
VISION 2020 - Well on track: In FY2016, RBL came up with an IPO and had set
VISION 2020 with a target to grow advances at 30-35% CAGR, increase CASA by
75-100bps every year and elevate ROA to 1.5% by 2020. Since, then, the bank
has been progressing on the path to achieve this target. Advances grew at healthy
CAGR of 38% over FY2016-18 and CASA increased by 590bps to 24.5% in
Q2FY2019. Further, cost control measures, improvement in core fee income and
stable asset quality has aided
ROA improvement by 0.28bps to 1.26% in
Q2FY2019.
Exhibit 1: Vision 2020 well on track
RBL Vision 2020
Actual 2QFY19
Particular
(Post IPO/Sept 2016)
FY16
FY17
FY18
1QFY19
2QFY19
Advances
30-35% CAGR
47
39
37
36
37
0.75 - 1% increase
CASA Ratio (%)
18.6
22
24.3
24.5
24.5
every year
Cost/Income ratio of
Operational Efficiency (%)
58.6
53.5
53
51.5
51.5
51% - 52% by 2020
Return Ratios (%)
~ 1.50% RoA by 2020
0.98
1.08
1.21
1.22
1.26
Other Income (%)
~ 1/3rd of Net Total Income
37
38
38
37
36
Source: Company
Retail business to drive growth: Since FY2012, RBL Bank has been focusing on
building the retail business and the retail book has been growing at healthy rate.
RBL has divided retail assets into three verticals viz. (1) Branch & Business Banking
(BBB), (2) Development Banking, and (3) Financial Inclusion (DB&FI) and Agri.
BBB segment offers LAP, business loans, personal loans, cards and other loans.
Exhibit 2: Retail loan book trend
Particular (`)
FY13
FY14
FY15
FY16
FY17
FY18
BBB
690
1630
2360
3465
5,370
8,891
yoy %
136
45
47
55
66
DB & FI
720
1320
2080
3,133
4,122
5,684
yoy %
83
58
51
32
38
Agri
210
620
1340
1756
2,109
1,940
yoy %
195
116
31
20
-8
Non-Wholesale
1,620
3,570
5,780
8,354
11,601
16,515
yoy %
120
62
45
39
42
Source: Company
RBL is gaining market share in credit cards:
RBL had tied up with Bajaj Finance (NBFC) in FY2017 to launch a series of co-
branded credit cards for Indian customers. With this partnership, RBL Bank is
strengthening its scale of operations in the credit cards business, while the
January 07, 2019
2
RBL Bank
partnership has also enabled Bajaj Finance to expand its EMI network, especially
in the consumer finance space.
The tie up with Bajaj Finance coupled with focused approach of the management
to build the credit card portfolio, has resulted into an increase in the market share
of RBL Bank, which has doubled over the last one year. Its share in outstanding
number of cards has increased from a minuscule 0.9% in March 2017 to 2.1% in
March 2018. The tie up has worked very well for RBL (refer Exhibit 4).
Exhibit 3: RBL has gained market share
Particulars (%)
Mar-16
Mar-17
Mar-18
Apr-18
May-18
Jun-18
Jul-18
Aug-18
HDFC Bank Ltd
29.7
28.6
28.5
28.6
28.5
28.4
28.3
28.2
State Bank Of India
14.8
15.3
16.7
16.8
16.8
16.8
16.7
16.7
ICICI Bank Ltd
14.9
14.3
13.3
13.3
13.4
13.4
13.4
13.4
Axis Bank Ltd
9.8
11.2
12.0
12.0
11.9
11.8
11.8
11.9
Citi Bank
9.8
8.5
7.1
6.7
6.7
6.7
6.6
6.5
Kotak Mahindra Bank Ltd
3.0
3.5
3.9
4.0
4.0
4.1
4.1
4.1
Standard Chartered Bank Ltd
4.1
3.7
3.3
3.4
3.3
3.3
3.2
3.2
American Express
3.4
3.4
3.2
3.2
3.2
3.1
3.1
3.1
Ratnakar Bank Limited
0.6
0.9
2.1
2.3
2.4
2.5
2.6
2.7
IndusInd Bank Ltd
1.8
2.0
2.1
2.1
2.1
2.1
2.1
2.1
Source: Company
Majority of the banks have incrementally added new credit cards in the range of
1.1x to 2x over FY2017-18, however, RBL has added 3.9x over the same time
period. RBL has not only added credit cards but has enhanced the the customer
base also, which has proved to be business accretive. The share in number of
transactions has increased & spending per card has been continuously rising. RBL’s
ticket size per transaction has improved steadily and it is amongst the top five in
the industry.
Exhibit 4: New credit card addition growth
Particular
Mar-17
Mar-18
YoY Growth
HDFC Bank Ltd
1,31,416
5,18,726
3.95
State Bank Of India
81,903
1,61,169
1.97
ICICI Bank Ltd
9,49,006
16,89,312
1.78
Axis Bank Ltd
12,63,028
21,41,655
1.70
Citi Bank
1,42,321
1,98,638
1.40
Kotak Mahindra Bank Ltd
3,17,195
4,18,078
1.32
Standard Chartered Bank Ltd
6,00,940
7,43,543
1.24
American Express
9,33,167
11,39,659
1.22
Ratnakar Bank Limited
1,28,434
1,46,069
1.14
IndusInd Bank Ltd
1,68,001
1,78,257
1.06
Source: Company
RBL is aiming to double the customer base in FY2019E and the bank has set a
target of 40 lakh card users (customers) by FY2021E, as it aims to become a
prominent player in the country. Bajaj Finance has customer base of over ~30
million, which will help RBL to achieve its target of becoming top player in the
January 07, 2019
3
RBL Bank
industry. Improvement in credit card business would help RBL to grow its retail loan
book and also aid to generate higher fee income.
Impeccable asset quality: Most of the corporate lenders have witnessed jump
in GNPA largely owing to exposure to steel and power sectors, where lot of
projects have got stuck owing to delay in regulatory approvals and changes in
policy. Further, in RBI’s annual review of Asset quality, RBL’s divergence was
negligible, where RBI checks that all NPA are disclosed as per norms.
According to Divergence with the RBI during asset quality review (AQR) on
FY2016, the gross NPAs for RBL stood at 1.6% of FY2016 advances. For
FY2017, divergence further reduced and which is just 17bps of Q3FY18 loan
book. This clearly indicates that the bank is following strong credit risk
monitoring.
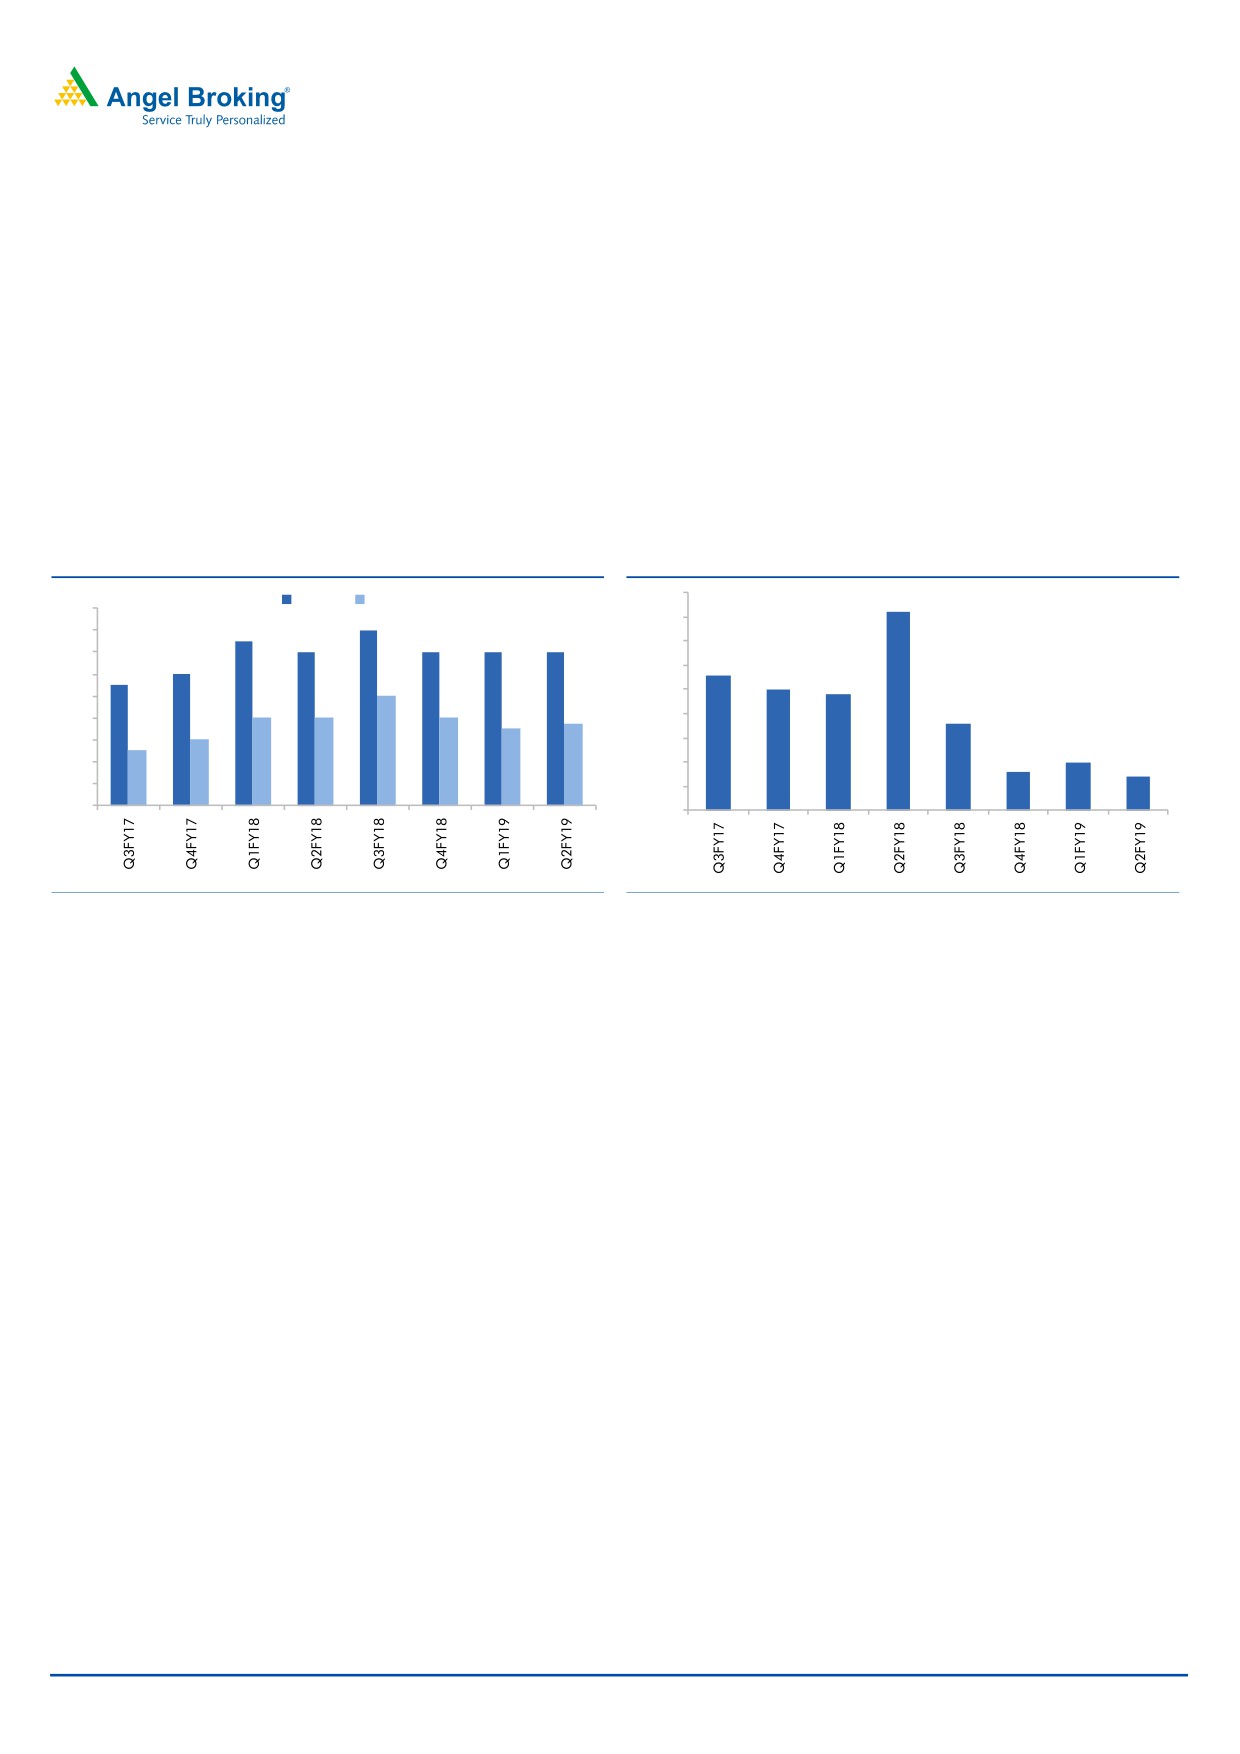
Exhibit 5: GNPA & NPA
Exhibit 6: Restructured assets as (%) of advance
GNPA% NPA%
0.45
0.41
1.8
1.6
0.40
1.5
1.6
1.4
1.4
1.4
1.4
0.35
1.4
1.2
0.28
1.1
0.30
1.2
0.25
1.0
0.24
0.25
1.0
0.8
0.8
0.8
0.7
0.18
0.7
0.20
0.8
0.6
0.6
0.5
0.15
0.10
0.08
0.4
0.10
0.07
0.2
0.05
0.0
0.00
Source: Company
Source: Company
Despite growing the loan book aggressively, RBL Bank’s asset quality has not
deteriorated like that of other corporate lenders. RBL’s GNPA rose from 1% in
FY2016 to 1.40% in Q2FY2019 however, other corporate lenders witnessed
deterioration in asset quality by more than 400bps during the same time. As on
Q2FY2019, restructured asset is 0.7% of advances, exposure to IBC list I/II is
negligible in RBI annual review of Asset quality banks divergence was negligible,
which clearly indicates strong risk management practices of the bank.
NIM to sustain: NIM has improved 120bps from FY2016 to 3.8% in Q2FY2019.
Despite offering differential rates in SA deposits, NIM has been improving
continuously, owing to rising share of high yielding retail loans and lower interest
reversals, as slippages remain under control. We expect that NIMs will remain
stable over FY2018-20E, as retail contribution is likely to grow and COF to remain
moderate with rising CASA.
January 07, 2019
4
RBL Bank
Outlook & valuation: RBL Bank currently trades at 2.9x its FY2020E book value,
which we believe is reasonable for a bank with focused management, high-growth
traction, improving CASA and prospects of improvement in NIM & return ratio.
Hence, we recommend Buy on the stock, with a Target Price of `690.
Exhibit 7: Comparative DuPont analysis
Du Pont (%)
RBL
HDFC ICICI
IndusInd
Yes
DCB
Federal
City Union
FY2018
Bank
Bank
Bank
Bank
Bank
Bank
Bank
Bank
NII
3.2
4.2
2.8
3.7
2.9
3.7
2.8
3.8
Non Interest Income
1.9
1.6
2.1
2.4
2.0
1.1
0.9
1.4
Total Revenues
5.1
5.7
4.9
6.1
4.9
4.8
3.7
5.2
Operating Cost
2.6
2.5
1.9
2.8
2.0
2.9
1.9
2.0
PPP
2.5
3.3
3.0
3.3
2.9
1.9
1.8
3.2
Total provisions
0.7
0.6
2.1
0.6
0.6
0.5
0.7
1.1
Pre-Tax Profit
1.8
2.7
0.9
2.7
2.3
1.4
1.1
2.1
Tax
0.7
1.0
0.1
0.9
0.7
0.5
0.4
0.5
ROA
1.1
1.7
0.8
1.8
1.6
0.9
0.7
1.6
Leverage
10.0
9.8
8.1
9.0
11.0
10.8
12.0
9.7
RoE (%)
11.5
16.8
6.6
16.2
17.7
9.8
8.3
15.3
Source: Company
Company background
RBL Bank (RBL), formerly Ratnakar Bank, was founded in 1943 and is a 75-year
old bank now. Post induction of Mr. Vishwavir Ahuja, RBL has transformed from a
small & regional bank to a new age bank with all the products and technologies
that any private bank has to offer. The bank’s advances have registered healthy
CAGR of 42% over FY2014-18. As of Q2FY2019, it has branch network of 268
and CASA ratio of 24.5%; wholesale lending forms 59% of advances and retail
41%.
Key risks to our estimates
Deterioration in asset quality, slowdown in growth and bloating up of costs are
the key risks.
Unsecured loan book resulting in higher than anticipated defaults and credit
costs.
January 07, 2019
5
RBL Bank
Income Statement
Y/E March (` cr)
FY16
FY17
FY18
FY19E
FY20E
Net Interest Income
819
1,221
1,766
2,478
3,219
- YoY Growth (%)
47
49
45
40
30
Other Income
491
755
1,068
1,372
1,852
- YoY Growth (%)
22
54
41
28
35
Operating Income
1,310
1,977
2,834
3,850
5,072
- YoY Growth (%)
36
51
43
36
32
Operating Expenses
767
1,056
1,504
1,975
2,601
- YoY Growth (%)
28
38
42
31
32
Pre - Provision Profit
542
920
1,331
1,874
2,470
- YoY Growth (%)
51
70
45
41
32
Prov. & Cont.
114
239
365
489
660
- YoY Growth (%)
90
109
53
34
35
Profit Before Tax
428
681
966
1,385
1,810
- YoY Growth (%)
43
59
42
43
31
Prov. for Taxation
136
235
331
471
615
- as a % of PBT
32
35
34
34
34
PAT
292
446
635
914
1,195
- YoY Growth (%)
41
53
42
44
31
Balance Sheet
Y/E March (` cr)
FY16
FY17
FY18
FY19E
FY20E
Equity
325
375
420
420
420
Reserve & Surplus
2,665
3,960
6,264
7,041
8,057
Networth
2,989
4,336
6,684
7,461
8,476
Deposits
24,349
34,588
43,902
58,325
78,303
- Growth (%)
42
42
27
33
34
Borrowings
10,536
7,980
9,261
12,410
16,630
Other Liab. & Prov.
1,330
1,785
2,003
3,851
3,854
Total Liabilities
39,204
48,689
61,851
82,047
1,07,263
Cash Balances
1,340
2,948
2,589
3,578
4,782
Bank Balances
1,110
1,246
1,695
2,045
2,733
Investments
14,436
13,482
15,448
19,934
23,910
Advances
21,229
29,449
40,268
54,362
73,388
- Growth (%)
47
39
37
35
35
Fixed Assets
177
259
334
460
615
Other Assets
912
1,306
1,517
1,669
1,836
Total Assets
39,204
48,689
61,851
82,047
1,07,263
January 07, 2019
6
RBL Bank
Key Ratio
Y/E March
FY16
FY17
FY18
FY19E
FY20E
Profitability ratios (%)
NIMs
2.6
2.9
3.4
3.6
3.6
Cost to Income Ratio
58.6
53.4
53.0
51.3
51.3
RoA
0.9
1.0
1.1
1.3
1.3
RoE
11.2
12.2
11.5
12.9
15.0
B/S ratios (%)
CASA Ratio
0.19
0.22
0.24
0.25
0.26
Credit/Deposit Ratio
0.9
0.9
0.9
0.9
0.9
Asset Quality (%)
Gross NPAs
0.98
1.21
1.41
1.33
1.25
Gross NPAs (Amt)
208.1
356.8
566.7
723.0
917.4
Net NPAs
0.59
0.64
0.78
0.73
0.73
Net NPAs (Amt)
124.4
189.9
314.0
396.8
535.7
Slippages
Credit Cost on Advance
0.54
0.81
0.91
0.90
0.90
Provision Coverage
60%
53%
55%
55%
58%
Per Share Data (`)
EPS
7.0
10.6
15.1
21.8
28.5
BV
71.2
103.3
159.3
177.8
202.0
ABVPS (75% cover.)
69.8
101.3
155.8
173.5
195.8
DPS
1.5
1.8
2.3
3.3
4.3
Valuation Ratios
PER (x)
81.9
53.7
37.7
26.2
20.1
P/BV
8.0
5.5
3.6
3.2
2.8
P/ABVPS (x)
8.2
5.6
3.7
3.3
2.9
Dividend Yield
0.3
0.3
0.4
0.6
0.7
Valuation done on closing price of 04/01/2019
January 07, 2019
7
RBL Bank
Research Team Tel: 022 - 39357800
DISCLAIMER:
Angel Broking Limited (hereinafter referred to as “Angel”) is a registered Member of National Stock Exchange of India Limited, Bombay
Stock Exchange Limited, Metropolitan Stock Exchange Limited, Multi Commodity Exchange of India Ltd and National Commodity &
Derivatives Exchange Ltd It is also registered as a Depository Participant with CDSL and Portfolio Manager and Investment Adviser with
SEBI. It also has registration with AMFI as a Mutual Fund Distributor. Angel Broking Limited is a registered entity with SEBI for Research
Analyst in terms of SEBI (Research Analyst) Regulations, 2014 vide registration number INH000000164. Angel or its associates has not
been debarred/ suspended by SEBI or any other regulatory authority for accessing /dealing in securities Market. Angel or its
associates/analyst has not received any compensation / managed or co-managed public offering of securities of the company covered
by Analyst during the past twelve months.
This document is solely for the personal information of the recipient, and must not be singularly used as the basis of any investment
decision. Nothing in this document should be construed as investment or financial advice. Each recipient of this document should
make such investigations as they deem necessary to arrive at an independent evaluation of an investment in the securities of the
companies referred to in this document (including the merits and risks involved), and should consult their own advisors to determine
the merits and risks of such an investment.
Reports based on technical and derivative analysis center on studying charts of a stock's price movement, outstanding positions and
trading volume, as opposed to focusing on a company's fundamentals and, as such, may not match with a report on a company's
fundamentals. Investors are advised to refer the Fundamental and Technical Research Reports available on our website to evaluate the
contrary view, if any
The information in this document has been printed on the basis of publicly available information, internal data and other reliable
sources believed to be true, but we do not represent that it is accurate or complete and it should not be relied on as such, as this
document is for general guidance only. Angel Broking Limited or any of its affiliates/ group companies shall not be in any way
responsible for any loss or damage that may arise to any person from any inadvertent error in the information contained in this report.
Angel Broking Limited has not independently verified all the information contained within this document. Accordingly, we cannot testify,
nor make any representation or warranty, express or implied, to the accuracy, contents or data contained within this document. While
Angel Broking Limited endeavors to update on a reasonable basis the information discussed in this material, there may be regulatory,
compliance, or other reasons that prevent us from doing so.
This document is being supplied to you solely for your information, and its contents, information or data may not be reproduced,
redistributed or passed on, directly or indirectly.
Neither Angel Broking Limited, nor its directors, employees or affiliates shall be liable for any loss or damage that may arise from or in
connection with the use of this information.
Disclosure of Interest Statement
RBL Bank
1. Financial interest of research analyst or Angel or his Associate or his relative
No
2. Ownership of 1% or more of the stock by research analyst or Angel or associates or relatives
No
3. Served as an officer, director or employee of the company covered under Research
No
4. Broking relationship with company covered under Research
No
Ratings (Based on expected returns
Buy (> 15%)
Accumulate (5% to 15%)
Neutral (-5 to 5%)
over 12 months investment period):
Reduce (-5% to -15%)
Sell (< -15)