2QFY2016 Result Update | Oil&Gas
October 26, 2015
Petronet LNG
ACCUMULATE
CMP
`193
Utilisation improves; Expansion on-track
Target Price
`210
Investment Period
12 Months
Standalone (` cr)
2QFY16
2QFY15
yoy%
1QFY16
qoq%
Net revenue
7,545
10,980
(31.3)
8,377
(9.9)
EBITDA
467
519
(10.1)
361
29.3
Stock Info
Margin (%)
6.2
4.7
146bp
4.3
188bp
Sector
Oil&Gas
Reported PAT
249
263
(5.3)
248
0.5
Market Cap (` cr)
14,456
Source: Company, Angel Research
Net Debt (` cr)
2,310
For 2QFY2016, Petronet LNG (PLNG)’s EBITDA came in ahead of our expectation
Beta
0.7
at `467cr, as against our estimate of `389cr, led by higher-than-expected
52 Week High / Low
222/160
contribution margin. The EBITDA declined 10% yoy but was up 29% sequentially.
Avg. Daily Volume
7,75,154
Contribution margin for the quarter came in at `37.4/MMBTU as against
Face Value (`)
10
`42.0/MMBTU in the corresponding quarter last year and vs `35.7/MMBTU in the
BSE Sensex
27,471
sequential previous quarter. The better-than-expected contribution was on
Nifty
8,295
account of higher utilization at the Dahej terminal, which operated at ~121% of
Reuters Code
PLNG.BO
its capacity (as against ~98% utilisation in the sequential previous quarter),
Bloomberg Code
PLNG IN
processing 154TBTU during the quarter. The Management indicated that the
increase in utilisation was temporary and should be ~100% going forward.
Shareholding Pattern (%)
Blended realisation was lower at
`481/MMBTU as against
`637/MMBTU
Promoters
50.0
in 1QFY2016 and `730/MMBTU in 2QFY2015, on account of lower spot
MF / Banks / Indian Fls
5.1
LNG prices.
FII / NRIs / OCBs
22.5
Expansion plan remains on track: Expansion of capacity of the Dahej terminal
Indian Public / Others
22.5
from 10MMTPA to 15MMTPA is going on as per schedule and the Management
expects to complete the same by 2016-end. The company has also initiated the
process for selection of EPC contractors for further expansion of the Dahej
Abs. (%)
3m 1yr
3yr
terminal’s capacity to 17.50 MMTPA.
Sensex
(3.2)
2.3
46.8
PLNG
(3.6)
(2.4)
17.3
Outlook and valuation: PLNG is a direct play on the gas deficit story in India. The
company’s strong expansion plan makes it well positioned to benefit from the
demand supply gap. The stock currently trades at 15x and 14x its FY2016E and
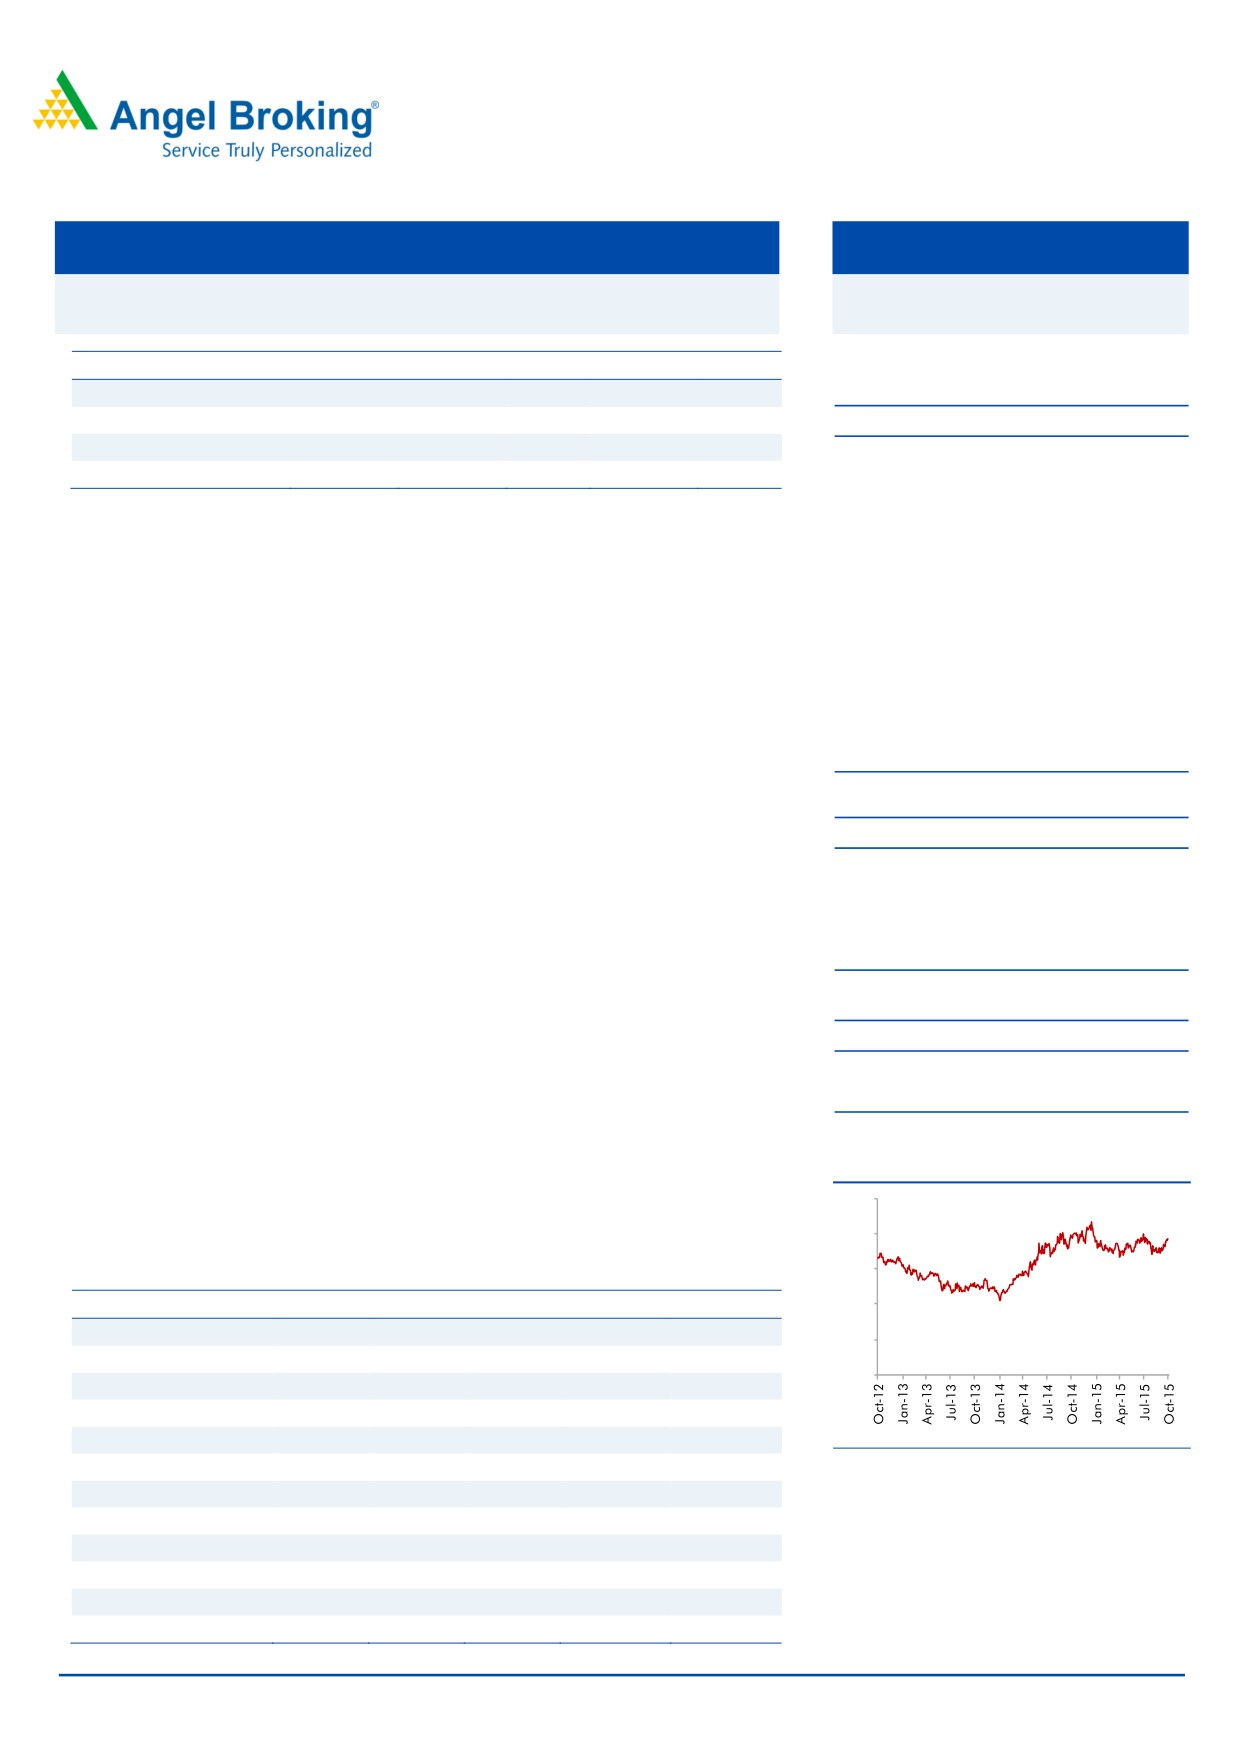
3-year price chart
250
FY2017E EPS. We use DCF to arrive at our target price of `210 and retain our
Accumulate rating on the stock.
200
150
Key financials (Standalone)
Y/E March (` cr)
FY2013
FY2014
FY2015
FY2016E
FY2017E
100
Net sales
31,467
37,748
39,501
29,691
31,188
50
% chg
38.6
20.0
4.6
-24.8
5.0
0
Adj. net profit
1,149
712
883
959
1,007
% chg
8.7
(38.1)
24.0
8.6
5.0
Adj. EPS (`)
15.3
9.5
11.8
12.8
13.4
Source: Company, Angel Research
OPM (%)
6.2
4.0
3.6
5.8
6.2
P/E (x)
12.6
20.3
16.4
15.1
14.4
P/BV (x)
3.2
2.9
2.5
2.2
2.0
RoE (%)
28.8
15.1
16.5
15.8
14.8
RoCE (%)
24.5
15.1
13.5
15.7
15.8
Rahul Dholam
EV/Sales (x)
0.5
0.4
0.4
0.6
0.5
Tel: 022- 3935 7800 Ext: 6847
EV/EBIDTA
8.4
11.0
11.7
9.7
8.5
Source: Company, Angel Research: Note CMP as of October 23, 2015
Please refer to important disclosures at the end of this report
1
Petronet LNG | 2QFY2016 Result Update
Exhibit 1: 2QFY2016 performance (Standalone)
(` cr)
2QFY16
2QFY15
yoy%
1QFY16
qoq%
FY2015
FY2014
yoy%
Net sales
7,545
10,980
(31.3)
8,377
(9.9)
39,501
37,748
4.6
Raw material
6,959
10,349
(32.8)
7,908
(12.0)
37,611
35,849
4.9
% of net sales
92.2
94.2
94.4
95.2
95.0
Gross Margin
586
631
(7.1)
469
25.0
1,890
1,898
(0.4)
Margin (%)
7.8
5.8
202bp
5.6
217bp
4.8
5.0
274bp
Employee Cost
14
11
30.6
15
(4.4)
57
47
22.5
% of net sales
0.2
0.1
0.2
0.1
0.1
Other expenditure
105
101
3.8
93
13.1
394
353
11.6
% of net sales
1.4
0.9
1.1
1.0
0.9
Total expenditure
7,078
10,461
(32.3)
8,016
(11.7)
38,062
36,249
5.0
% of net sales
93.8
95.3
95.7
96.4
96.0
EBITDA
467
519
(10.1)
361
29.3
1,439
1,498
(4.0)
Margin (%)
6.2
4.7
146bp
4.3
188bp
3.6
4.0
222bp
Interest
61
80
(23.5)
61
(0.0)
293
220
33.7
Depreciation
81
77
4.5
80
0.9
315
308
2.4
Other income
36
35
2.7
33
8.0
155
84
84.8
Exceptional items
0
0
0
0
0
Profit before tax
361
397
(9.1)
253
42.6
985
1,055
(70.1)
% of net sales
4.8
3.6
3.0
2.5
2.8
Tax
112
134
6
102
343
(70.1)
% of PBT
31.0
33.8
2.2
10.4
32.5
Adj. PAT
249
263
(5.3)
248
0.5
883
712
24.0
Source: Company, Angel Research
Result highlights
Better than expected volumes led by higher utilisation
PLNG reported a healthy contribution margin of `586cr, well ahead
of our
expectation, led by higher volumes at the Dahej terminal. Contribution margin
declined 7% yoy, but increased 25% on a sequential basis. Contribution margin
came in at `37.4/MMBTU as against `42.0/MMBTU in the corresponding quarter
last year and vs `35.7/MMBTU in the sequential previous quarter.
During the quarter, the Dahej terminal operated at ~121% of its capacity,
processing 154TBTU, as against ~98% utilisation in the sequential previous
quarter. The Management indicated that the increase in utilisation was temporary
and should be at ~100%, going forward. Volumes continued to remain low at the
Kochi terminal at 2.7TBTU (no reload sales) as against 6.11TBTU in 1QFY2016.
Total volumes at 156.7TBTU were well ahead of our expectation, increasing 23%
over the sequential previous quarter (127.9TBTU). Blended realisation was lower at
`481/MMBTU as against `637/MMBTU in 1QFY2016 and `730/MMBTU in
2QFY2015, on account of lower spot LNG prices.
October 26, 2015
2
Petronet LNG | 2QFY2016 Result Update
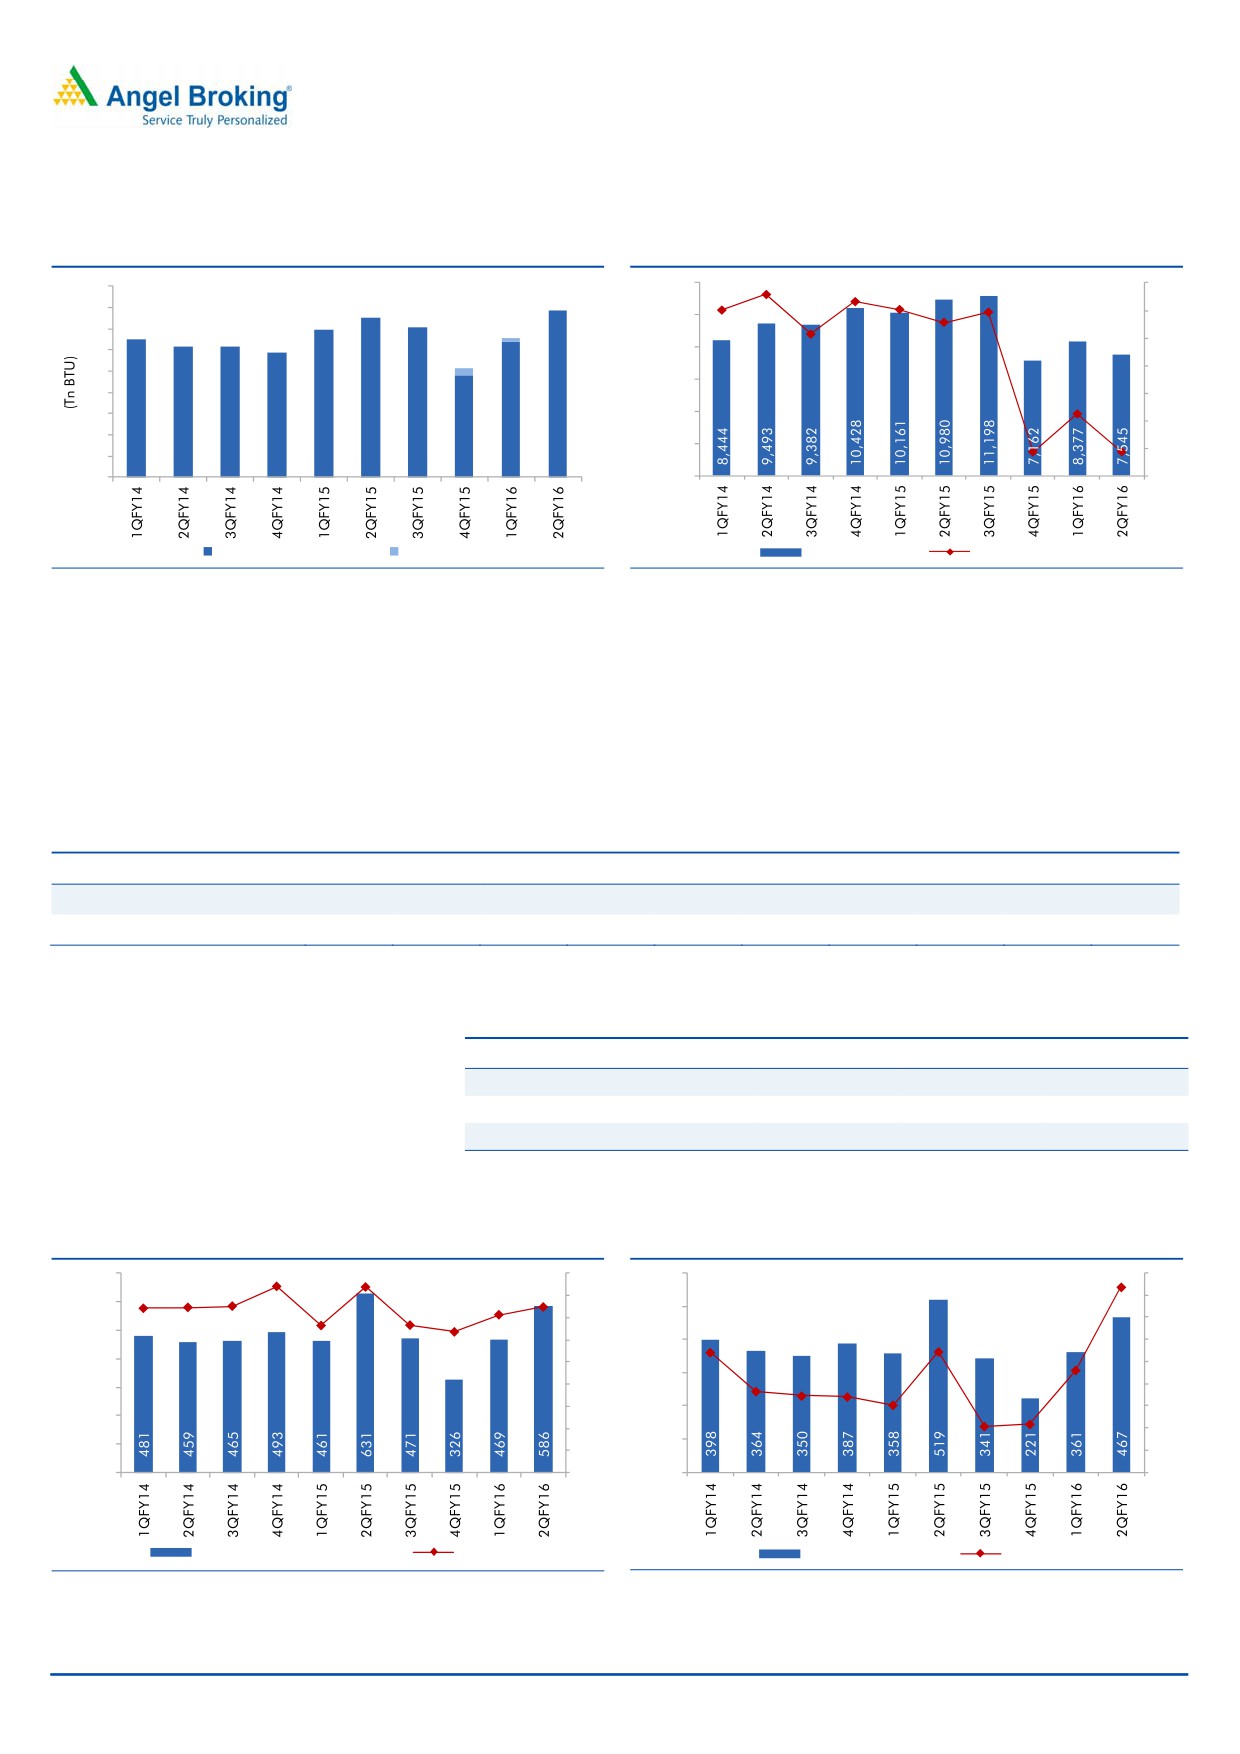
Exhibit 2: Strong volume growth
Exhibit 3: Revenue declines due to lower realisation
180
12,000
30
151
157
160
139
141
130
132
10,000
20
123
124
140
117
10
120
103
8,000
0
100
6,000
80
-10
60
4,000
-20
40
2,000
-30
20
0
0
-40
Regasification Volumes
Reload Volumes
Revenue (` cr)
yoy change (%)
Source: Company, Angel Research
Source: Company, Angel Research
The EBITDA for the quarter came in ahead of our expectation at `467cr, as against
our estimate of `389cr, led by higher-than-expected contribution margin. EBITDA
declined 10% yoy but was up 29% sequentially. Depreciation and finance expenses
were in line with our expectations. The Net profit declined 5% yoy to `249cr, but
remained flat on a sequential basis on account of tax reversals in 1QFY2015
pertaining to prior years under Section 80-IA of the Income Tax Act.
Exhibit 4: Quarterly Performance Trend
1QFY14
2QFY14
3QFY14
4QFY14
1QFY15
2QFY15
3QFY15
4QFY15
1QFY16
2QFY16
Blended Realisation (`/MMBTU)
652
772
759
890
733
730
792
699
637
481
EBITDA (`/MMBTU)
31
30
28
33
26
34
24
22
27
30
Source: Company, Angel Research
Exhibit 5: 2QFY2016 Actual vs. Angel estimates
(` cr)
Actual
Estimates
Variation (%)
Net sales
7,545
7,866
(4.1)
EBITDA
467
389.2
19.9
EBITDA margin (%)
6.2
4.9
50bp
Source: Company, Angel Research
Exhibit 6: High Contribution margin
Exhibit 7: EBITDA margin improves ~150bp yoy
700
42.1
42.0
45
600
6.2
6.5
37.1
37.3
37.6
37.4
35.7
40
6.0
600
33.3
33.3
31.8
500
35
5.5
500
4.7
4.7
30
400
5.0
4.3
400
25
4.5
300
3.8
3.7
3.7
20
3.5
4.0
300
15
200
3.0
3.1
3.5
200
10
3.0
100
100
5
2.5
-
0
-
2.0
Contribution Margin (` cr)
(`/MMBTU)
EBITDA (` cr)
Margin (%)
Source: Company, Angel Research
Source: Company, Angel Research
October 26, 2015
3
Petronet LNG | 2QFY2016 Result Update
Conference Call Highlights
PLNG’s off-take volume from Ras Gas for 9MCY2015 stood at 68% of the
contracted long term volume as the current spot LNG price is significantly
lower than the contracted price. The Management remains positive with
regards to its negotiations with Ras Gas and expects to review the take-or-pay
contract by the year-end. The Management believes that there would be no
risk to the company on account of this take-or-pay contract, as off-takers will
have to pay for any volume shortfall.
Expansion of the Dahej terminal from 10MMTPA to 15MMTPA is going on as
per schedule and the Management expects to complete the capacity expansion
by 2016- end. The company has also initiated the process for selection of EPC
contractors for further expansion of the Dahej terminal’s capacity to
17.50MMTPA.
The Kochi terminal reported an EBITDA loss in the absence of reloading
revenue during the quarter.
Gorgon volumes are to start from mid CY2016 and will be processed at the
Kochi terminal, if the pipelines are ready. In case they are not, then the Dahej
terminal will get utilized.
PLNG once again reiterated that it is not giving any concessions to power
plants and its regas tariffs are based entirely on commercial considerations.
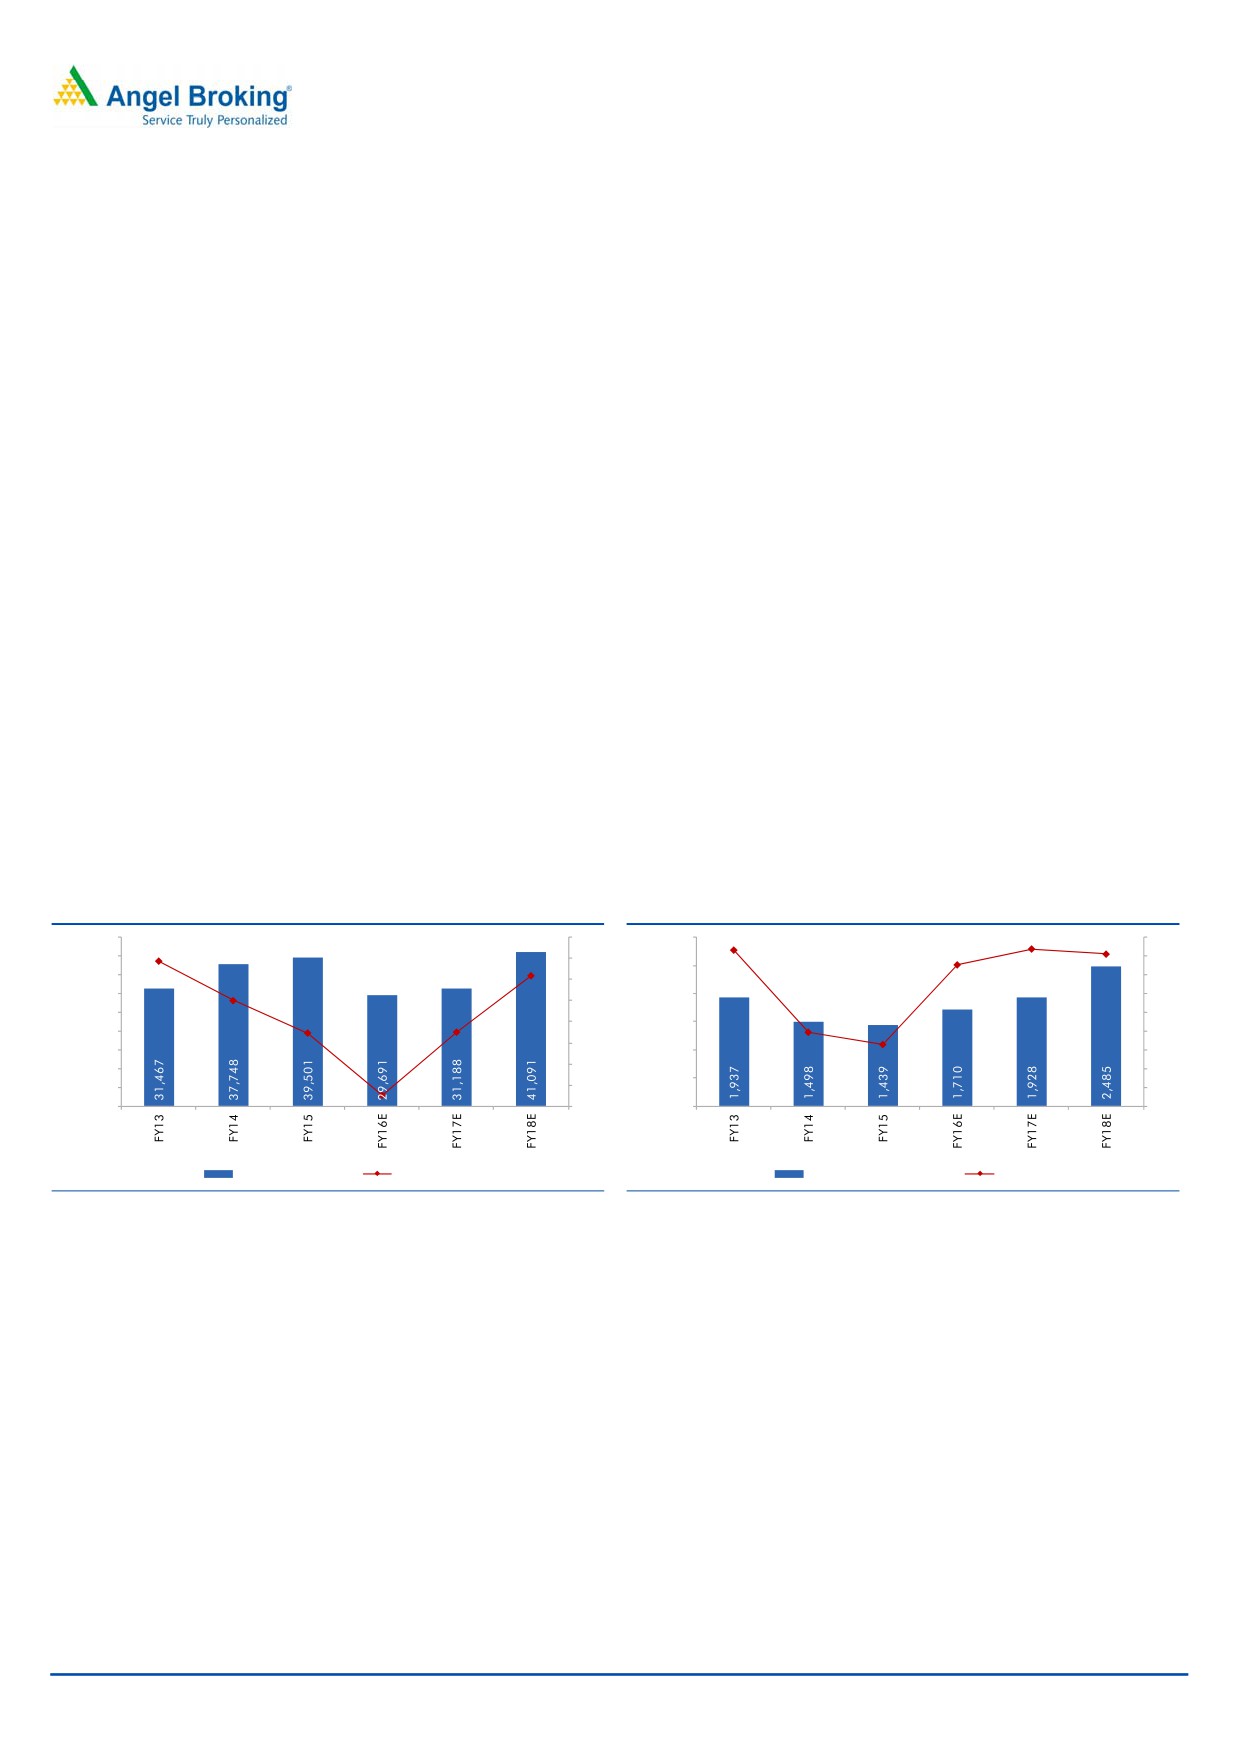
Exhibit 8: Revenue Growth to pick up going forward
Exhibit 9: Higher volumes to drive EBITDA margin
45,000
50
3,000
6.2
6.2
6.0
6.5
5.8
40,000
40
6.0
2,500
35,000
5.5
30
30,000
2,000
5.0
20
25,000
4.0
4.5
10
1,500
20,000
3.6
4.0
0
15,000
1,000
3.5
10,000
-10
3.0
500
5,000
-20
2.5
0
-30
0
2.0
Revenue (` cr)
yoy change (%)
EBITDA (` cr)
Margin (%)
Source: Company, Angel Research
Source: Company, Angel Research
October 26, 2015
4
Petronet LNG | 2QFY2016 Result Update
Investment arguments
Huge demand for gas at lower prices
The demand-supply gap for LNG is expected to increase from ~180mmscmd in
FY2015 to ~285mmscmd by FY2020. If crude prices remain at low levels, this gap
will increase even further. PLNG currently operates ~60% of the country’s LNG
import capacity and is expected to remain the leader over the next five years led by
its expansion at Dahej, which will position it well to benefit from the massive
demand for gas.
Capacity expansion remains on track
PLNG remains on track to expand the Dahej terminal capacity from 10MMTPA to
15MMTPA by the end of CY2016. A major portion of the expansion work is
complete and almost the entire capacity post expansion is already booked, which
would ensure a quick ramp-up in volumes, post commissioning.
High probability of RasGas contract being negotiated
Off-take volumes from RasGas have declined sharply as the LNG pricing formula
will need a long time to reflect the current spot prices (contract price linked to 60M
average oil price) in a low oil price scenario. The Management has clarified that
while the ‘take-or-pay’ provisions would apply, off-takers will have the option to
pay upfront and defer the off-take till the pricing formula reflects the lower prices.
RasGas may then have to refund the excess amount paid by the off-takers.
Deferment of off-take would not be in the interest of either parties and we believe
that RasGas’s Management will take a practical view of this situation and ensure
that the contract is renegotiated.
October 26, 2015
5
Petronet LNG | 2QFY2016 Result Update
Outlook and valuation
PLNG is a direct play on the gas deficit story in India. The company’s strong
expansion plan makes it well positioned to benefit from the demand-supply gap.
However, near term concerns such as declining off-take volumes from RasGas and
delays in the Kochi - Bangalore pipeline, which is critical for the ramp up at the
Kochi terminal, weigh on the stock. The stock currently trades at 15.1x and 14.5x
its FY2016E and FY2017E EPS.
We use DCF to arrive at our target price of `210 and retain our Accumulate rating
on the stock.
Exhibit 10: DCF valuation
(` cr)
WACC
11.5%
PV of forecast period FCF (till FY25)
8,495
Terminal Growth
2.5%
PV of Terminal Value
9,436
Enterprise Value
17,930
Less: Net Debt (FY16E)
2,216
Equity Value
15,715
Shares (cr)
75
Target Price
210
Source: Angel Research
Company background
Formed as a joint venture by the Government of India to import LNG and set up
LNG terminals in the country, PLNG was promoted by GAIL (India) Ltd (GAIL), Oil
& Natural Gas Corporation Limited (ONGC), Indian Oil Corporation Limited
(IOCL) and Bharat Petroleum Corporation Limited (BPCL). PLNG has set up India’s
first LNG receiving and regasification terminal at Dahej, Gujarat, and another
terminal at Kochi, Kerala. While the Dahej terminal has a nominal capacity of
10MMTPA [equivalent to 40mmscmd of natural gas], the Kochi terminal has a
capacity of 5MMTPA [equivalent to 20mmscmd of natural gas]. The company is in
the process to build a third terminal at Gangavaram, Andhra Pradesh.
October 26, 2015
6
Petronet LNG | 2QFY2016 Result Update
Profit & Loss Statement (Standalone)
Y/E March (` cr)
FY2013
FY2014
FY2015
FY2016E FY2017E
Net Sales
31,297
37,545
39,093
28,900
30,357
Other operating income
170
203
408
791
830
Total operating income
31,467
37,748
39,501
29,691
31,188
% chg
38.6
20.0
4.6
(24.8)
5.0
Total Expenditure
29,531
36,249
38,062
27,981
29,259
Net Raw Materials
29,212
35,849
37,611
27,565
28,822
Other Mfg costs
282
353
394
354
372
Personnel
37
47
57
62
65
Other
-
-
-
-
-
EBITDA
1,937
1,498
1,439
1,710
1,928
% chg
5.9
(22.6)
(4.0)
18.9
12.7
(% of Net Sales)
6.2
4.0
3.6
5.8
6.2
Depreciation& Amortisation
187
308
315
322
394
EBIT
1,750
1,190
1,124
1,388
1,534
% chg
6.4
(32.0)
(5.6)
23.5
10.5
(% of Net Sales)
5.6
3.2
2.8
4.7
4.9
Interest & other Charges
118
220
293
245
244
Other Income
89
84
155
141
148
Share in profit of Associates
-
-
-
-
-
Recurring PBT
1,720
1,055
985
1,285
1,438
% chg
10.8
(38.7)
(6.6)
30.4
12.0
Extraordinary Inc/(Expense)
-
-
-
-
-
PBT (reported)
1,720
1,055
985
1,285
1,438
Tax
571
343
102
326
432
(% of PBT)
33.2
32.5
10.4
25.4
30.0
PAT (reported)
1,149
712
883
959
1,007
% chg
8.7
(38.1)
24.0
8.6
5.0
(% of Net Sales)
3.7
1.9
2.2
3.2
3.2
Basic EPS (`)
15.3
9.5
11.8
12.8
13.4
% chg
8.7
(38.1)
24.0
8.6
5.0
October 26, 2015
7
Petronet LNG | 2QFY2016 Result Update
Balance Sheet (Standalone)
Y/E March (` cr)
FY2013
FY2014
FY2015
FY2016E FY2017E
SOURCES OF FUNDS
Equity Share Capital
750
750
750
750
750
Reserves & Surplus
3,700
4,236
4,939
5,678
6,465
Shareholders Funds
4,450
4,986
5,689
6,428
7,215
Total Loans
3,034
3,267
2,674
2,941
2,794
Deferred Tax Liability
391
553
727
922
1,181
Other Long term liabilities
3
304
604
604
604
Total Liabilities
7,878
9,110
9,694
10,896
11,795
APPLICATION OF FUNDS
Gross Block
3,580
7,795
7,954
8,114
11,584
Less: Acc. Depreciation
1,222
1,530
1,845
2,167
2,562
Net Block
2,358
6,265
6,110
5,946
9,023
Capital Work-in-Progress
4,331
880
1,580
2,671
250
Goodwill
0
0
0
0
0
Investments
140
140
90
90
90
Current Assets
4,137
4,376
2,665
2,654
2,998
Cash
1,269
1,233
364
725
844
Loans & Advances
1,037
956
883
691
726
Other
1,832
2,187
1,419
1,237
1,428
Current liabilities
3,205
2,803
1,425
1,139
1,239
Net Current Assets
933
1,573
1,240
1,515
1,759
Other Assets
117.3
252.0
673.9
673.9
673.9
Total Assets
7,878
9,110
9,694
10,896
11,795
October 26, 2015
8
Petronet LNG | 2QFY2016 Result Update
Cash flow statement (Standalone)
Y/E March (` cr)
FY2013
FY2014
FY2015
FY2016E FY2017E
Profit before tax
1,720
1,055
985
1,285
1,438
Depreciation
187
308
315
322
394
Change in Working Capital
404
(353)
(536)
87
(125)
Others
51
146
48
0
0
Direct taxes paid
(539)
(193)
(102)
(130)
(173)
Cash Flow from Operations
1,823
964
710
1,563
1,535
(Inc.)/ Dec. in Fixed Assets
(841)
(876)
(860)
(1,250)
(1,050)
(Inc.)/ Dec. in Investments
-
11.6
49.9
-
-
Share of profit/ (loss) from asso.
72
62
0
0
0
Cash Flow from Investing
(769)
(803)
(810)
(1,250)
(1,050)
Issue of Equity
-
-
-
-
-
Inc./(Dec.) in loans
(242)
205
(593)
267
(147)
Dividend Paid (Incl. Tax)
(218)
(219)
(176)
(219)
(219)
Others
(310)
(182)
-
-
-
Cash Flow from Financing
(770)
(197)
(769)
48
(367)
Inc./(Dec.) in Cash
285
(36)
(869)
361
119
Opening Cash balances
984
1,269
1,233
364
725
Closing Cash balances
1,269
1,233
364
725
844
October 26, 2015
9
Petronet LNG | 2QFY2016 Result Update
Key ratios
Y/E March
FY2013
FY2014
FY2015
FY2016E
FY2017E
Per Share Data (`)
Reported EPS
15.3
9.5
11.8
12.8
13.4
Cash EPS
17.8
13.6
16.0
17.1
18.7
DPS
2.5
2.0
2.5
2.5
2.5
Book Value
59.3
66.5
75.8
85.7
96.2
Valuation Ratio (x)
P/E (on FDEPS)
12.6
20.3
16.4
15.1
14.4
P/CEPS
10.8
14.2
12.1
11.3
10.3
P/BV
3.2
2.9
2.5
2.2
2.0
Dividend yield (%)
1.3
1.0
1.3
1.3
1.3
EV/Sales
0.5
0.4
0.4
0.6
0.5
EV/EBITDA
8.4
11.0
11.7
9.7
8.5
EV/Total Assets
2.1
1.8
1.7
1.5
1.4
Returns (%)
ROCE
24.5
15.1
13.5
15.7
15.8
ROE
28.8
15.1
16.5
15.8
14.8
Turnover ratios (x)
Asset Turnover (Gross Block)
8.8
6.6
5.0
3.7
3.2
Inventory (days)
10.1
9.6
8.5
9.7
8.3
Receivables (days)
17.3
17.9
15.5
15.5
14.9
Payables (days)
27.8
26.6
17.4
13.5
11.8
WC cycle (ex-cash) (days)
11.5
12.1
13.0
16.9
19.2
Solvency ratios (x)
Net debt to equity
0.4
0.4
0.4
0.3
0.3
Net debt to EBITDA
0.6
0.6
0.9
0.8
0.7
Interest Coverage (EBIT / Int.)
14.8
5.4
3.8
5.7
6.3
October 26, 2015
10
Petronet LNG | 2QFY2016 Result Update
Research Team Tel: 022 - 39357800
DISCLAIMER
Angel Broking Private Limited (hereinafter referred to as “Angel”) is a registered Member of National Stock Exchange of India Limited,
Bombay Stock Exchange Limited and Metropolitan Stock Exchange of India Limited. It is also registered as a Depository Participant with
CDSL and Portfolio Manager with SEBI. It also has registration with AMFI as a Mutual Fund Distributor. Angel Broking Private Limited is
a registered entity with SEBI for Research Analyst in terms of SEBI (Research Analyst) Regulations, 2014 vide registration number
INH000000164. Angel or its associates has not been debarred/ suspended by SEBI or any other regulatory authority for accessing
/dealing in securities Market. Angel or its associates including its relatives/analyst do not hold any financial interest/beneficial
ownership of more than 1% in the company covered by Analyst. Angel or its associates/analyst has not received any compensation /
managed or co-managed public offering of securities of the company covered by Analyst during the past twelve months. Angel/analyst
has not served as an officer, director or employee of company covered by Analyst and has not been engaged in market making activity
of the company covered by Analyst.
This document is solely for the personal information of the recipient, and must not be singularly used as the basis of any investment
decision. Nothing in this document should be construed as investment or financial advice. Each recipient of this document should
make such investigations as they deem necessary to arrive at an independent evaluation of an investment in the securities of the
companies referred to in this document (including the merits and risks involved), and should consult their own advisors to determine
the merits and risks of such an investment.
Reports based on technical and derivative analysis center on studying charts of a stock's price movement, outstanding positions and
trading volume, as opposed to focusing on a company's fundamentals and, as such, may not match with a report on a company's
fundamentals.
The information in this document has been printed on the basis of publicly available information, internal data and other reliable
sources believed to be true, but we do not represent that it is accurate or complete and it should not be relied on as such, as this
document is for general guidance only. Angel Broking Pvt. Limited or any of its affiliates/ group companies shall not be in any way
responsible for any loss or damage that may arise to any person from any inadvertent error in the information contained in this report.
Angel Broking Pvt. Limited has not independently verified all the information contained within this document. Accordingly, we cannot
testify, nor make any representation or warranty, express or implied, to the accuracy, contents or data contained within this document.
While Angel Broking Pvt. Limited endeavors to update on a reasonable basis the information discussed in this material, there may be
regulatory, compliance, or other reasons that prevent us from doing so.
This document is being supplied to you solely for your information, and its contents, information or data may not be reproduced,
redistributed or passed on, directly or indirectly.
Neither Angel Broking Pvt. Limited, nor its directors, employees or affiliates shall be liable for any loss or damage that may arise from
or in connection with the use of this information.
Note: Please refer to the important ‘Stock Holding Disclosure' report on the Angel website (Research Section). Also, please refer to the
latest update on respective stocks for the disclosure status in respect of those stocks. Angel Broking Pvt. Limited and its affiliates may
have investment positions in the stocks recommended in this report.
Disclosure of Interest Statement
Petronet LNG
1. Analyst ownership of the stock
No
2. Angel and its Group companies ownership of the stock
No
3. Angel and its Group companies' Directors ownership of the stock
No
4. Broking relationship with company covered
No
Note: We have not considered any Exposure below ` 1 lakh for Angel, its Group companies and Directors
Ratings (Based on expected returns
Buy (> 15%)
Accumulate (5% to 15%)
Neutral (-5 to 5%)
over 12 months investment period):
Reduce (-5% to -15%)
Sell (< -15)
October 26, 2015
11