4QFY2016 Result Update | Infrastructure
June 8, 2015
PNC Infratech
ACCUMULATE
CMP
`570
Performance Highlights
Target Price
`647
Quarterly highlights - Standalone
Investment Period
12 Months
Y/E March (` cr)
4QFY16 3QFY16
% chg (qoq)
4QFY15
% chg (yoy)
Net sales
585
518
12.9
459
27.4
Stock Info
EBITDA
73
64
13.6
56
30.6
Sector
Infrastructure
Market Cap (` cr)
2,924
Reported PAT
115
32
253.7
33
250.0
Source: Company, Angel Research
Net debt (` cr)
(91)
Beta
0.9
For 4QFY2016, PNC Infratech (PNC) reported a top-line growth of 27.4% while
52 Week High / Low
612/361
the bottom-line grew by a substantial 250% yoy. The top-line growth was driven
Avg. Daily Volume
33,225
by strong execution across Agra-Firozabad and other road projects. Stronger
Face Value (`)
10
execution and yoy decline in employee expenses led to a 31bp yoy expansion in
the EBITDA margin to 12.5%. A 30.6% yoy EBITDA growth coupled with tax
BSE Sensex
26,777
reversals and MAT credit led the PAT to grow by 250% yoy. The PAT margin, at
Nifty
8,201
19.6%, rose significantly on a yoy basis.
Reuters Code
PNCI.BO
Bloomberg Code
PNCL@IN
PNC’s unexecuted order book as of 4QFY2016 stands at `5,797cr (order book
to LTM sales ratio stands at 2.7x).
All the BOT projects are now operational as of FY2016-end. The Management
Shareholding Pattern (%)
has indicated that it does not intend to add any new BOT projects in FY2017-18
Promoters
56.1
unless a lucrative project in north India comes up within the `500cr ticket size. As
MF / Banks / Indian Fls
13.9
a result, we are of the view that PNC’s consolidated D/E ratio would peak out in
FII / NRIs / OCBs
6.5
FY2017E.
Indian Public / Others
23.6
Outlook and valuation: Considering the strong uptick in roads and highways EPC
award activity especially in north India, where PNC has more comfort, and given
Abs. (%)
3m 1yr 3yr
its past track record and recent wins, we expect the standalone entity to report
Sensex
8.6
1.0
37.0
20.1% top-line CAGR over FY2015-2017E. With normal tax rate applicable from
PNC Infratech
16.2
50.2
NA
FY2018, the bottom-line growth would be of -5.3% CAGR during the same
*NA as PNC listed on May 26, 2015
period. Accordingly, the RoEs would decline from 23.3% in FY2016 to 13.2% in
FY2018E. We are also now comforted that the consolidated Balance Sheet would
3-Year Daily Price Chart
peak from FY2017E onwards. Using the SoTP valuation methodology we arrive
600
at a FY2018E based price target of `647. Given the 13% upside in the stock form
the current levels, we maintain our Accumulate rating on the stock.
550
500
Key financials (Standalone)
Y/E March (` cr)
FY14
FY15
FY16
FY17E
FY18E
450
Net Sales
1,145
1,561
2,014
2,350
2,904
400
% chg
(12.1)
36.3
29.0
16.7
23.6
350
Net Profit
67
100
243
245
218
% chg
(12.6)
50.2
141.9
1.1
(11.3)
EBITDA (%)
12.2
13.9
13.2
13.4
13.7
EPS (`)
17
25
47
48
42.4
Source: Company, Angel Research
P/E (x)
34.0
22.6
12.0
11.9
13.4
P/BV (x)
3.6
3.2
2.1
1.9
0.0
RoE (%)
11.2
14.9
23.3
16.8
13.2
RoCE (%)
15.0
20.2
19.4
17.1
18.3
Yellapu Santosh
EV/Sales (x)
2.1
1.6
1.4
1.3
1.1
022 - 3935 7800 Ext: 6811
EV/EBITDA (x)
17.3
11.9
10.7
10.1
8.0
Source: Company, Angel Research; Note: CMP as of June 6, 2015
Please refer to important disclosures at the end of this report
1
PNC Infratech | 4QFY2016 Result Update
Exhibit 1: Quarterly Standalone Performance
Particulars (` cr)
4QFY16
3QFY16
% chg (qoq)
4QFY15
% chg (yoy)
FY16
FY15
% chg (yoy)
Net Sales
585
518
12.9
459
27.4
1,992
1,530
30.2
Total Expenditure
512
454
12.8
403
27.0
1,748
1,344
30.0
Cost of materials consumed
394
388
1.5
377
4.4
1,434
1,196
19.9
Changes in Inv. Of FG & WIP
24
(2)
nmf
(35)
nmf
35
(60)
nmf
Employee Benefits Expense
21
22
(2.5)
24
(9.6)
84
74
13.4
Other Expenses
73
46
60.0
38
94.2
196
135
45.2
EBITDA
73
64
13.6
56
30.6
244
186
31.3
EBIDTA %
12.5
12.4
12.2
12.2
12.1
Depreciation
14
14
3.5
11
35.4
52
36
44.3
EBIT
59
51
16.4
45
29.5
191
149
28.1
Interest and Fin. Charges
9
8
9.5
11
(19.1)
33
46
(28.1)
Other Income
15
7
114.4
13
19.3
42
45
(5.5)
PBT before Exceptional Items
65
49
31.4
47
38.0
200
148
35.6
Exceptional Items
0
0
0
0
0
PBT after Exceptional Items
65
49
31.4
47
38.0
200
148
35.6
Tax
(50)
17
14
(42)
47
% of PBT
(76.4)
34.4
30.4
(21.1)
32.1
PAT
115
32
253.7
33
250.0
243
100
141.9
PAT %
19.6
6.3
7.1
12.2
6.6
Dil. EPS (after extra-ord. Items)
29.96
6.32
374.1
8.24
263.6
48.77
25.21
93.5
Source: Company, Angel Research
Standalone Business Review
Strong execution seen during the quarter
PNC witnessed strong execution during 4QFY2016. The company reported a
strong 27.4% yoy top-line growth to `585cr. Agra-Firozabad (`347cr), Sonauli-
Gorakhpur and Barabanki-Jarwal projects majorly contributed to the 4QFY2016
revenues.
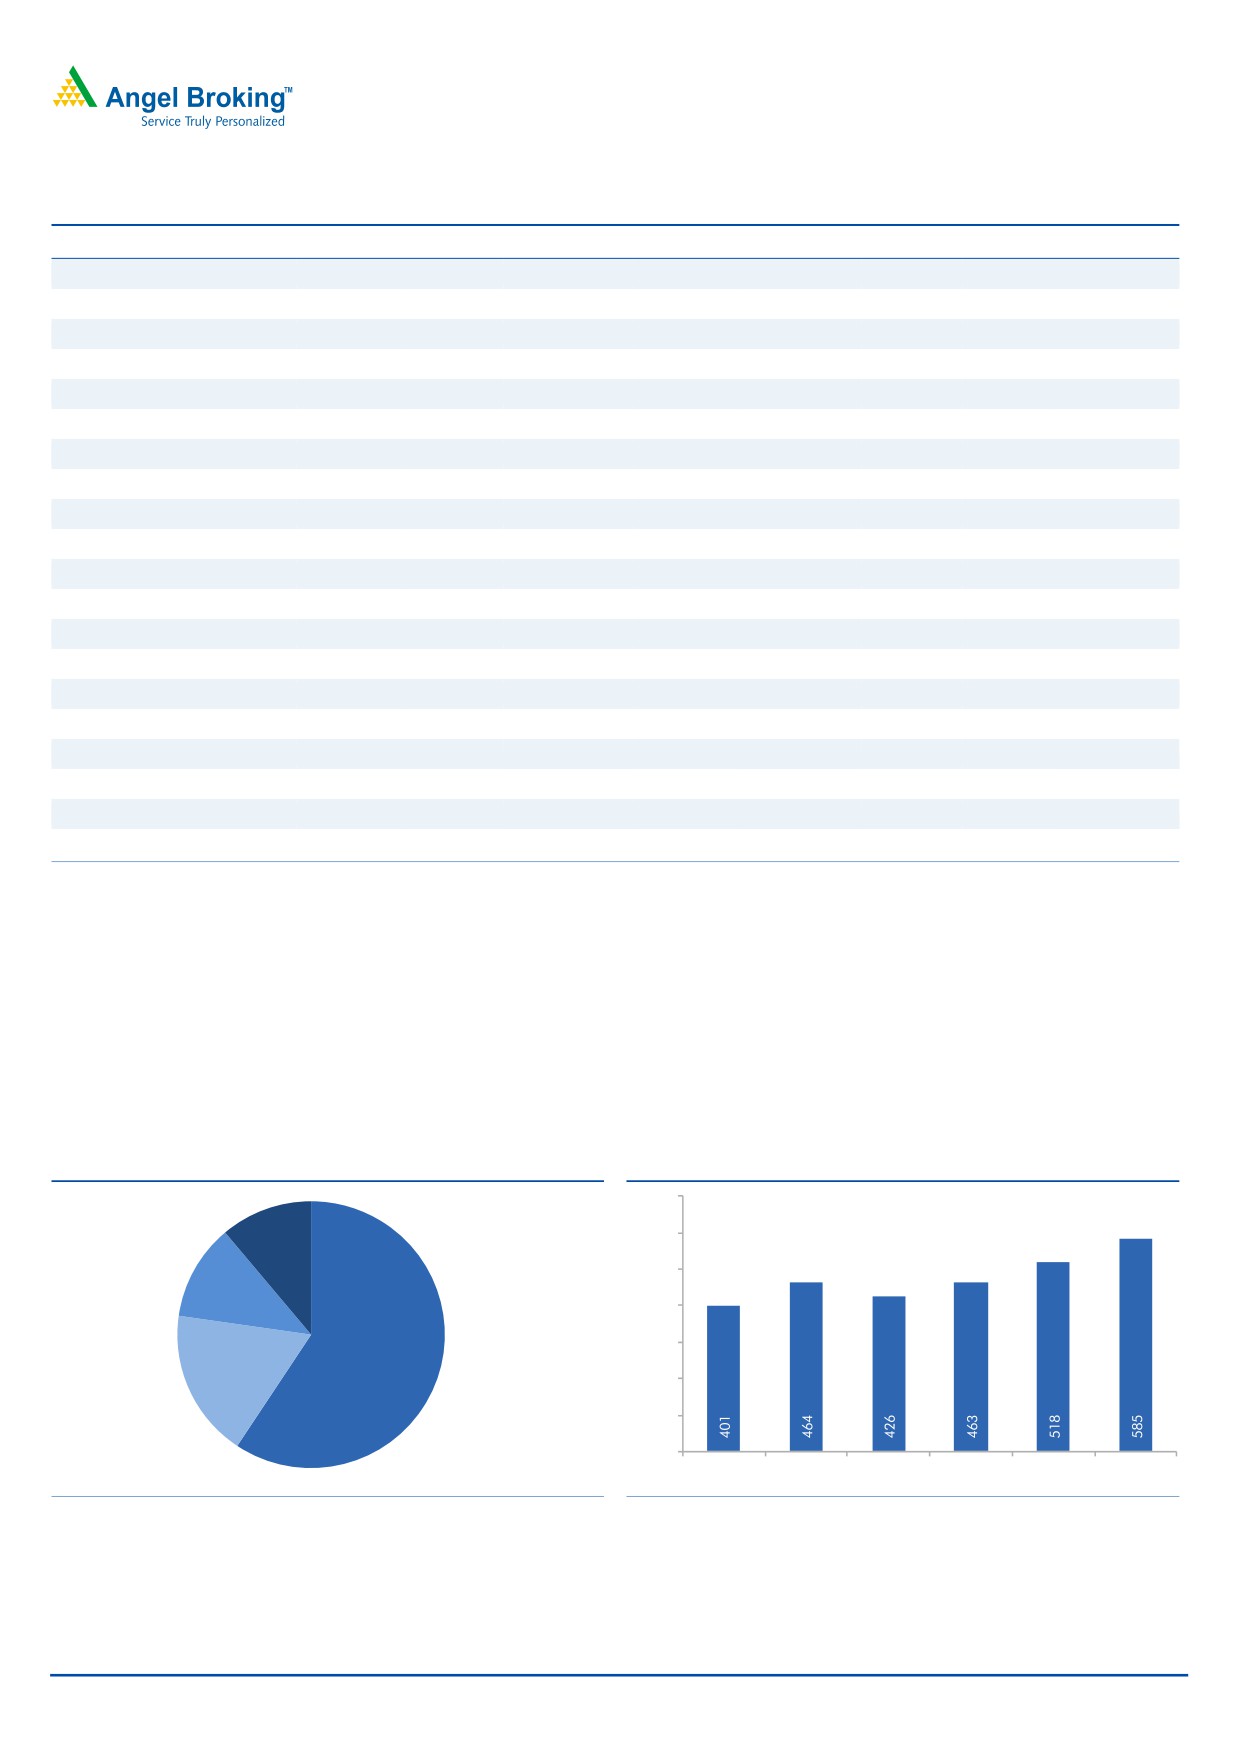
Exhibit 2: 4QFY2016 Revenue-Mix
Exhibit 3: Quarterly Revenue performance
700
Other
600
Projects,
11.1%
500
Barabanki-
Jarwal, 11.6%
400
Agra-
300
Sonauli-
Firozabad,
Gorakhpur,
59.3%
200
17.9%
100
0
3QFY15
4QFY15
1QFY16
2QFY16
3QFY16
4QFY16
Source: Company, Angel Research
Source: Company, Angel Research
June 8, 2016
2
PNC Infratech | 4QFY2016 Result Update
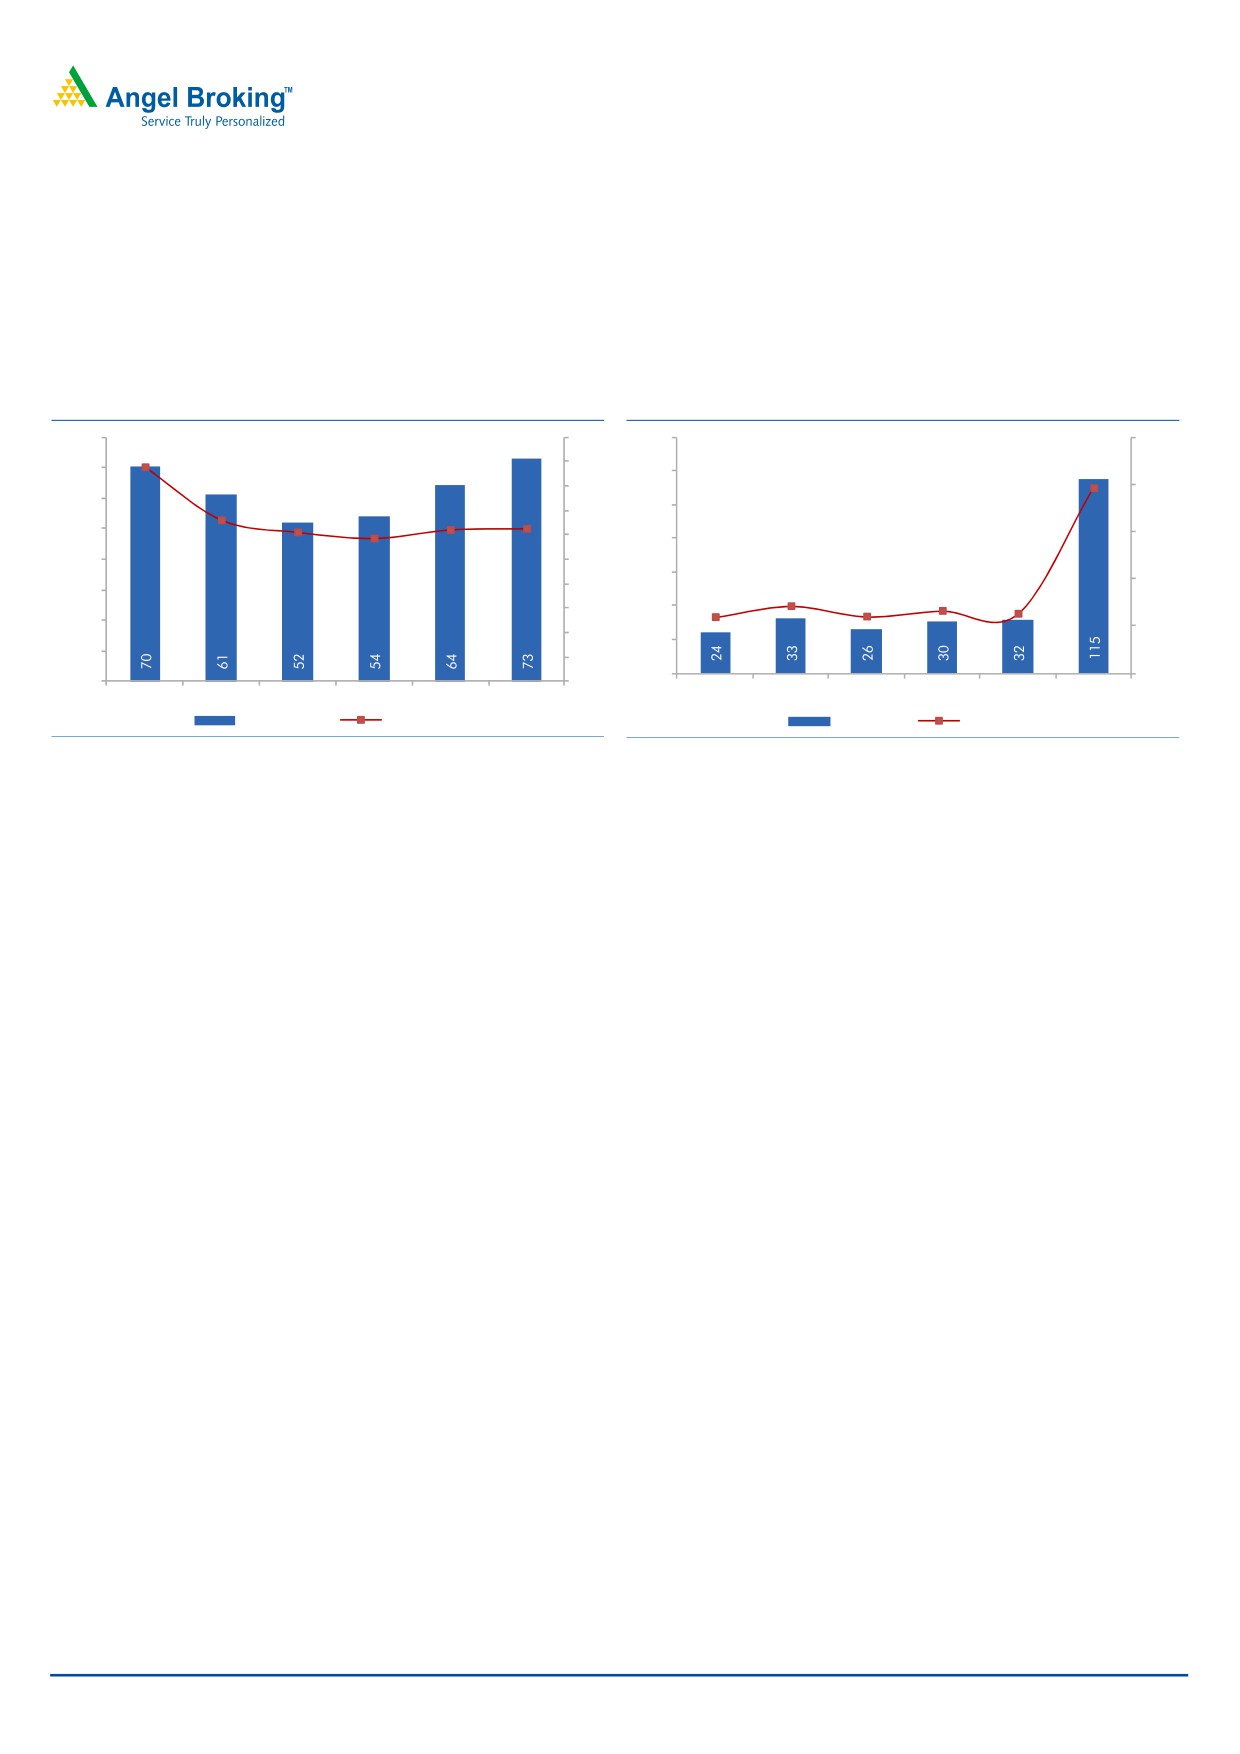
EBITDA margin expands to 12.5%
On the operating front, PNC reported an EBITDA of `73cr, reflecting an EBITDA
margin of 12.5% for the quarter. The reported EBITDA margin expanded 31bp yoy
to 12.5%. Strong execution coupled with 9.6% decline in employee expenses led to
a yoy EBITDA margin expansion.
Exhibit 4: EBITDA margin expands to 12.5%
Exhibit 5: PAT Margin expands to 19.6%
80
20
140
25.0
17.5
12.5
18
70
120
19.6
12.4
13.2
16
20.0
60
11.7
100
12.2
14
50
15.0
12
80
40
10
60
8
7.1
6.0
6.6
6.3
10.0
30
5.9
6
40
20
5.0
4
20
10
2
0
0.0
0
0
3QFY15
4QFY15
1QFY16
2QFY16
3QFY16
4QFY16
3QFY15
4QFY15
1QFY16
2QFY16
3QFY16
4QFY16
EBITDA (` cr)
EBITDA Margins (%)
PAT (` cr)
PAT Margins (%)
Source: Company, Angel Research
Source: Company, Angel Research
PAT margin also expands yoy to 19.6%
PNC reported a strong PAT at `115cr for the quarter. The reported PAT margin
came in at 19.6%, ahead of 7.1% in the corresponding quarter a year ago and
6.3% in the sequential previous quarter. The PAT on a yoy basis benefitted from (1)
write back of excess tax provisions (`15.2cr), recognition of MAT credit (`23.7cr),
(2) 19.3% yoy increase in other income (to `15cr) and (3) 19.1% decline in interest
expenses to `9cr (on the back of decline in yoy debt to `6cr).
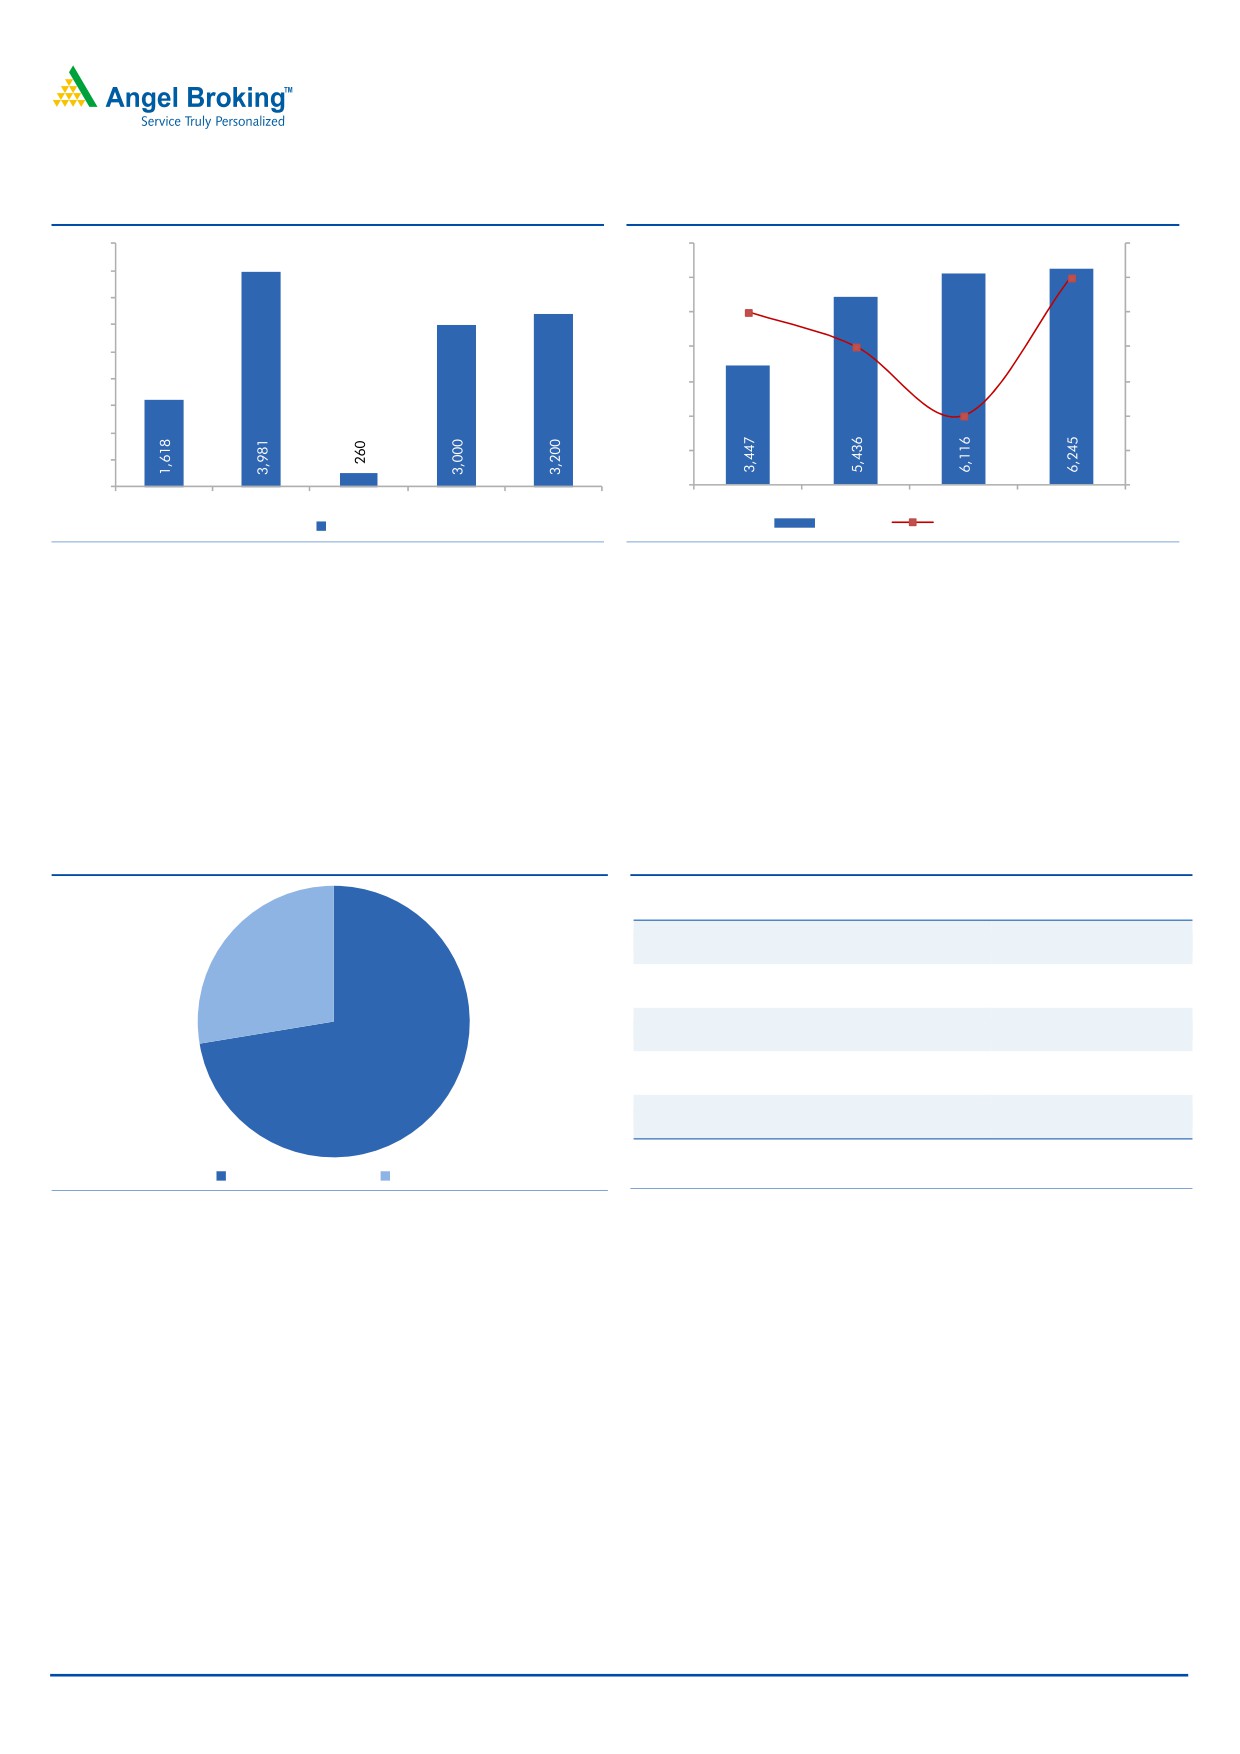
Order inflows continue to grow
In FY2016, PNC reported a 146% yoy increase in net order inflows to `3,972cr.
These include 6 highway projects and 1 airport runway project (has received letter
of award for all the 7 projects). Further, YTDFY2017, PNC has either won/is L1 for
projects worth ~`260cr.
2 projects currently at L1 stage include- (1) extension and resurfacing of runway at
Air Force Station, Bakshi Ka Talab, near Lucknow worth `140.6cr from Military
Engineering Services, India, and (2) upgradation of Nanau-Dodon section in the
district of Aligarh, Uttar Pradesh worth `119.9cr by UP PWD.
June 8, 2016
3
PNC Infratech | 4QFY2016 Result Update
Exhibit 6: YTD Order Inflows stand at ~`260cr
Exhibit 7: Order Book gives strong revenue visibility
4,500
7,000
0.33x
0.3x
4,000
6,000
0.32x
0.3x
3,500
5,000
0.31x
3,000
0.3x
2,500
4,000
0.30x
2,000
3,000
0.29x
0.3x
1,500
2,000
0.28x
1,000
1,000
0.27x
500
0
0
0.26x
FY2015
FY2016
YTDFY2017
FY2017E
FY2018E
FY15
FY16
FY17E
FY18E
OI (` cr)
OB (` cr)
Execution Rate (x)
Source: Company, Angel Research
Source: Company, Angel Research
The Management expects the company to benefit from an uptick in NHAI &
MoRTH’s award activity and has given an order inflow guidance of ~`5,000cr for
FY2017E. The guidance is backed by a strong bid pipeline emerging from NHAI &
MoRTH side (especially from Uttar Pradesh, Haryana, Madhya Pradesh).
PNC’s unexecuted order book (including L1 order wins) as of 4QFY2016 stands at
`5,797cr (order book to LTM ratio stands at 2.7x). The Roads & Highways vertical
continues to dominate the order book mix.
Exhibit 8: Top 5-projects as % of total Order Book
Exhibit 9: Details of Top-5 projects being executed
O/s Total Project
Project details
Value (` cr)
Nagina-Kashipur
1,156
28%
Varanasi-Gorakhpur
869
83%
Agra-Firozabad
860
Aligarh-Moradabad
645
Bhojpur-Buxar
477
Top 5-projects
4,007
Top 5 projects
Other Projects
Source: Company, Angel Research
Source: Company, Angel Research
June 8, 2016
4
PNC Infratech | 4QFY2016 Result Update
Update on BOT projects
PNC currently has 8 BOT/OMT assets which are at different stages of execution.
Of these, 1 is a BOT-Annuity project, 1 is an industrial estate maintenance project
(BOT-Annuity + Fee model), 1 is an OMT project, and the remaining 5 are BOT-
Toll projects. Notably, all 8 BOT projects are Uttar Pradesh (UP) or Central/North
India based. 5 of these BOT projects have been won on Viability Gap Funding
(VGF) basis, amidst competition.
Currently all 7 BOT projects are operational (Rae Bareli-Jaunpur BOT project
commenced operations 98 days before the scheduled CoD of June-2016). On Jan
2, 2016, PNC completed the sale of its 8.5% stake in Jaora-Nayagaon Toll Road
Company for `34.19cr for a profit of `9.7cr.
Exhibit 10: BOT Projects Status (at 2QFY2016-end)
PNC
Length
PNC Equity
BOT projects
Proj. Type
Status
TPC
Stake (%)
(kms)
Invested to-date
Ghaziabad-Aligarh
Toll
35%
Operational
125
2,000
68
Kanpur-Kabrai
Toll
100%
Operational
123
458
68
Gwalior-Bhind
Toll
100%
Operational
108
340
78
Bareilly-Almora
Toll
100%
Operational
54
604
75
Rae Bareli-Jaunpur
Annuity
100%
Under Const.
166
837
140
Narela Industrial Estate
Annuity + Fee
100%
Operational
NA
175
35
OMT projects
Kanpur-Ayodhya
Toll
100%
Operational
217
0
0
Source: Company, Angel Research
With all 7 BOT projects operational PNC does not have any equity commitments
pending towards the BOT projects.
Kanpur-Ayodhya OMT project during 4QFY2016 collected `64cr of gross toll
income, which in our estimate is an 11% yoy increase.
For Ghaziabad-Aligarh BOT project, PNC reported toll income of ~`40lakh/day.
The Management expects tolling from this BOT to catch-up in the next 3-6 months,
(1) once the entire road stretch gets operational (currently does only partial tolling);
and (2) on implementation of over-loading charges.
Risks & Concerns
Delay in order wins could pose as a risk to our estimates.
Roads & Highways account for substantial chunk of the order book. Slowdown
in orders from NHAI / State governments could affect company’s order inflow
adversely.
PNC's order book comes majorly from North India. Any slowdown in orders
from this region may impact our order inflow assumption for the company.
June 8, 2016
5
PNC Infratech | 4QFY2016 Result Update
Outlook & Valuation
Considering strong execution trends exhibited by PNC, uptick in NHAI and MoRTH
awarding momentum, when coupled with recent NHAI announcements, we expect
further uptick in execution from here-on. Accordingly, we revise our FY2017E
revenue estimate to
`2,350cr and roll-out FY2018E estimate at
`2,904cr,
respectively (revenue CAGR of 20.1% over FY2016-18E). Given that recent order
wins have been at disciplined bidding, we expect EBITDA margins to expand from
13.2% in FY2016 to 13.7% in FY2018E. With Management clarifying that they
would avail MAT credit in FY2017E, we are sharply revising upwards our FY2017E
PAT estimate to `245cr. On the whole, we expect PNC to report -5.3% PAT CAGR
during FY2016-18E to `218cr.
Exhibit 11: Earnings Revision
FY2017E
FY2018E
Y/E March (` cr)
Old
New
Chg (%)
Old
Net Sales
2,288
2,350
2.7
2,904
EBITDA
309
315
1.9
396
EBITDA Margins (%)
13.5
13.4
13.6
PAT
166
245
47.6
218
PAT Margins (%)
7.2
6.4
7.5
Source: Angel Research
Value of Core EPC business
With applicability of normal tax rates from FY2018 onwards, we do not see a
scenario where the entire growth prospects of EPC segment (given expected uptick
in Roads and Highways award activity environment, current OB/LTM sales ratio of
2.7x), trickling down to the PAT level. We now expect PNC’s EPC business to report
20.1% top-line and -5.3% bottom-line CAGR during FY2016-18E, respectively. On
the same lines we expect RoEs of the standalone business to decline from 23.3% in
FY2016 to 13.2% in FY2018E. Accordingly, we have valued PNC’s core EPC
business (standalone entity) on P/E of 13.0x its FY2018E EPS of `42.4, resulting in
a value of `551/share.
June 8, 2016
6
PNC Infratech | 4QFY2016 Result Update
Exhibit 12: Sum-of-the-Parts based Valuation Table
Value/
FY18E Std.
Target
Target Value
% of
Particulars
Segment
share
Basis
PAT (` cr)
Multiple
(` cr)
SoTP
(`)
PNC's EPC business
Construction
218
13.0
2,829
551
85 P/E of 13x
Total
2,829
551
85
Equity
Adj. Equity
Value/
Project
% of
Particulars
Proj. Type
Invested/ Disc.
Disc. FCFE
share
Basis
Stake
SoTP
FCFE (` cr)
(` cr)
(`)
Road BOT projects
Ghaziabad-Aligarh
Toll
194
35%
68
13
2
BV/share- 1.0x
Kanpur-Kabrai
Toll
68
100%
68
13
2
BV/share- 1.2x
Gwalior-Bhind
Toll
78
100%
78
15
2
BV/share- 1.0x
Bareilly-Almora
Toll
75
100%
75
15
2
BV/share- 1.0x
Rae Bareli-Jaunpur
Annuity
140
100%
140
27
4
BV/share- 1.0x
Narela Industrial Estate
Annuity+Fee
35
100%
35
7
1
BV/share- 1.1x
Kanpur Ayodhya
OMT
25
100%
25
5
1
FCFE, discount rate at 14%
Total
901
488
95
15
Grand Total
3,317
647
100
Upside
13%
CMP
570
Source: Company, Angel Research
Value of BOT projects
BOT projects have been valued using Book Value/Free Cash flow to Equity
holder’s method. Our value for all the 8 BOT projects comes to `85/share, which
is 15% of the overall SOTP value for the company.
On combining the value of EPC business BOT projects, we arrive at a combined
business value of `647/share, reflecting 13% upside in stock price from the current
levels. Given the upside, we maintain our ACCUMULATE rating on the stock.
June 8, 2016
7
PNC Infratech | 4QFY2016 Result Update
Investment arguments
Strong order inflows to lead to better execution: PNC, a north focused EPC
player, should gain from a sharp revival in NHAI and MoRTH award activity,
in-turn translating into strong order inflows over the next 12 months. We
expect PNC to report order inflows of
`3,000/3,200cr during
FY2017E/2018E, which should further lead to uptick in execution. Accordingly,
we expect PNC (on standalone basis) to report a strong 20.1% top-line CAGR
during FY2016-18E.
-5.3% PAT CAGR during FY2016-18E: Stronger execution, benefits of lower
raw material prices and absorption of fixed costs, should help PNC
(standalone entity) report 22.1% EBITDA CAGR during FY2016-18E. Entire
benefits of EBITDA growth would not trickle down to the PAT level, as the
normal tax rate would be applicable from FY2018 onwards. Accordingly, we
now expect PNC to report -5.3% PAT CAGR during the same period.
All BOT projects are operational: PNC has a portfolio of 8 BOT projects, with
all of them being operational. With recent commencement of all BOT projects
in FY2016E, we can expect gradual ease in the consolidated balance sheet
stress from FY2017E onwards.
Comfortable consol. D/E ratio: PNC entered the BOT space in FY2012 and
OMT space in FY2014. As a result, the consolidated debt of the company
increased from 0.2x in FY2011 to 1.9x in FY2015 (consolidated debt at
`1,635cr). The Management commented that they do not intend to build the
BOT portfolio unless (1) BOT project gives an estimated 16-18% equity IRR, (2)
the project’s ticket size is within `500cr as the Management intends equity
funding for new BOTs to be done through internal accruals, and (3) the
project is based within North India/ UP. With all pending BOT project getting
operational, and PNC’s focus to reduce additions to BOT projects portfolio, we
expect consolidated D/E ratio levels of the company to peak-out in FY2017E.
Company background
PNC Infratech Ltd (PNC), incorporated in 1999, is an Agra based infra player
mainly focused on Roads & Highways construction. PNC, in FY2012, diversified
into BOT-Toll & Annuity projects and in FY2014 into OMT projects. Currently, PNC
is executing 20 Engineering Procurement Construction (EPC) projects (1 through JV
route), 7 BOT projects (including 2 Annuity projects) and 1 OMT project.
June 8, 2016
8
PNC Infratech | 4QFY2016 Result Update
Profit and Loss Statement (Standalone)
Y/E March (` cr)
FY14
FY15
FY16
FY17E
FY18E
Net Sales
1,145
1,561
2,014
2,350
2,904
% Chg
(12.1)
36.3
29.0
16.7
23.6
Total Expenditure
1,005
1,344
1,748
2,035
2,507
Cost of Raw Materials Consumed
372
1,196
1,434
1,741
2,147
Change in Inventories of WIP
10
(60)
35
(35)
(32)
Employee benefits Expense
58
74
84
101
119
Other Expenses
566
135
196
228
273
EBITDA
140
217
266
315
396
% Chg
(10.0)
54.6
22.8
18.4
25.9
EBIDTA %
12.2
13.9
13.2
13.4
13.7
Depreciation
25
36
52
56
60
EBIT
115
180
213
259
336
% Chg
(13.3)
56.3
18.4
21.1
30.0
Interest and Financial Charges
23
46
33
31
45
Other Income
11
14
20
18
20
PBT
102
148
200
245
311
Tax
36
47
(42)
0
93
% of PBT
34.8
32.1
(21.1)
0.0
30.0
PAT before Exceptional item
67
100
243
245
218
Exceptional item
0
0
0
0
0
PAT
FY14
FY15
FY16
FY17E
FY18E
% Chg
(12.6)
50.2
141.9
1.1
(11.3)
PAT %
5.8
6.4
12.1
10.4
7.5
Diluted EPS
17
25
47
48
42
% Chg
(12.6)
50.2
87.7
1.1
(11.3)
June 8, 2016
9
PNC Infratech | 4QFY2016 Result Update
Balance Sheet (Standalone)
Y/E March (` cr)
FY14
FY15
FY16
FY17E
FY18E
Sources of Funds
Equity Capital
40
40
51
51
51
Reserves Total
590
679
1,311
1,509
1,676
Networth
630
718
1,362
1,560
1,727
Total Debt
248
324
6
305
297
Other Long-term Liabilities
178
250
160
233
238
Deferred Tax Liability
3
0
(3)
(3)
(3)
Total Liabilities
1,058
1,293
1,525
2,095
2,259
Application of Funds
Gross Block
287
387
428
491
550
Accumulated Depreciation
134
171
223
279
340
Net Block
153
217
205
212
211
Capital WIP
2
1
9
1
1
Investments
351
424
464
849
949
Current Assets
Inventories
105
223
236
281
331
Sundry Debtors
344
367
376
555
645
Cash and Bank Balance
100
21
97
65
40
Loans, Advances & Deposits
127
214
258
294
331
Other Current Asset
1
1
1
2
2
Current Liabilities
223
285
362
418
524
Net Current Assets
455
541
606
778
824
Other Assets
98
111
240
256
275
Total Assets
1,058
1,293
1,525
2,095
2,259
June 8, 2016
10
PNC Infratech | 4QFY2016 Result Update
Cash Flow Statement (Standalone)
Y/E March (` cr)
FY14
FY15
FY16
FY17E
FY18E
Profit before tax
103
148
200
245
311
Dep. & Other Non-cash Charges
28
28
82
48
52
Change in Working Capital
74
(105)
(209)
(147)
(84)
Interest & Financial Charges
23
46
33
31
45
Direct taxes paid
(33)
(50)
0
0
(93)
Cash Flow from Operations
195
67
107
177
230
(Inc)/ Dec in Fixed Assets
(54)
(100)
(49)
(55)
(59)
(Inc)/ Dec in Investments
(80)
(73)
(41)
(384)
(100)
Cash Flow from Investing
(133)
(172)
(90)
(439)
(159)
Issue/ (Buy Back) of Equity
0
0
435
0
0
Inc./ (Dec.) in Loans
21
76
(318)
299
(8)
Dividend Paid (Incl. Tax)
(3)
(7)
(37)
(47)
(51)
Net Interest Expenses
(17)
(42)
(21)
(23)
(37)
Cash Flow from Financing
0
27
59
229
(96)
Inc./(Dec.) in Cash
62
(79)
76
(32)
(25)
Opening Cash balances
38
100
21
97
65
Closing Cash balances
100
21
97
65
40
June 8, 2016
11
PNC Infratech | 4QFY2016 Result Update
Key Ratios (Standalone)
Y/E March
FY14
FY15
FY16
FY17E
FY18E
Valuation Ratio (x)
P/E (on FDEPS)
34.0
22.6
12.0
11.9
13.4
P/CEPS
24.8
16.6
9.9
9.7
10.5
Dividend yield (%)
19.1
9.5
1.8
1.4
1.3
EV/Sales
2.1
1.6
1.4
1.3
1.1
EV/EBITDA
17.3
11.9
10.7
10.1
8.0
EV / Total Assets
1.9
1.6
1.5
1.3
1.1
Per Share Data (`)
EPS (fully diluted)
16.8
25.2
47.3
47.8
42.4
Cash EPS
23.0
34.3
57.5
58.8
54.2
DPS
0.8
1.5
6.1
7.9
8.5
Book Value
158
180
266
304
337
Returns (%)
RoCE (Pre-tax)
15.0
20.2
19.4
17.1
18.3
Angel RoIC (Pre-tax)
16.5
21.6
20.5
18.1
18.8
RoE
11.2
14.9
23.3
16.8
13.2
Turnover ratios (x)
Asset Turnover (Gross Block) (X)
4.5
4.6
4.9
5.1
5.6
Inventory / Sales (days)
33
38
42
40
38
Receivables (days)
118
83
67
72
75
Payables (days)
80
69
68
70
69
WC (days)
72
52
41
43
45
Leverage Ratios (x)
D/E ratio (x)
0.4
0.5
0.0
0.2
0.2
Interest Coverage Ratio (x)
5.4
4.2
7.0
8.9
7.9
June 8, 2016
12
PNC Infratech | 4QFY2016 Result Update
Research Team Tel: 022 - 39357800
DISCLAIMER
Angel Broking Private Limited (hereinafter referred to as “Angel”) is a registered Member of National Stock Exchange of India Limited,
Bombay Stock Exchange Limited and Metropolitan Stock Exchange of India Limited. It is also registered as a Depository Participant with
CDSL and Portfolio Manager with SEBI. It also has registration with AMFI as a Mutual Fund Distributor. Angel Broking Private Limited is
a registered entity with SEBI for Research Analyst in terms of SEBI (Research Analyst) Regulations, 2014 vide registration number
INH000000164. Angel or its associates has not been debarred/ suspended by SEBI or any other regulatory authority for accessing
/dealing in securities Market. Angel or its associates including its relatives/analyst do not hold any financial interest/beneficial
ownership of more than 1% in the company covered by Analyst. Angel or its associates/analyst has not received any compensation /
managed or co-managed public offering of securities of the company covered by Analyst during the past twelve months. Angel/analyst
has not served as an officer, director or employee of company covered by Analyst and has not been engaged in market making activity
of the company covered by Analyst.
This document is solely for the personal information of the recipient, and must not be singularly used as the basis of any investment
decision. Nothing in this document should be construed as investment or financial advice. Each recipient of this document should
make such investigations as they deem necessary to arrive at an independent evaluation of an investment in the securities of the
companies referred to in this document (including the merits and risks involved), and should consult their own advisors to determine
the merits and risks of such an investment.
Reports based on technical and derivative analysis center on studying charts of a stock's price movement, outstanding positions and
trading volume, as opposed to focusing on a company's fundamentals and, as such, may not match with a report on a company's
fundamentals.
The information in this document has been printed on the basis of publicly available information, internal data and other reliable
sources believed to be true, but we do not represent that it is accurate or complete and it should not be relied on as such, as this
document is for general guidance only. Angel Broking Pvt. Limited or any of its affiliates/ group companies shall not be in any way
responsible for any loss or damage that may arise to any person from any inadvertent error in the information contained in this report.
Angel Broking Pvt. Limited has not independently verified all the information contained within this document. Accordingly, we cannot
testify, nor make any representation or warranty, express or implied, to the accuracy, contents or data contained within this document.
While Angel Broking Pvt. Limited endeavors to update on a reasonable basis the information discussed in this material, there may be
regulatory, compliance, or other reasons that prevent us from doing so.
This document is being supplied to you solely for your information, and its contents, information or data may not be reproduced,
redistributed or passed on, directly or indirectly.
Neither Angel Broking Pvt. Limited, nor its directors, employees or affiliates shall be liable for any loss or damage that may arise from
or in connection with the use of this information.
Note: Please refer to the important ‘Stock Holding Disclosure' report on the Angel website (Research Section). Also, please refer to the
latest update on respective stocks for the disclosure status in respect of those stocks. Angel Broking Pvt. Limited and its affiliates may
have investment positions in the stocks recommended in this report.
Disclosure of Interest Statement
PNC Infratech
1. Analyst ownership of the stock
No
2. Angel and its Group companies ownership of the stock
No
3. Angel and its Group companies' Directors ownership of the stock
No
4. Broking relationship with company covered
No
Note: We have not considered any Exposure below ` 1 lakh for Angel, its Group companies and Directors
Ratings (Based on expected returns
Buy (> 15%)
Accumulate (5% to 15%)
Neutral (-5 to 5%)
over 12 months investment period):
Reduce (-5% to -15%)
Sell (< -15%)
June 8, 2016
13