IPO Note | Financial Services
October 21, 2016
PNB Housing Finance Limited
SUBSCRIBE
Issue Open: October 25, 2016
All set to grow
Issue Close: October 27, 2016
PNB Housing Finance (PNBH) has been one of the fastest growing Housing
Finance Company and is currently the 5th largest player in India. Strong Brand
Issue Details
name of PNB & efficient management has helped in growing the business much
Face Value: `10
ahead of industry. With 49% stake being held by Pvt Equity Major Carlyle group,
PNBH is all set to scale up its operations.
Present Eq. Paid up Capital: `126.9cr
Strong management with fresh capital should help maintaining the growth: Mr.
Fresh Issue*: 3.9 cr Shares amounting to `3000crs
Sanjay Gupta was appointed as the MD of PNBH in 2010. Having worked with
MNCs like AIG, ABN Amro Bank & HDFC Ltd, he along with the newly hired
Offer for sale: -cr Shares amounting to -
professionals from pvt sector has been the key behind the growth. PNBH has
Post Eq. Paid up Capital: `165.63crs
delivered a phenomenal ~61% CAGR in loan book over FY12-16, which has
resulted in 43% CAGR in PAT growth. The IPO proceeds will enable the company
Market Lot: 19 Shares
maintaining the growth momentum albeit with a lower rate.
Fresh Issue (amount): `3000cr
Higher LTV/ ticket size & multiple products offerings have helped the growth:
PNBH’s average ticket size at `32 lakh is highest among the HFCs (HDFC `22
Price Band: `750-775
lakh, LICH `21 lakh). It also offers higher LTV of 66% vs 47%-LIC, 53%-DHFL,
Post-issue implied mkt. cap `12837cr*
65%-HDFC. Higher ticket size backed by high LTV also seems to have backed the
growth. PNBH has a well diversified portfolio (Home loans-61%, LAP-18%, Builder
Note:*Upper price band
Loans 13% & others 12%).The management intends to maintain similar portfolio
concentration going ahead.
Best in class asset quality despite aggressive growth: Despite aggressive loan
Book Building
growth, PNBH has managed strong asset quality, with GNPAs/NNPAs at
QIBs
50%
0.22%/0.14%, respectively (one of the best in industry) & better than large pvt
Non-Institutional
15%
players. However, the company has expanded its loan book in the last few years
and hence the book is not seasoned, so the possibility of rise in NPAs can be seen
Retail
35%
in the coming years. Nevertheless, we believe PNBH will be able to control its
credit cost and have NPAs at par with other Pvt Sector players.
Access to low cost funds and reduction in cost should be RoE accretive: PNBH has
Pre Issue Shareholding Pattern(%)
access to funds at a competitive rate, due to strong parentage & management
Promoter & Promoter group
51.0
(PNB & Carlyle group). Loans from banks now account for just 6% vs 34% in
FY12, while NCD+CP form 59% vs 43% of the total borrowings. The cost/income
Other
49.0
of 30% for PNBH is higher than others (LICH 15%, DHFL 30%). Higher share of
business from DSA and recent brand building initiatives have resulted in the
increase in cost. Ability to reduce cost and access to low cost funds going ahead
should be RoE accretive.
Outlook Valuation: PNBH has delivered RoE of 17.6% on the pre issue net worth.
While the IPO will result in RoE compression, this will give the much required fund
for growth. At the upper price band, the issue is offered at 4.6x its FY16 BV.
However at the post issue BV of `311, it is offered at 2.5x. PNBH is all geared up
for its next leg of growth and has the potential to become a significant player in
the Indian mortgage business. Looking at the quality of management, which can
drive the growth, we recommend a SUBSCRIBE to the issue.
Key Financials
Y/E March (` cr)
FY2013
FY2014
FY2015
FY2016
NII
173
254
406
684
% chg
33.7
47.3
59.6
68.4
Net profit
93
130
194
328
% chg
19.9
39.7
49.6
68.8
NIM (%)
2.8
2.7
2.5
2.5
Book Value (`)
123.6
142.2
152.0
169.0
Siddharth Purohit
P/ABV (x)
6.3
5.5
5.1
4.6
RoA (%)
1.5
1.4
1.3
1.3
+91 22 39357800 Ext: 6872
RoE (%)
18.2
16.7
15.4
17.6
Source: Company, Angel Research; Note: Valuation ratios based on pre-issue outstanding shares and at upper end of the price band
Please refer to important disclosures at the end of this report
1
PNB Housing Finance | IPO Note
Company background
PNB Housing Finance (PNBH) has been one of the fastest growing Housing
Finance Company in the last few years and is currently the 5th largest HFC in India.
Strong Brand name of PNB & management skill set of Pvt Sector has helped in
growing the business much ahead of industry. With 49% stake being held by Pvt
Equity Major Carlyle group, PNBH is all set to scale up its operations.
Key Management Personnel
Ms. Usha Ananthasubramanian (Chairperson): She holds a bachelor’s degree in
science and a master’s degree in statistics from the University of Madras and a
master’s degree in arts from the University of Mumbai. She has significant
experience in the fields of banking and financial services. She has been the
Managing Director and Chief Executive Officer of Punjab National Bank since
August 14, 2015
Mr. Sanjaya Gupta (MD): He has significant experience in the mortgage industry in
both retail and corporate assets. Prior to joining PNB Housing Finance he worked
with AIG United Guaranty as the country head and Chief Executive Officer of the
prospective mortgage guaranty business in India. He also worked with ABN Amro
Bank N.V. as the National Product Head, Mortgages- Consumer Banking and with
ABN AMRO Central Enterprise Services Private Limited as the VP, Mortgages. Prior
to that he worked with HDFC Limited.
Issue details
The company is raising `3000cr through fresh issue of equity shares in the price
band of `750-775. The fresh issue will constitute 23.37% of the post-issue paid-up
equity share capital of the company assuming the issue is subscribed at the upper
end of the price band.
Objects of the offer
To augment the bank’s tier-I capital base to meet its future capital
requirements due to expected growth of the company’s assets.
The listing will also enhance the visibility and brand name of the company
among existing and potential customers.
October 21, 2016
2
PNB Housing Finance | IPO Note
Investment rationale
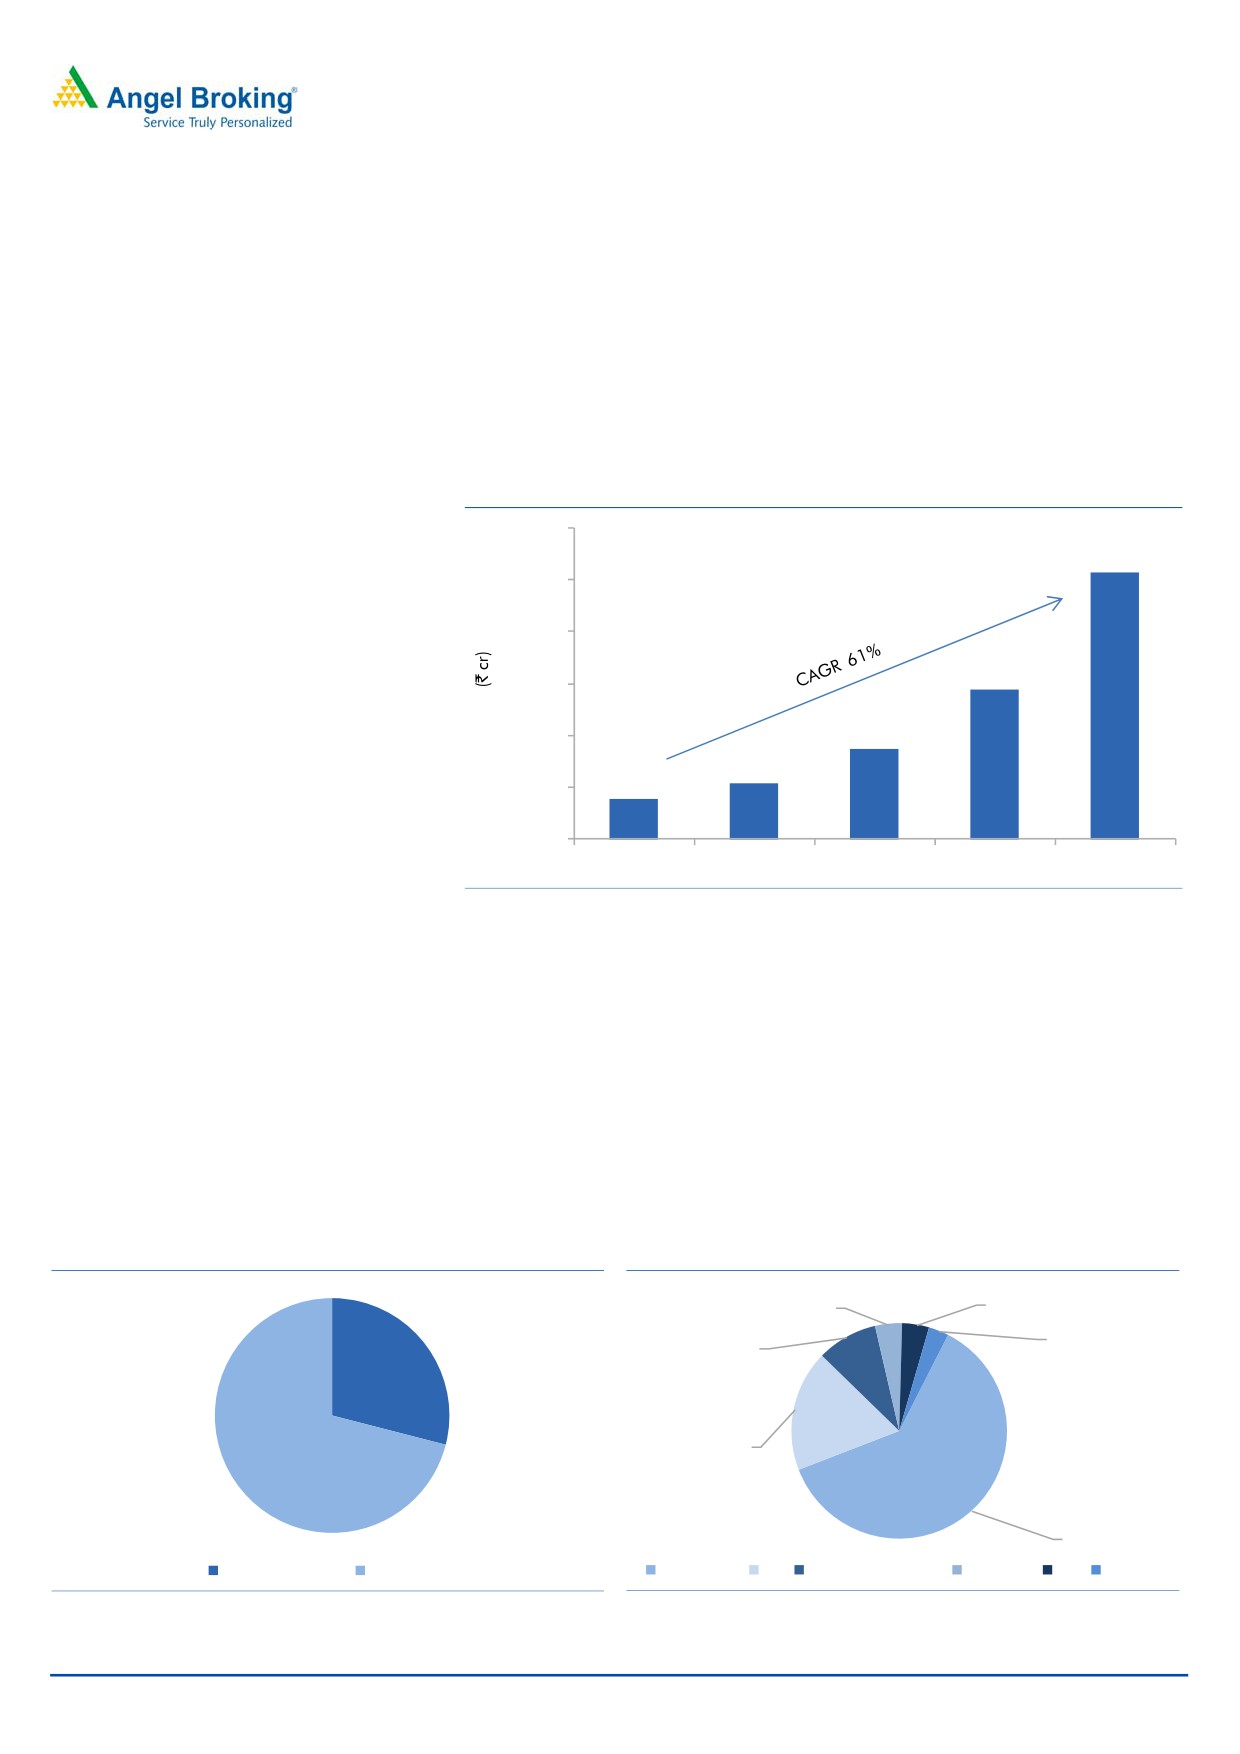
Strong management with fresh capital should help maintaining the growth:
Mr. Sanjay Gupta was appointed as the MD of PNBH in 2010. Having worked with
MNCs like AIG, ABN Amro Bank & HDFC Ltd, he along with the newly hired
professionals from pvt sector has been the key behind the growth. PNBH has
delivered a phenomenal ~61% CAGR in loan book over FY12-16, which has
resulted in 43% CAGR in PAT growth. The IPO proceeds will enable the company
maintaining the growth momentum albeit with a lower rate.
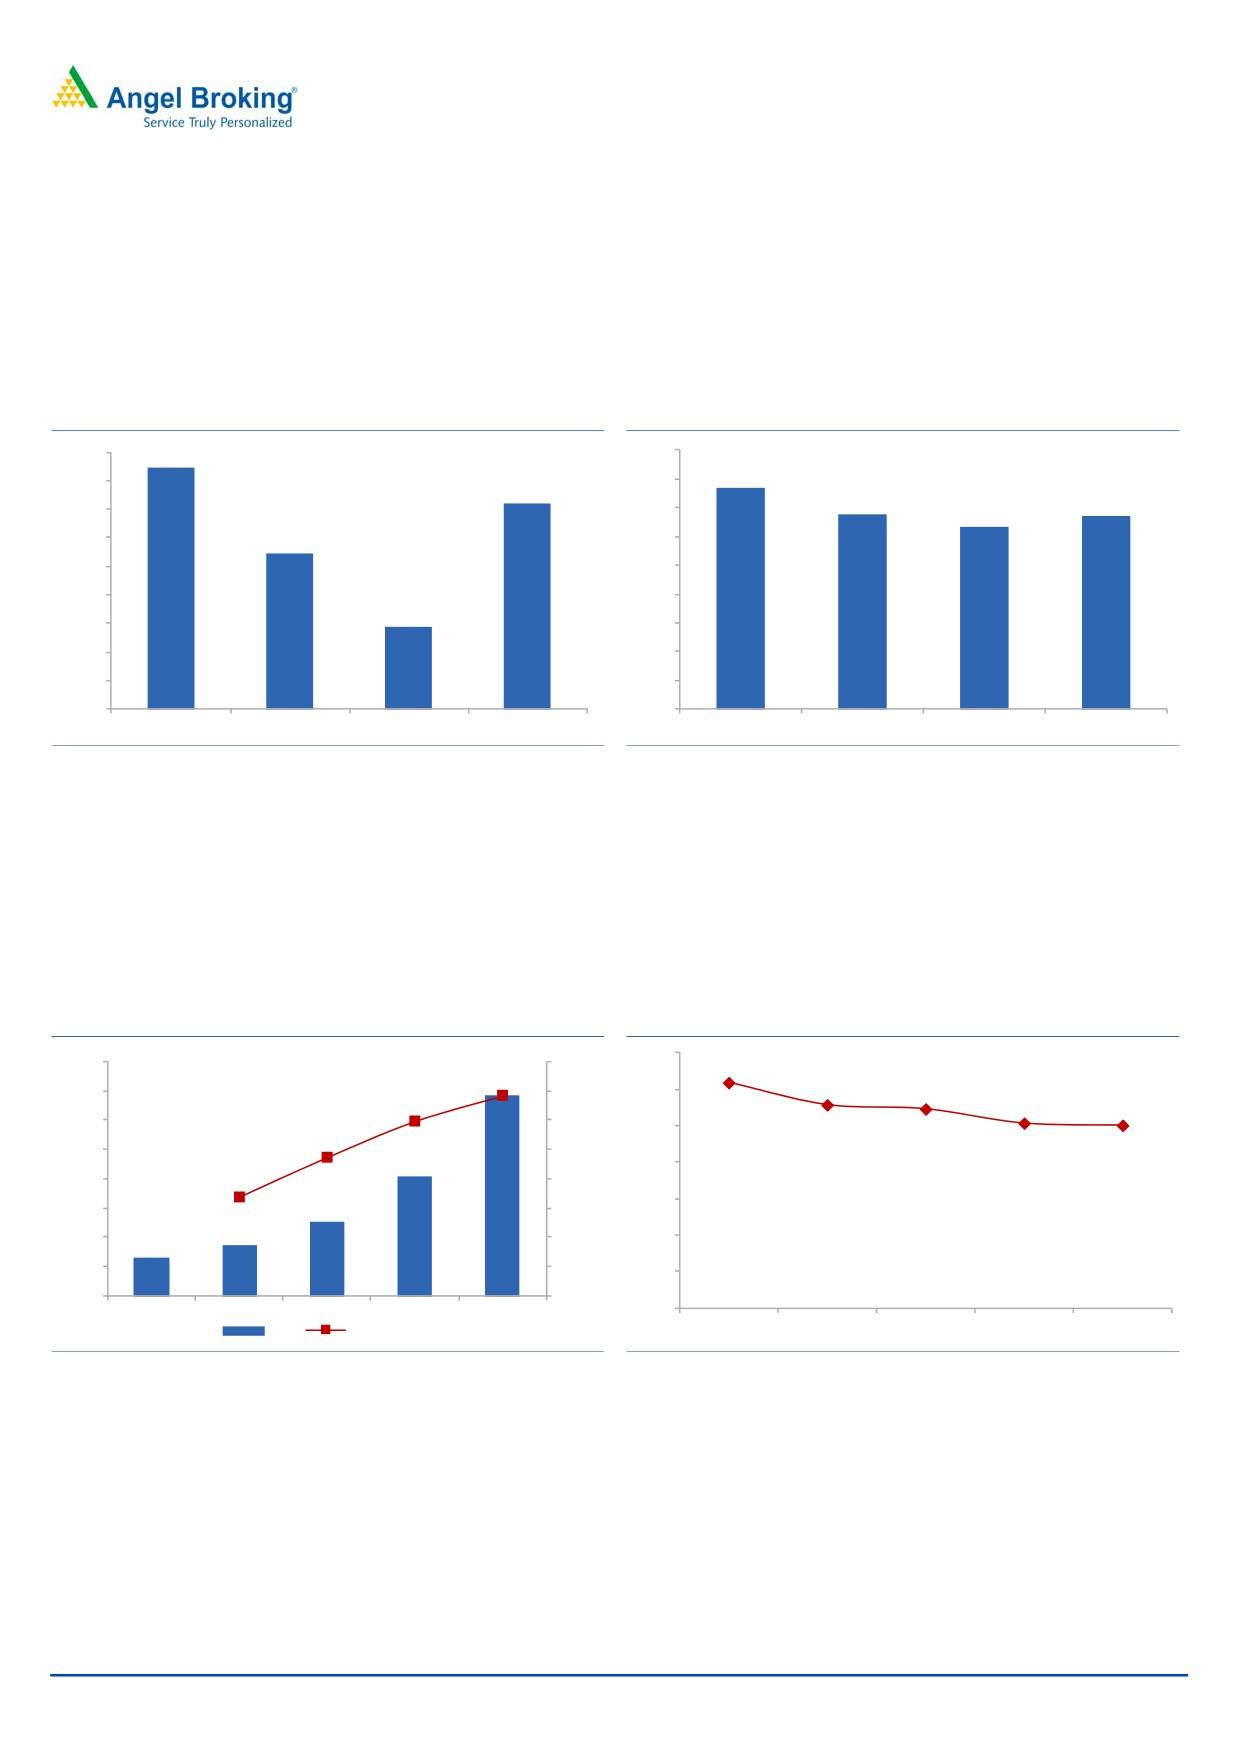
Exhibit 1: Strong growth in loan book
30,000
25,641
25,000
20,000
14,400
15,000
10,000
8,649
5,399
3,781
5,000
-
FY12
FY13
FY14
FY15
FY16
Source: RHP, Angel Research
PNBH’s retail loan share is lower than peers, but growth from both retail as well
non retail remains strong: Housing loan constitutes ~70% of the loan book, while
non housing loans constitute the balance of the portfolio. The non housing loans
normally generates higher yield; hence, we believe over the long run, PNB
Housing will be able to scale up its yield and in turn return ratios. PNBH has a well
diversified portfolio where in home loans form -61%, LAP-18%, and builder loans
13% of the total book. The company also offers loans for non residential premises
and lease discounting rental loans, which together forms ~12% of the portfolio.
The management intends to maintain similar portfolio concentration going ahead.
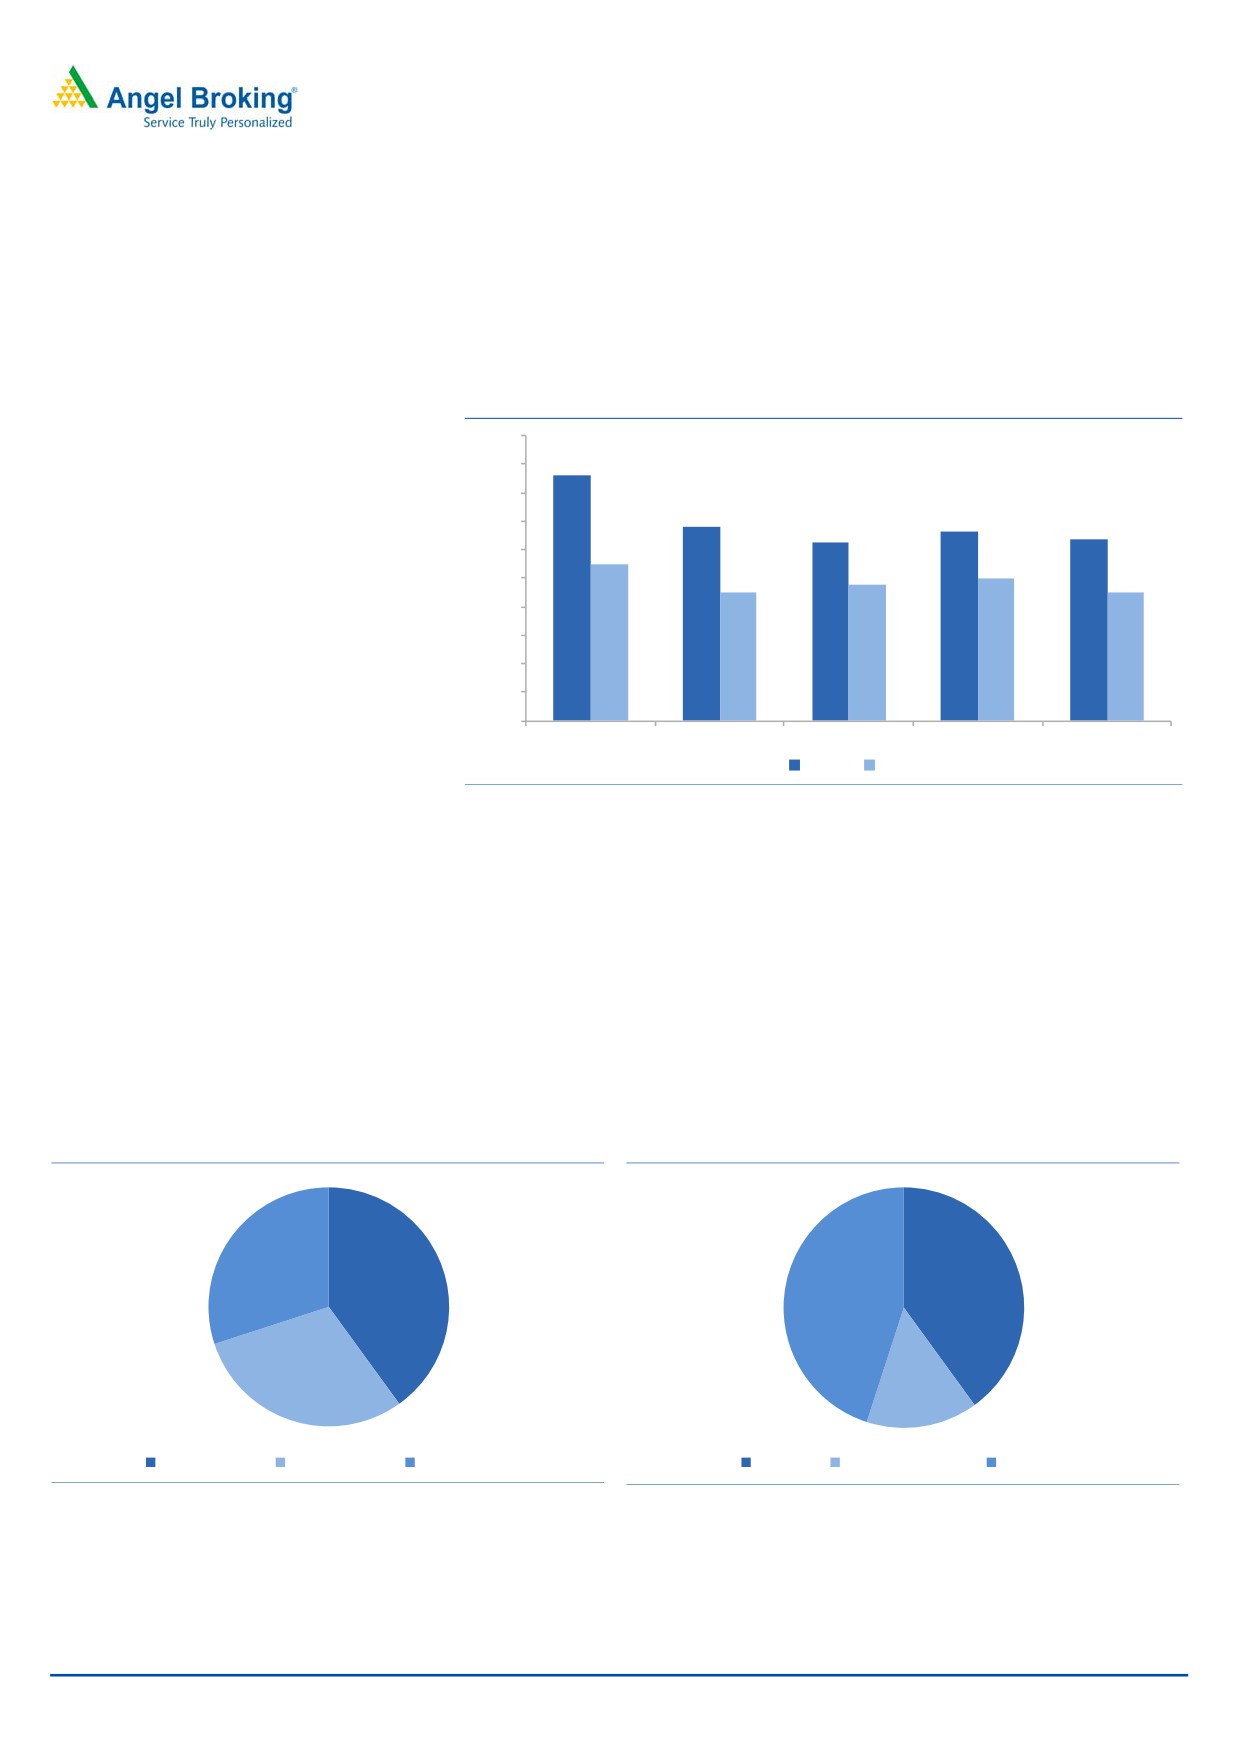
Exhibit 2: Loan mix - Housing - Non-housing
Exhibit 3: Portfolio distribution
4%
4%
3%
9%
29
18%
71
61%
Non Housing Loans Housing Loans
Home Loans LAP Construction Finance NRP Loans LRD Corp Loans
Source: RHP, Angel Research
Source: RHP, Angel Research
October 21, 2016
3
PNB Housing Finance | IPO Note
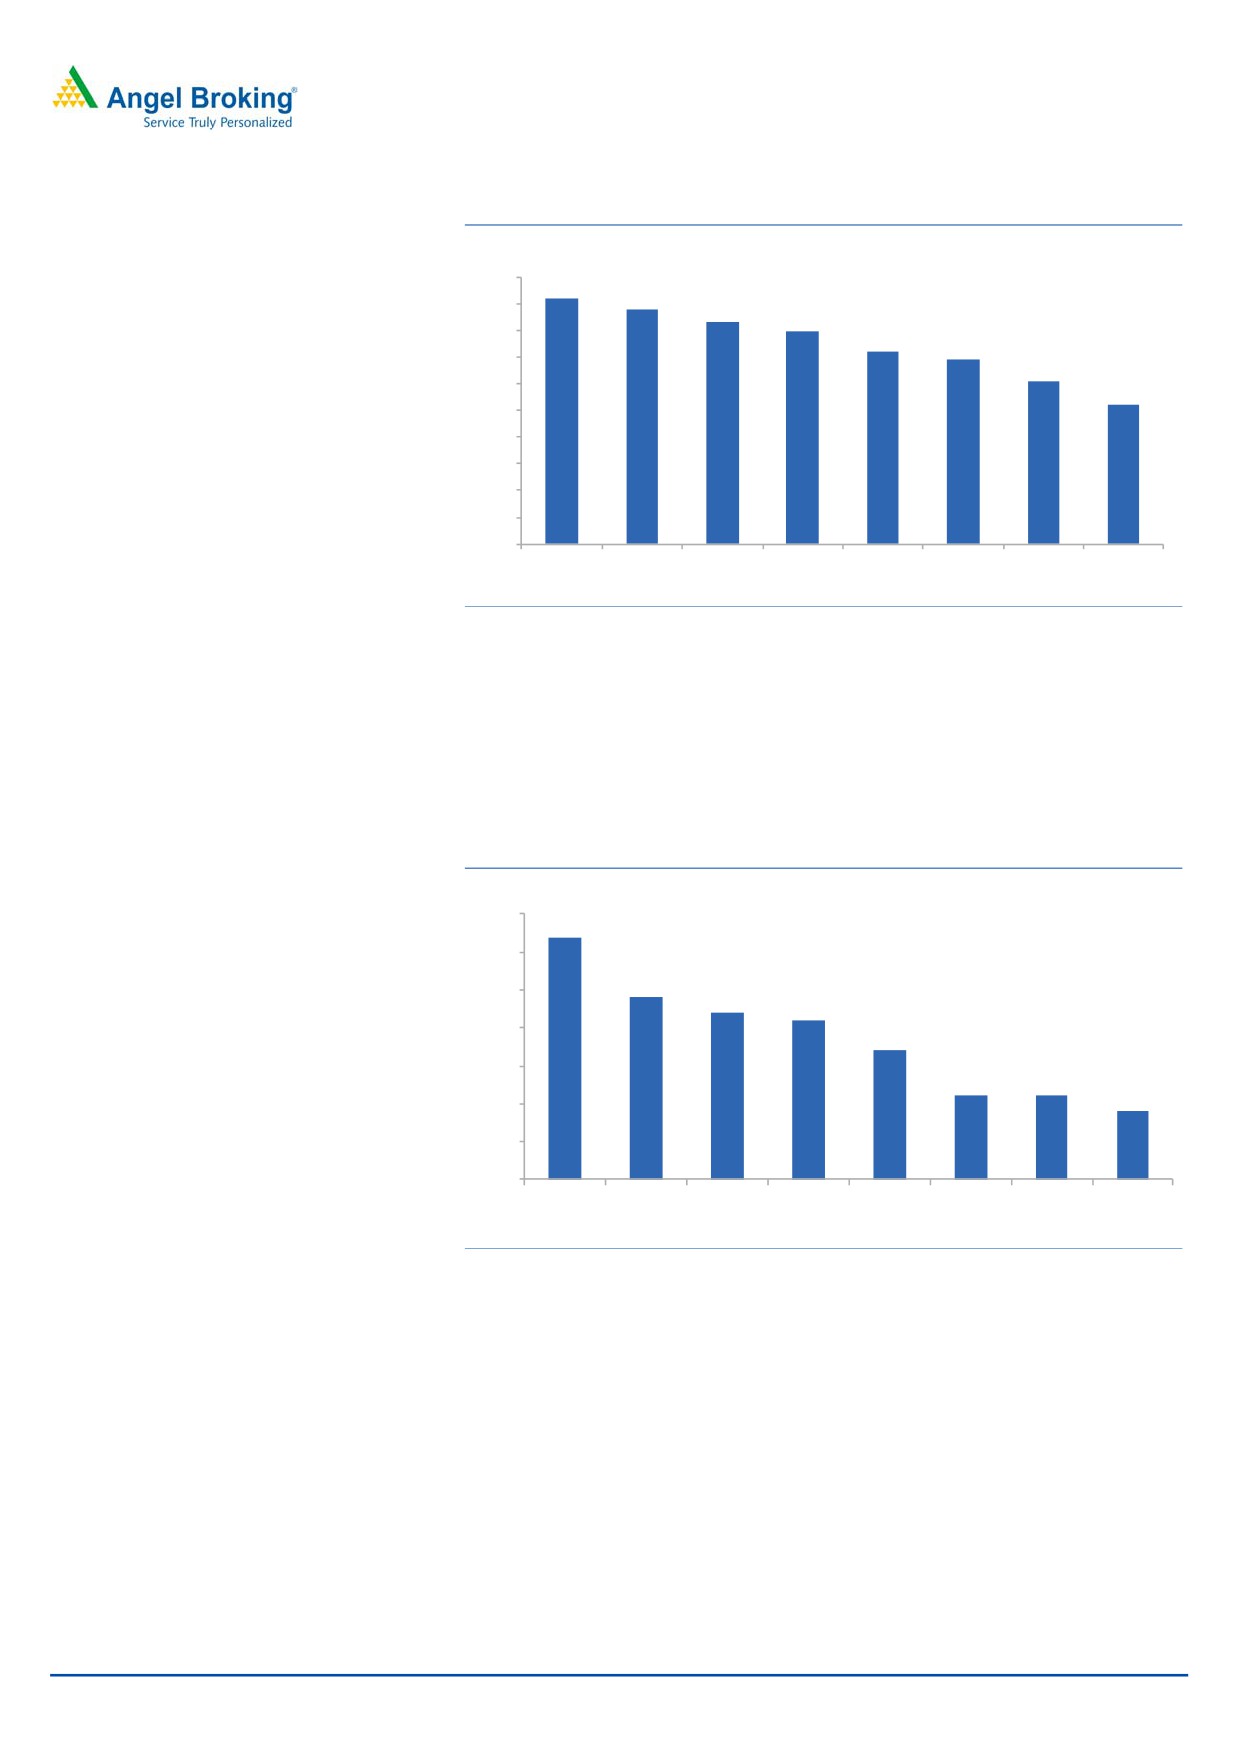
Exhibit 4: Comparative Retail Loan Mix
(%)
100
92
88
90
83
80
80
72
69
70
61
60
52
50
40
30
20
10
0
GRUH
LIC
Can Fin REPCO DHFL
HDFC
PNB India Bulls
Finance Housing Homes
Housing Housing
Source: RHP, Angel Research
Higher average ticket size, together with higher LTV have also contributed to
growth: PNBH’s average ticket size at `32 lakh is highest among the listed Housing
Finance Companies (HDFC `22 lakh, LICH `21 lakh, DHFL `11 lakh).It also offers
higher LTV of 66% vs 47%-LIC, 53%-DHFL, 65%-HDFC. Higher ticket size backed
by high LTV also seems to have backed the growth.
Exhibit 5: Comparative Average Ticket Size
(` lakhs)
35
32
30
24
25
22
21
20
17
15
11
11
9
10
5
0
PNB
India Bulls HDFC
LIC
Can Fin REPCO DHFL
GRUH
Housing Housing
Housing Homes
Source: RHP, Angel Research
While the blended LTV of PNBH looks high, the LTV differs according to the loan
types like in a retail housing loan for a salaried person would be ~69% and for a
self-employed person would be ~60%. While the LTV in case of non housing loans
for both the segments would be ~45-46%. PNBH’s relatively high LTV as well as
high ticket size is also partly due to the fact that it has been so far largely present
in the urban areas. Whereas some of the mid and large players have much wider
network, where the ticket size can be low.
October 21, 2016
4
PNB Housing Finance | IPO Note
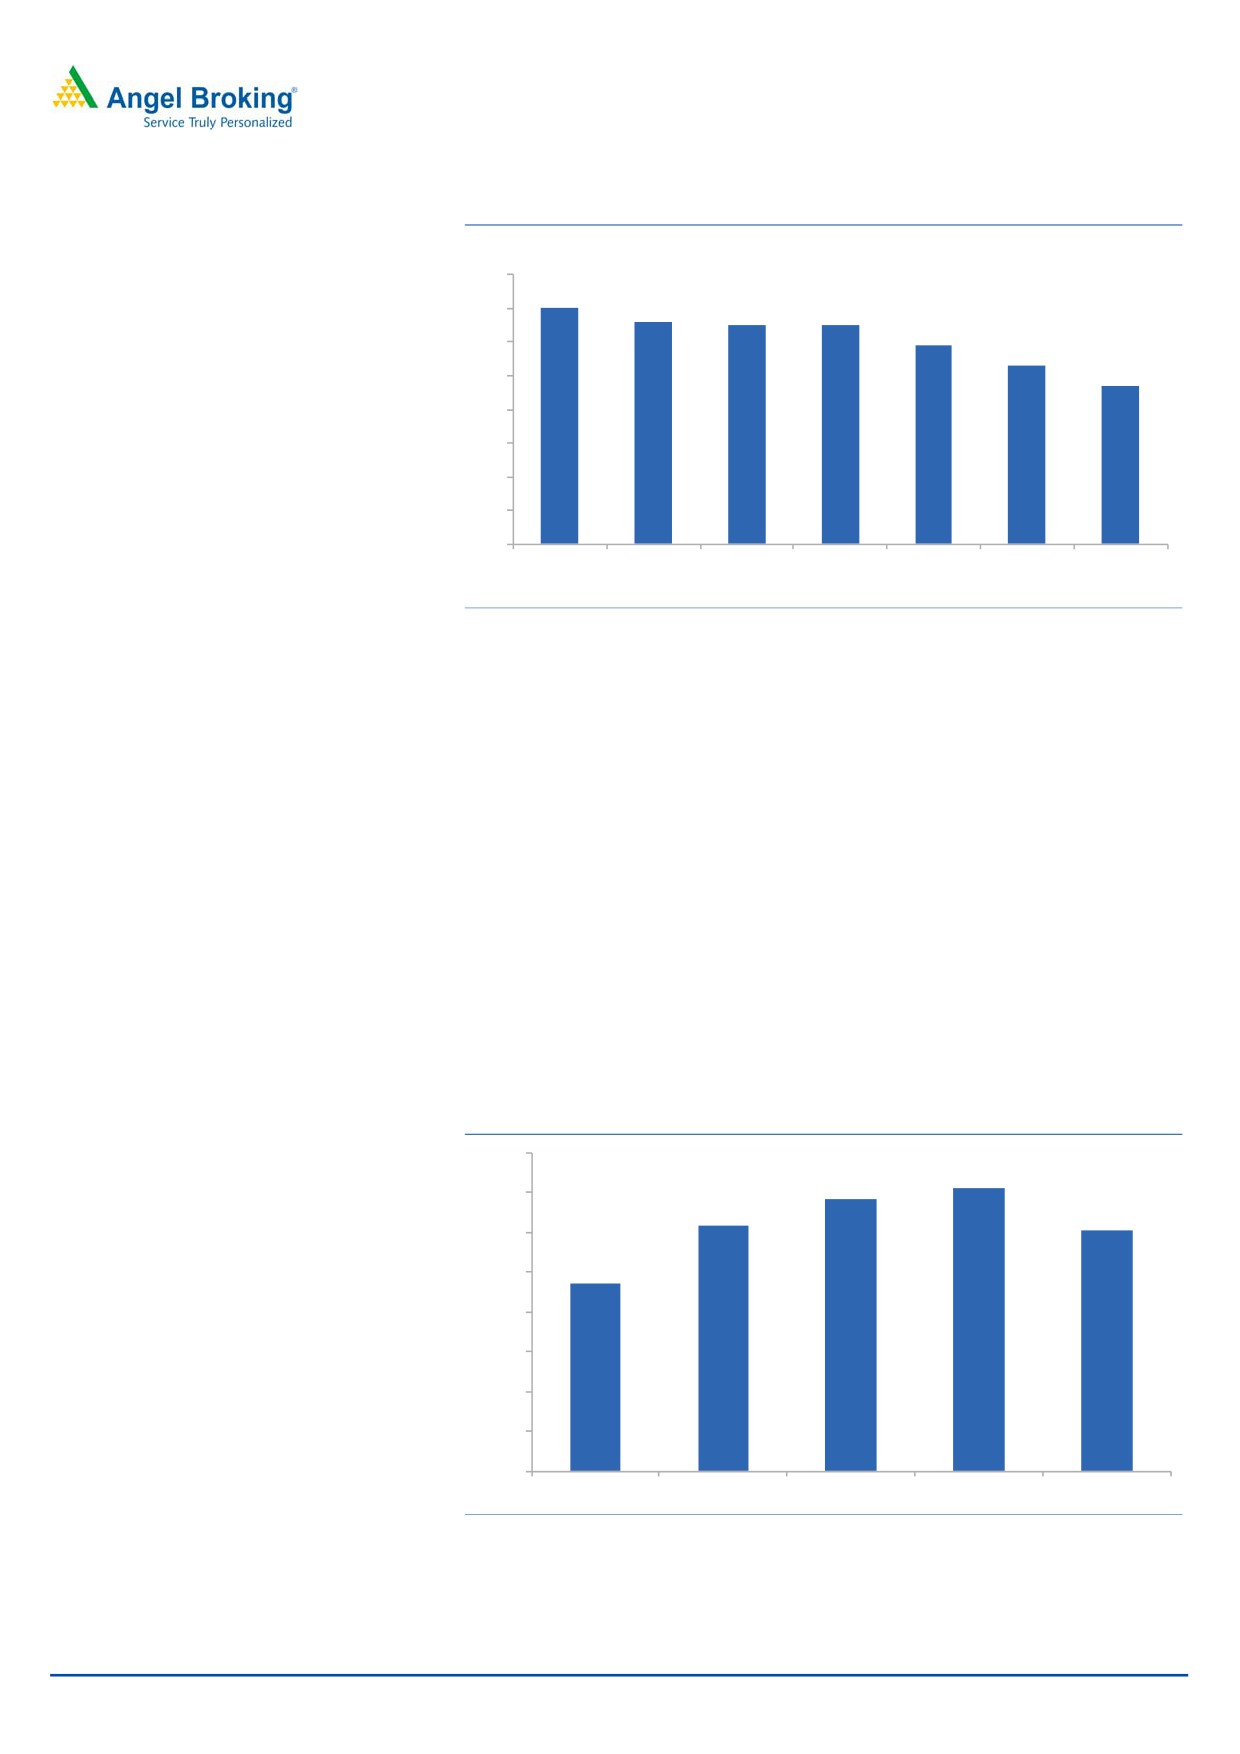
Exhibit 6: Average LTV of HFCs in India
(%)
80
70
70
66
65
65
59
60
53
47
50
40
30
20
10
0
India Bulls
PNB
REPCO
HDFC
GRUH
DHFL LIC Housing
Housing Housing
Source: RHP, Angel Research
Enough scope for a decline in cost/income ratio: The operating cost of PNBH is
relatively higher and remains one of the highest among the HFCs. Higher share of
business sourced from other channels like DSA and brand building cost has led to
the higher cost structure. However, we believe there is enough scope in the cost to
come down. We have seen this happening in case of mid-sized housing finance
companies in the recent years.
Business sourcing from direct sales agents still forms a large part of the total book,
~45%. Though it has come down from 53%, ability to generate higher business
from own sources could reduce the overall operating expenses. Further, over the
last few years, the company has undertaken several steps to improve the brand
visibility. The cost/income of 30% for PNBH is higher than others (LICH 15%, DHFL
30%). Hence, we expect going ahead there would be enough scope for cost
rationalization.
Exhibit 7: Cost/Income Ratio (%) likely to come down
40.0
35.5
34.3
35.0
30.9
30.2
30.0
23.7
25.0
20.0
15.0
10.0
5.0
-
FY12
FY13
FY14
FY15
FY16
Source: RHP, Angel Research
October 21, 2016
5
PNB Housing Finance | IPO Note
Best in class asset quality despite aggressive growth: Despite aggressive loan
growth, PNBH has managed strong asset quality, with GNPAs/NNPAs at
0.22%/0.14%, respectively (one of the best in industry) & better than large pvt
players. However, the company has expanded its loan book in the last few years
and hence the book is not seasoned, so the possibility of rise in NPAs can be seen
in the coming years. Nevertheless, we believe PNBH will be able to control its
credit cost and have NPAs at par with other pvt sector players.
Exhibit 8: GNPAs and NNPAs trend
Exhibit 9: Credit Cost (%)
1.2
0.40
0.35
1.0
0.35
0.32
1.0
0.30
0.26
0.8
0.7
0.25
0.23
0.6
0.6
0.20
0.17
0.4
0.4
0.3
0.15
0.2
0.2
0.2
0.1
0.10
0.2
0.1
0.05
0.0
FY12
FY13
FY14
FY15
FY16
0.00
GNPAs % NNPAs %
FY12
FY13
FY14
FY15
FY16
Source: RHP, Angel Research
Source: RHP, Angel Research
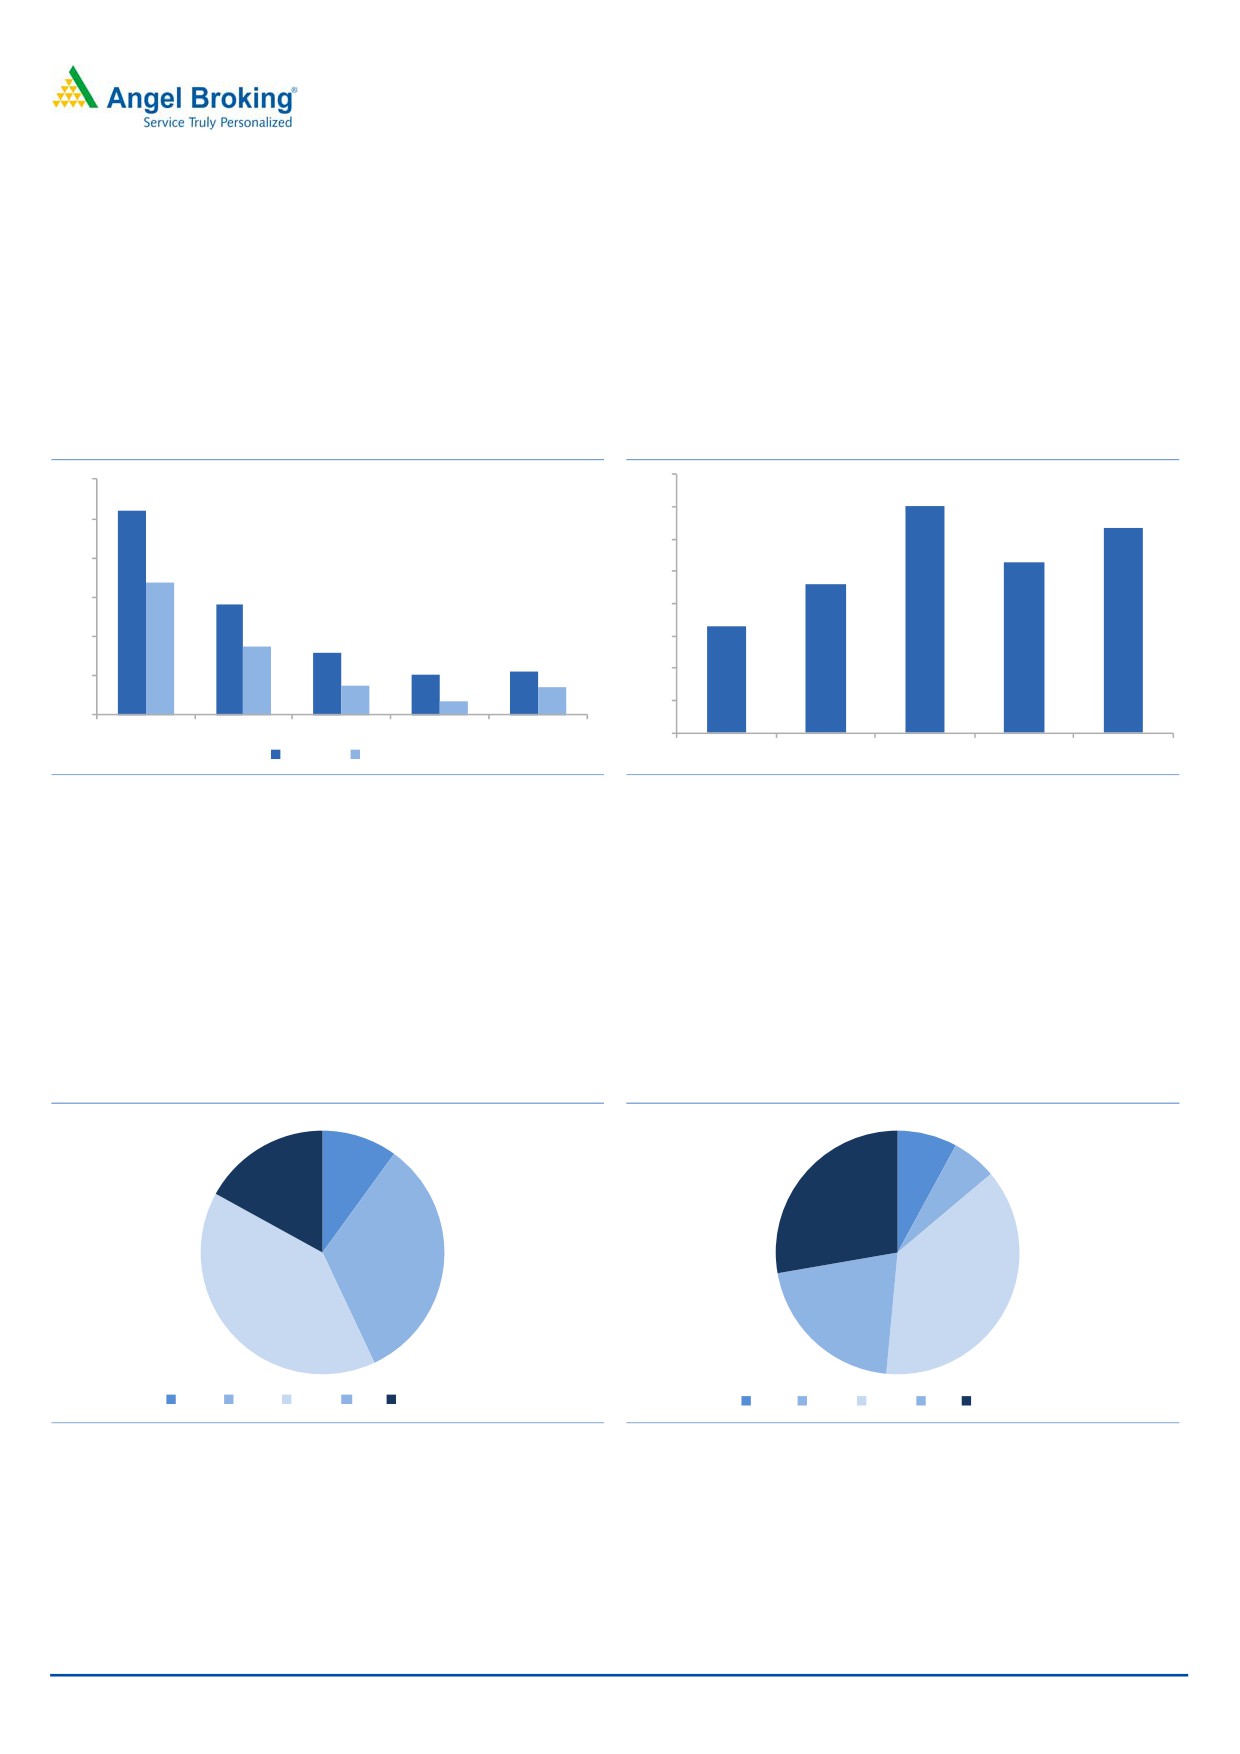
Strong parentage & management bandwidth with stable credit rating has allowed
access to low cost funds: PNBH is able to raise funds from the money markets at a
competitive rate, largely due to strong parentage (PNB & Carlyle group). Over the
last 4 years, PNBH has reduced its dependence on bank funding substantially and
has been able to raise funds via NCD, CP as well as public deposits. Bank funding
in total funds has been reduced to 6% by FY16 from a high of 34% in FY12. PNBH
is the 2nd largest deposit taking HFC in India.
Exhibit 10: Sources of Funding FY2014
Exhibit 11: Sources of Funding FY2016
10
8
17
6
0
28
33
38
40
21
NHB Bank NCD CP Deposits & ECB
NHB Bank NCD CP Deposits & ECB
Source: RHP, Angel Research
Source: RHP, Angel Research
October 21, 2016
6
PNB Housing Finance | IPO Note
Scope for improvement in ROE & ROA profile: PNBH has delivered RoE of 17.6%
on the pre issue net worth. While the IPO will result in RoE compression, this will
give the much required fund for growth. Though PNBH has product offerings
across various segments and the RoE & RoA is little lower than some of the large
HFCs. However, we believe as the business scales up the operating cost structure
would also get reduced.
Exhibit 12: ROE
Exhibit 13: ROA
18.5
18.2
1.80
1.54
18.0
1.60
17.6
1.35
1.35
17.5
1.40
1.27
17.0
16.7
1.20
16.5
1.00
16.0
0.80
15.4
15.5
0.60
15.0
0.40
14.5
0.20
14.0
0.00
FY13
FY14
FY15
FY16
FY13
FY14
FY15
FY16
Source: RHP, Angel Research
Source: RHP, Angel Research
NIM likely to see improvement post fund raising: While NIM remains moderately
lower than large HFCs, higher operating cost has resulted in RoE being lower.
However, we believe the unique blend of portfolio will enable PNB housing to
optimize its RoE in the long run. Post dilution, we expect RoE to drop to ~14.5% by
FY18. However, we believe it will be able to bounce back to its existing RoE levels
post that.
Exhibit 14: NII trend
Exhibit 15: NIM trend
3.50
800
80.0%
3.09
684
2.79
700
68.4%
70.0%
3.00
2.73
59.6%
2.54
2.51
600
60.0%
2.50
47.3%
500
50.0%
406
2.00
400
33.7%
40.0%
1.50
300
254
30.0%
173
200
20.0%
1.00
129
100
10.0%
0.50
-
0.0%
0.00
FY12
FY13
FY14
FY15
FY16
NII
% Growth YoY
FY12
FY13
FY14
FY15
FY16
Source: RHP, Angel Research
Source: RHP, Angel Research
October 21, 2016
7
PNB Housing Finance | IPO Note
IPO will enable improved Capital Adequacy
PNBH’s capital adequacy at the end of 1QFY2017 stood at 13.04% and looking at
the high growth, which the company has been delivering, capital raising was a
must. We believe the current fund raising via the IPO should meet the company’s
capital requirement in the near term.
Exhibit 16: Capital adequacy
20.0
17.2
18.0
16.0
13.6
13.3
14.0
12.6
12.7
12.0
10.9
9.9
9.5
10.0
9.0
9.0
8.0
6.0
4.0
2.0
0.0
FY12
FY13
FY14
FY15
FY16
CAR % Tier I
Source: RHP, Angel Research
Well diversified geographical and customer mix
PNBH has a high presence in the northern part of India. However, off late the
company has also expanded into other geographies. North accounted for 40% of
the outstanding loans, while west and south accounted for 30% each of the loan
book in India. Based on customer profile again the loan book seems well
balanced with 45% of the outstanding loans to self employed persons. While
salaried customers accounted for ~40% of the loans, the balance 15% loan was
towards corporate.
Exhibit 17: Geographical Mix of Loan (%)
Exhibit 18: Loan mix by customer
30
40
40
45
30
15
Northern region
Southern region
Western region
Salaried
Loan to corporates
Self employed
Source: RHP, Angel Research
Source: RHP, Angel Research
October 21, 2016
8
PNB Housing Finance | IPO Note
Outlook & Valuation: PNBH has delivered RoE of 17.6% on the pre issue net
worth. While the IPO will result in RoE compression, this will give the much
required fund for growth. At the upper price band, the issue is offered at 4.6x its
FY16 BV. However at the post issue BV of `311, it is offered at 2.5x. PNBH is all
geared up for its next leg of growth and has the potential to become a significant
player in the Indian mortgage business. Looking at the quality of management,
which can drive the growth, we recommend a SUBSCRIBE to the issue.
Comparative tables
Exhibit 19: Comparative Performance Balance sheet
Cost/
Loan Book Retail Others
GNPAs % CAR%
Income
LIC Housing
125,173
88
12
0.45
17.0
14.7
DHFL
62,295
72
28
0.93
16.7
30.1
India Bulls Housing
67,800
77
23
0.84
20.5
14.3
PNB Housing
25,641
61
39
0.22
12.7
30.2
Can Fin Homes
10,643
99
1
0.19
20.7
18.7
REPCO
7,691
80
20
1.20
20.8
19.3
GRUH Finance
11,115
92
8
0.30
17.8
18.0
Source: RHP, Company, Angel Research
Exhibit 20: Comparative - Asset Quality & Capital Adequacy
4 year CAGR
BV ( FY18E
NII Loan PAT NIM % RoE %
P/ BV*
CMP
Consensus)
LIC Housing
20.6
18.7
16.0
2.5
19.6
252.8
2.4
600
DHFL
30.3
25.1
27.5
3.0
15.1
217.2
1.5
332
India Bulls Housing
26.2
25.3
74.0
4.7
27.0
312.2
2.8
879
PNB Housing**
51.7
61.4
43.4
2.9
17.6
386.5
2.0
775
Can Fin Homes
37.7
41.2
37.4
3.2
17.9
480.7
3.8
1830
REPCO
31.0
28.6
25.8
4.4
16.4
213.2
3.7
790
GRUH Finance
24.4
28.6
19.3
4.2
31.5
35.1
9.7
339
Source: RHP, Company, Angel Research; Note: CMP as of October 21, 2016; * Bloomberg
Consensus; ** Angel Estimates; CAGR FY2012-16
October 21, 2016
9
PNB Housing Finance | IPO Note
Income statement
Y/E March (` cr)
FY13
FY14
FY15
FY16
NII
173
254
406
684
- YoY Growth (%)
33.7
47.3
59.6
68.4
Other Income
32
64
110
155
- YoY Growth (%)
81.0
103.2
70.1
41.9
Operating Income
204
319
516
839
- YoY Growth (%)
39.4
56.0
61.8
62.8
Operating Expenses
63
109
183
254
- YoY Growth (%)
81.9
73.1
67.4
38.7
Pre - Provision Profit
141
209
333
585
- YoY Growth (%)
26.2
48.3
58.8
76.0
Prov. & Cont.
12
30
38
81
- YoY Growth (%)
98.7
144.1
25.2
112.9
Profit Before Tax
129
179
294
504
- YoY Growth (%)
21.9
39.0
64.5
71.3
Prov. for Taxation
36
49
100
177
- as a % of PBT
27.9
27.5
34.1
35.0
PAT
93
130
194
328
- YoY Growth (%)
19.9
39.7
49.6
68.8
Balance sheet
Y/E March (` cr)
FY13
FY14
FY15
FY16
Share Capital
50
66
104
127
Reserve & Surplus
568
868
1,475
2,018
NetWorth
618
934
1,579
2,144
Borrowings
5,535
8,396
14,552
24,095
- YoY Growth (%)
98.2
51.7
73.3
65.6
Provisions & Others
65
106
197
337
Other Liabilities
1,437
2,103
2,707
3,096
Total Liabilities
7,655
11,540
19,035
29,672
Cash and Bal With RBI
128
138
293
249
Investments
777
645
1,586
1,622
Advances
5,399
8,649
14,400
25,641
- Growth (%)
42.8
60.2
66.5
78.1
Fixed Assets
18
29
58
62
Deferred Tax Assets
14
15
-
-
Other Assets
1,319
2,062
2,698
2,099
Total Assets
7,655
11,540
19,035
29,672
October 21, 2016
10
PNB Housing Finance | IPO Note
Ratio analysis
Y/E March
FY13
FY14
FY15
FY16
Profitability ratios (%)
NIMs
2.8
2.7
2.5
2.5
RoA
1.5
1.4
1.3
1.3
RoE
18.2
16.7
15.4
17.6
Asset Quality (%)
Gross NPAs
0.6
0.3
0.2
0.2
Net NPAs
0.4
0.2
0.1
0.1
Per Share Data (`)
EPS
18.6
19.7
18.7
25.8
BV
123.6
142.2
152.0
169.0
Valuation Ratios
PER (x)
41.7
39.3
41.5
30.0
P/BVPS (x)
6.3
5.5
5.1
4.6
DuPont Analysis
Net Interest Income
10.5
11.0
10.9
10.4
Non Interest Income
7.6
8.4
8.3
7.6
Total Revenues
2.9
2.6
2.7
2.8
Operating Cost
1.0
1.1
1.2
1.0
PPP
2.3
2.2
2.2
2.4
Total Provisions
0.2
0.3
0.2
0.3
PreTax Profit
2.1
1.9
1.9
2.1
Tax
0.6
0.5
0.7
0.7
ROA
1.5
1.4
1.3
1.3
Leverage
11.9
12.4
12.2
13.1
RoE (%)
18.2
16.7
15.4
17.6
October 21, 2016
11
PNB Housing Finance | IPO Note
Research Team Tel: 022 - 39357800
DISCLAIMER
Angel Broking Private Limited (hereinafter referred to as “Angel”) is a registered Member of National Stock Exchange of India Limited,
Bombay Stock Exchange Limited and Metropolitan Stock Exchange Limited. It is also registered as a Depository Participant with CDSL
and Portfolio Manager with SEBI. It also has registration with AMFI as a Mutual Fund Distributor. Angel Broking Private Limited is a
registered entity with SEBI for Research Analyst in terms of SEBI (Research Analyst) Regulations, 2014 vide registration number
INH000000164. Angel or its associates has not been debarred/ suspended by SEBI or any other regulatory authority for accessing
/dealing in securities Market. Angel or its associates/analyst has not received any compensation / managed or co-managed public
offering of securities of the company covered by Analyst during the past twelve months.
This document is solely for the personal information of the recipient, and must not be singularly used as the basis of any investment
decision. Nothing in this document should be construed as investment or financial advice. Each recipient of this document should
make such investigations as they deem necessary to arrive at an independent evaluation of an investment in the securities of the
companies referred to in this document (including the merits and risks involved), and should consult their own advisors to determine
the merits and risks of such an investment.
Reports based on technical and derivative analysis center on studying charts of a stock's price movement, outstanding positions and
trading volume, as opposed to focusing on a company's fundamentals and, as such, may not match with a report on a company's
fundamentals. Investors are advised to refer the Fundamental and Technical Research Reports available on our website to evaluate the
contrary view, if any.
The information in this document has been printed on the basis of publicly available information, internal data and other reliable
sources believed to be true, but we do not represent that it is accurate or complete and it should not be relied on as such, as this
document is for general guidance only. Angel Broking Pvt. Limited or any of its affiliates/ group companies shall not be in any way
responsible for any loss or damage that may arise to any person from any inadvertent error in the information contained in this report.
Angel Broking Pvt. Limited has not independently verified all the information contained within this document. Accordingly, we cannot
testify, nor make any representation or warranty, express or implied, to the accuracy, contents or data contained within this document.
While Angel Broking Pvt. Limited endeavors to update on a reasonable basis the information discussed in this material, there may be
regulatory, compliance, or other reasons that prevent us from doing so.
This document is being supplied to you solely for your information, and its contents, information or data may not be reproduced,
redistributed or passed on, directly or indirectly.
Neither Angel Broking Pvt. Limited, nor its directors, employees or affiliates shall be liable for any loss or damage that may arise from
or in connection with the use of this information.
October 21, 2016
12