2QFY2016 Result Update | Plastic Products
November 4, 2015
Nilkamal
NEUTRAL
CMP
`1,172
Performance Update
Target Price
-
Y/E March (` cr)
2QFY2016 2QFY2015
% chg (yoy) 1QFY2016
% chg (qoq)
Investment Period
-
Net sales
482
458
5.1
458
5.2
Stock Info
EBITDA
50
31
63.3
52
(2.9)
Sector
Plastic Products
EBITDA margin (%)
10.4
6.7
372bp
11.3
(87)bp
Market Cap (` cr)
1,749
Adjusted PAT
26
7
276.1
25
1.8
Net debt (` cr)
173
Source: Company, Angel Research
Beta
1.4
52 Week High / Low
1,179 / 316
Nilkamal reported a good set of numbers for 2QFY2016. It posted a top-line
Avg. Daily Volume
32,319
growth of 5.1% yoy to `482cr and a significant improvement in profitability. The
Face Value (`)
10
raw material cost as a percentage of sales declined by 603bp yoy to 58.5%.
BSE Sensex
26,591
However, the employee cost and other expenses increased by 55bp yoy and
Nifty
8,061
176bp yoy to 6.7% and 24.3% of sales, respectively. As a result, the EBITDA
Reuters Code
NKML.BO
margin expanded by 372bp yoy to 10.4%. Aided by higher other income, the net
Bloomberg Code
NILK IN
profit, at `26cr, came in higher than our estimate of `22cr.
Plastics division to benefit from revival in economy: After witnessing volume
Shareholding Pattern (%)
de-growth in FY2014, the Plastic division witnessed a volume growth of 10% in
Promoters
64.1
FY2015. Material Handling and Moulded Furniture segments of the plastic
MF / Banks / Indian Fls
1.6
division are directly impacted by the macro environment and we expect them to
FII / NRIs / OCBs
3.6
maintain steady growth, given the positive economic outlook. Additionally, with no
major capex plans going ahead and sufficient capacity to service recovery in demand,
Indian Public / Others
30.6
we expect operating leverage to come into play, thereby aiding the bottom-line.
Stable raw material cost to aid in maintaining margins: Polymer prices had
Abs.(%)
3m 1yr 3yr
declined by ~18% in the past quarter on yoy basis, thus leading to lower raw
Sensex
(5.7)
(4.6)
41.7
material costs. After showing some recovery owing to supply constraints, Polymer
NILK
27.2
225.0
398.7
prices have resumed their downward movement, mainly tracing a similar
movement in crude prices. Polymer prices are now expected to remain at current
levels, or increase by not more than 5% from here on, which should enable NILK in
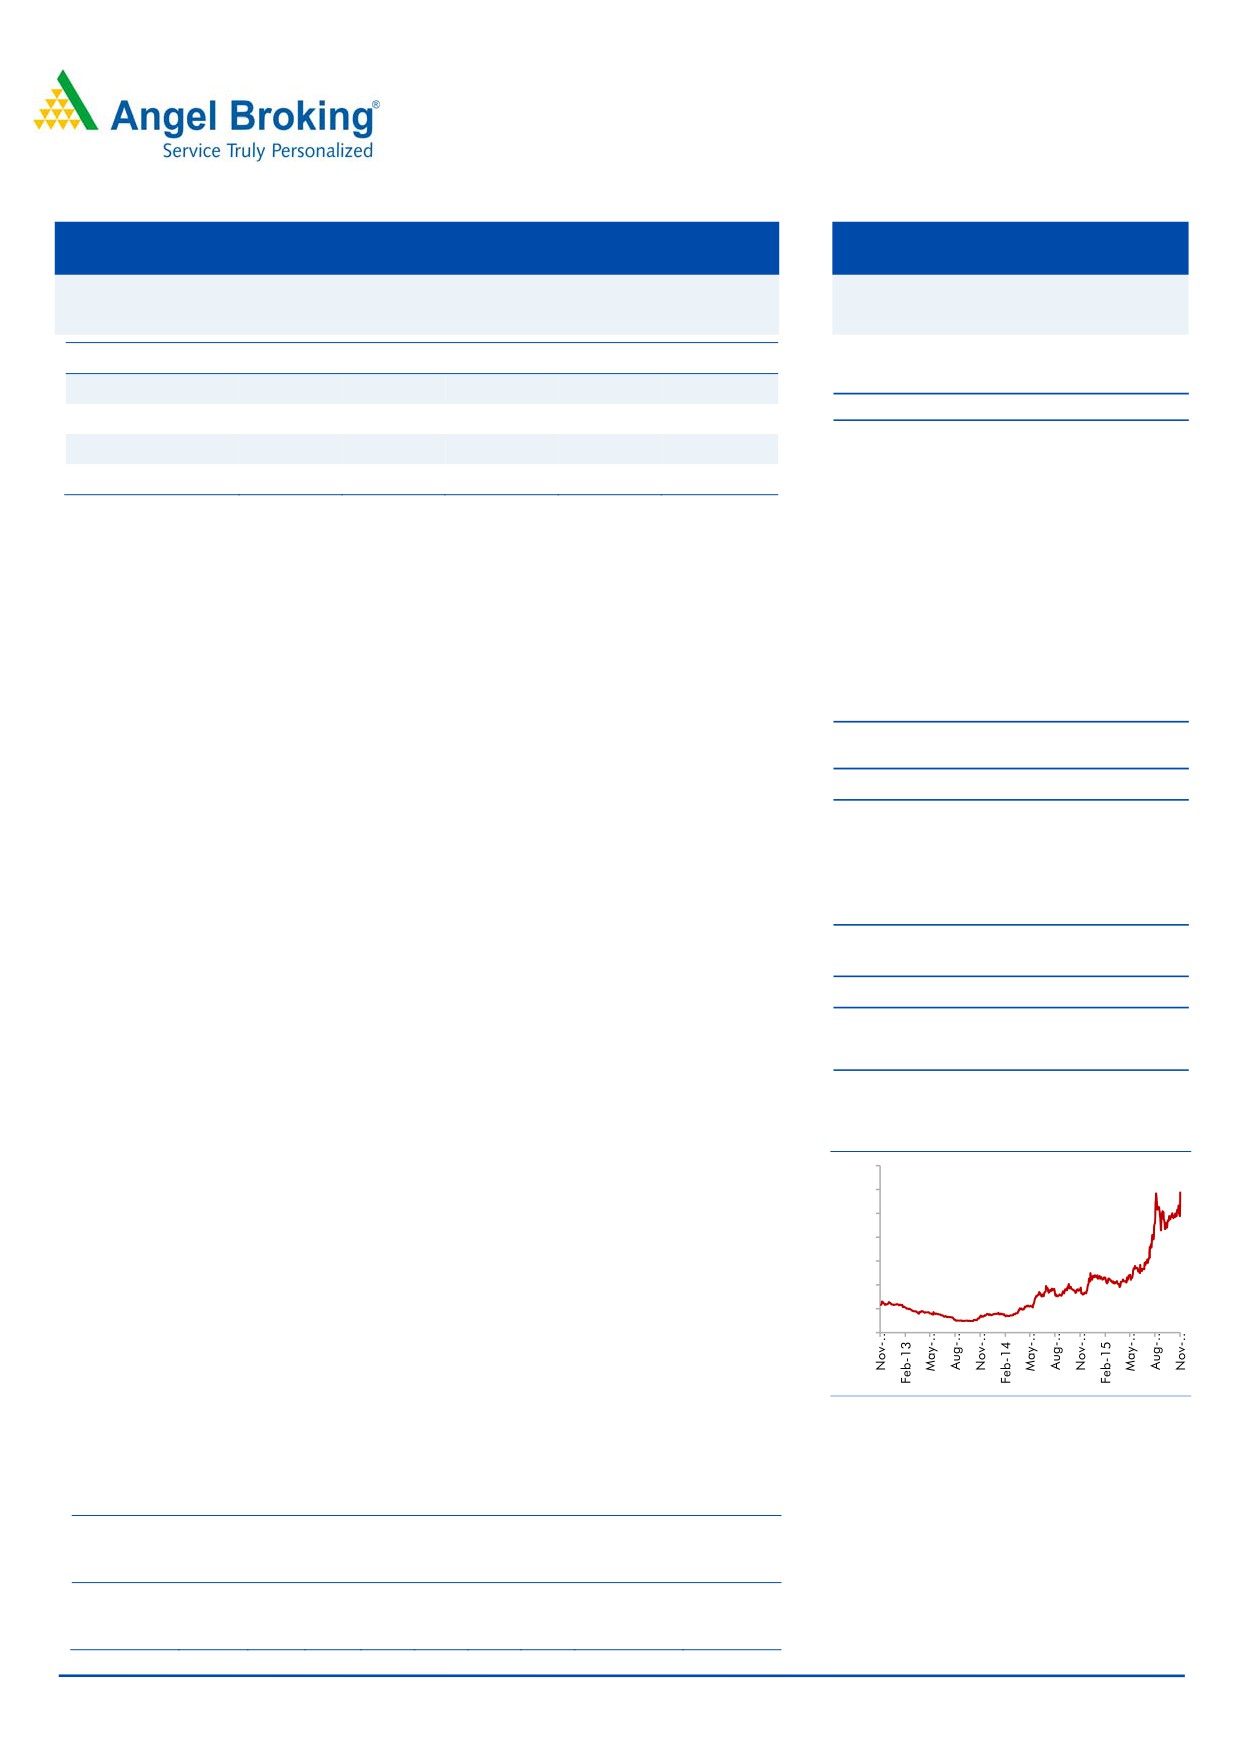
3 year daily price chart
maintaining its margins over FY2016-2017E.
1400
1200
Outlook and Valuation: We expect the company’s Plastics business to post a
1000
CAGR of 9.0%, with an upturn in the economy, over FY2015E-2017E, which will
800
aid the company to post revenue CAGR of 8.0%, over the same period, to
600
400
`2,083cr. The EBITDA margin is expected to be at 10.3% in FY2017E. The
200
company has lowered its debt significantly; resultantly, a lower interest cost is
0
expected to boost the bottom-line. Consequently, we expect the company’s
bottom-line to more than double to `103cr in FY2017E from `42cr in FY2015. At
the current market price, the stock is trading at FY2017E PE of 16.9x. The stock
Source: Company, Angel Research
has run up significantly post its 2QFY2016 results and at the current juncture, we
have a Neutral rating on the stock.
Financials (Standalone)
Y/E
Sales OPM PAT EPS RoE P/E P/BV
EV/BITDA EV/Sales
March
(` cr)
(%)
(` cr)
(`)
(%)
(x)
(x)
(x)
(x)
FY2016E
1,910
10.5
94
63.3
17.6
18.5
3.0
9.2
1.0
Milan Desai
022-4000 3600 Ext.: 6846
FY2017E
2,083
10.3
103
69.2
16.5
16.9
2.6
8.2
0.8
Source: Company, Angel Research; Note: CMP as of November 3, 2015
Please refer to important disclosures at the end of this report
1
Nilkamal | 2QFY2016 Result Update
Exhibit 1: 2QFY2016 performance
Y/E March (` cr)
2QFY16
2QFY15
yoy chg (%)
1QFY16
qoq chg (%)
1HFY16
1HFY15
% chg
Net Sales
482
458
5.1
458
5.2
939
875
7.3
Net raw material
282
296
(4.7)
269
4.6
551
566
(2.6)
(% of Sales)
58.5
64.5
(603)bp
58.8
(36)bp
58.7
64.6
(596)bp
Staff Costs
32
28
14.4
31
3.4
64
56
14.1
(% of Sales)
6.7
6.2
55bp
6.8
(12)bp
6.8
6.4
41bp
Other Expenses
117
103
13.3
105
11.4
222
195
14.2
(% of Sales)
24.3
22.6
176bp
23.0
135bp
23.7
22.2
143bp
Total Expenditure
431
427
0.9
406
6.3
837
816
2.5
Operating Profit
50
31
63.3
52
(2.9)
102
59
72.8
OPM
10.4
6.7
372bp
11.3
(87)bp
10.9
6.8
412bp
Interest
4
8
(44.2)
5
(13.6)
9
15
0.0
Depreciation
13
14
(8.5)
12
2.6
25
28
(10.6)
Other Income
3.8
0.6
490.3
2.5
48.4
6
2
311.8
PBT
37
10
277.3
37
0.3
74
17
325.6
(% of Sales)
7.7
2.1
8.1
7.9
2.0
0.0
Tax
11
3
12
23
5
352
(% of PBT)
31
30
32
31
29
0.0
Reported PAT
26
7
276.1
25
1.8
51
12
314.6
PATM
5.3
1.5
5.5
5.4
1.4
0.0
Source: Company, Angel Research
Exhibit 2: Actual vs. Angel estimates (2QFY2016)
Actual (` cr)
Estimate (` cr)
Var (%)
Total Income
482
482
(0.2)
EBIDTA
50
52
(4.0)
EBIDTA margin (%)
10.4
10.9
(41)bp
Adjusted PAT
25.7
22
14.6
Source: Company, Angel Research
Results as per expectation, bottom-line aided by lower interest
outgo
NILK’s standalone top-line for the quarter witnessed a 5.1% yoy increase to
`482cr, in line with our estimate. The raw material cost as a percentage of sales
declined by 603bp yoy to 58.5%. As per our estimates, average polyethylene
prices declined by 18.5% on a yoy basis (8.4% decline on a qoq basis) during the
quarter, resulting in improved gross margins. However, the employee cost and
other expenses increased by 55bp yoy and 176bp yoy to 6.7% and 24.3% of sales,
respectively. As a result, the EBITDA margin expanded by 372bp yoy to 10.4%. We
had built in an EBITDA margin estimate of 10.9%.
The interest expense declined by 44.2% yoy to `4cr, which is on account of a
reduction in the company’s debt by `35cr. Also, the other income came in higher
at `3.8cr against `0.6cr in the same quarter of the previous year. Aided by a better
operating performance, lower interest outgo and higher other income, the net
profit came in at `26cr, which is higher than our estimate of `22cr.
November 4, 2015
2
Nilkamal | 2QFY2016 Result Update
As far as segmental performance is concerned, the Plastics division witnessed a
5.0% yoy revenue growth to `409cr and the margins for the segment improved by
565bp yoy to 11.1%. The lifestyle segment’s revenues grew by 6.6% yoy to `68cr
while the segment reported a profit of `1cr. The Others segment, which includes
the mattress business, saw a marginal decline in revenue, ie by 0.2% yoy to `8cr
while the segment reported a loss of `0.8cr.
Exhibit 3: Segment wise performance
Y/E March (` cr)
2QFY2016 2QFY2015
% chg (yoy) 1QFY2016
% chg (qoq)
Total Revenue
A) Plastics
409
389
5.0
402
1.8
B) Lifestyle
68
64
6.6
50
34.2
C) Others
8
9
(0.2)
8
3.7
Total
485
461
5.1
460
5.4
Less: Inter-Segmental Rev.
4
3
3
Net Sales
482
458
5.1
458
5.2
Segmental Profit
A) Plastics
45
21
113.9
47
(3.8)
B) Lifestyle
1
0
2,186.2
(2)
(145.4)
C) Others
(0.8)
(0)
345.4
(0)
742.1
Segmental Margin (%)
A) Plastics
11.1
5.4
565bp
11.7
(65)bp
B) Lifestyle
1.5
0.1
145bp
(4.5)
600bp
C) Others
(9.3)
(2.1)
(725)bp
(1.1)
(819)bp
Source: Company, Angel Research
November 4, 2015
3
Nilkamal | 2QFY2016 Result Update
Investment Arguments
Plastics division to benefit from revival in economy
The Plastics business, accounts for ~86% of the company’s total revenue. Owing
to a poor macro environment, the Plastics division had witnessed volume de-
growth in FY2014. However, the division has rebounded well in FY2015, posting a
volume growth of 10%. We expect both the segments of the division, viz Material
Handling and Moulded Furniture, to benefit from an expected improvement in the
macro conditions in the country.
The Material Handling segment is B2B in nature and is an important part of
industrial activity. NILK is a ’One Stop Shop’ for material handling solutions, with
the company being the largest manufacturer of plastic crates and other products
like pallets, metal storage racks, and material handling equipment for various
industries. Supreme Industries, which is the second largest player in the MHE
segment in the industry is relatively smaller than Nilkamal.
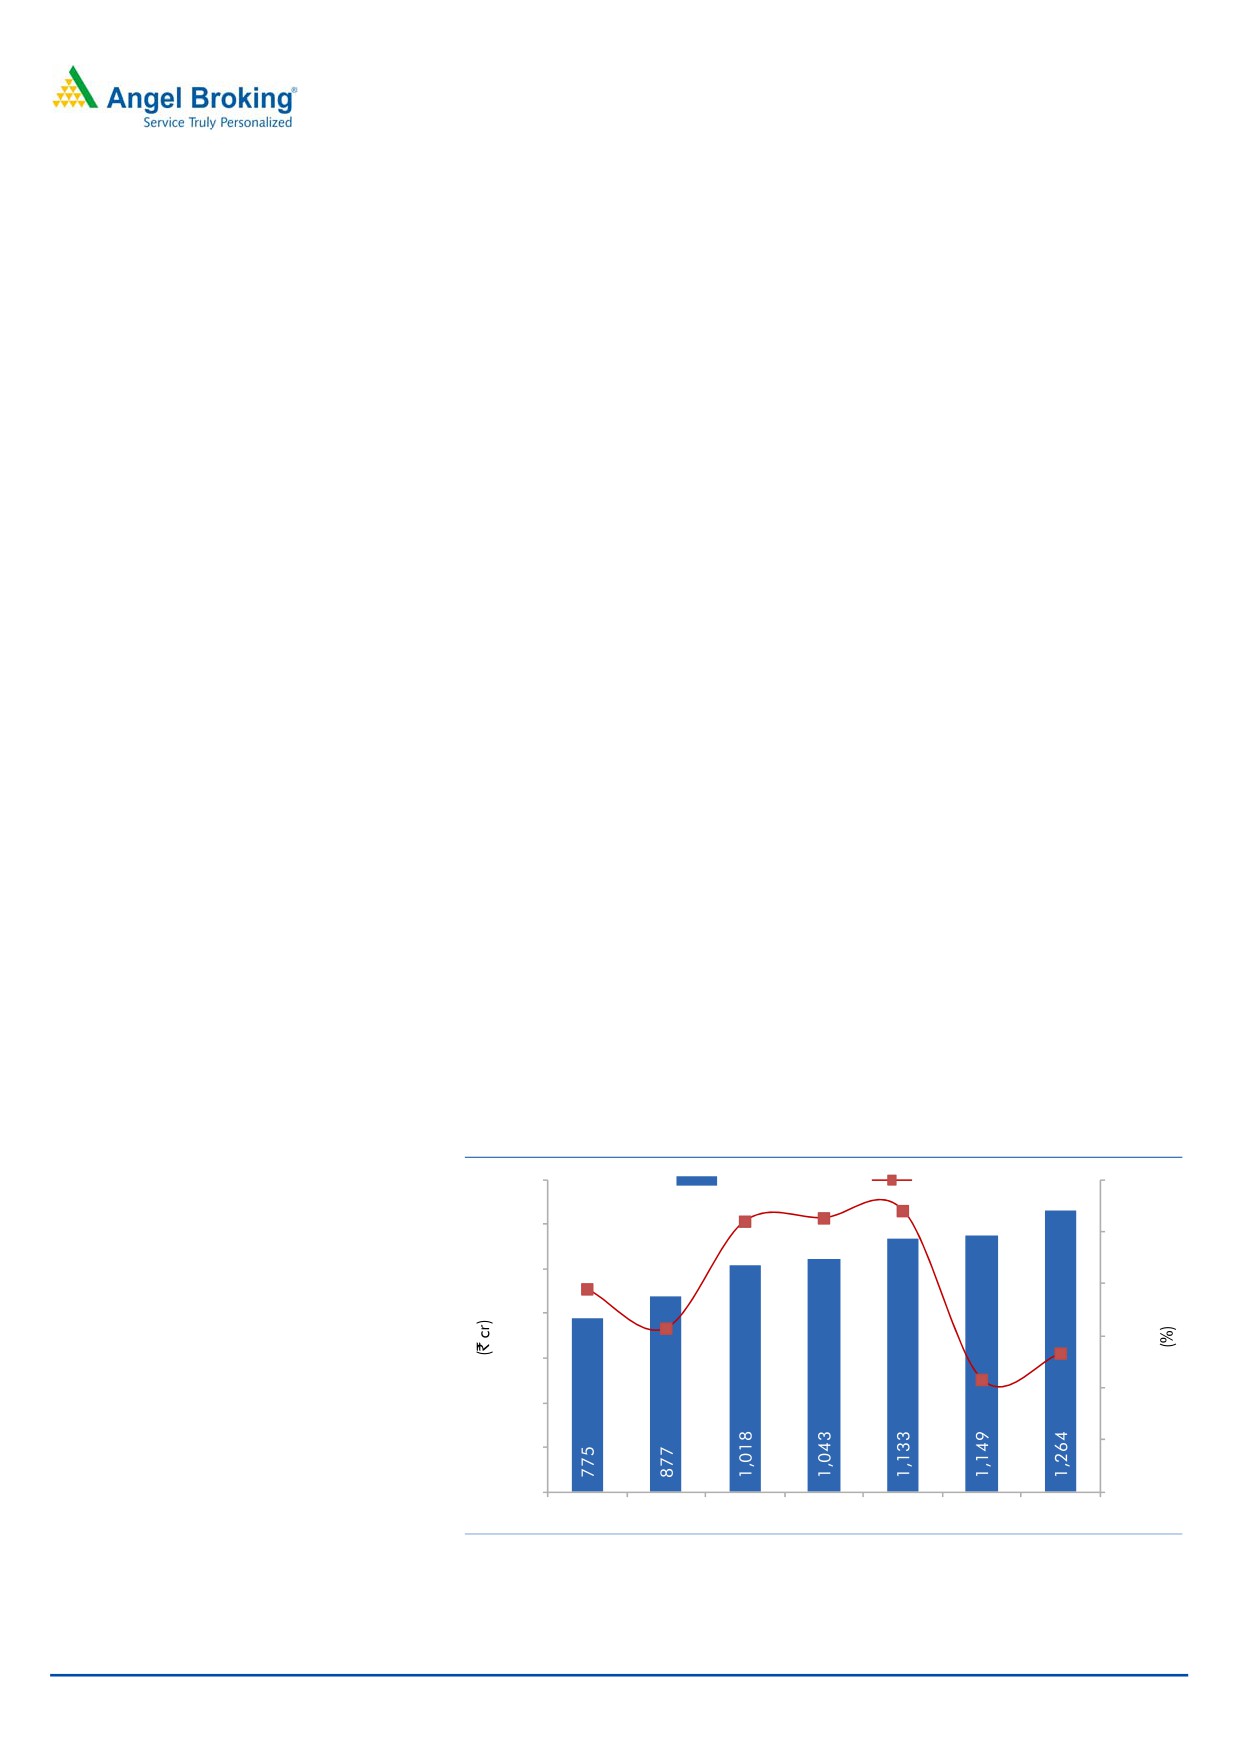
Stable raw material prices going ahead to lead to sustainable
margins
Since the year 2011 and until recent past, Brent crude has been trading at higher
levels of ~US$100/barrel, mainly due to higher consumption from China. A shift
from crude to alternate energy resources (shale) and a slowing global economy
have resulted in reduction in demand for crude, thereby causing Brent prices to
plummet from US$112/barrel in July 2014 to current levels of US$49/barrel,
down by ~56% during the period.
Polymer prices have declined in the past quarter by close to 18.5% on a yoy basis
tracing lower crude prices, thus benefiting NILK as polymers are the main raw
material for the plastic industry. Polymer prices are now expected to remain at
current levels, or increase by not more than 5% from here on, which should enable
NILK in maintaining its margins over FY2016-2017E.
Exhibit 4: Stable RM prices to help margins
1,400
Net Raw Material
As % of Sales
64.0
1,200
63.4
63.0
63.3
63.2
1,000
62.0
61.9
800
61.1
61.0
60.7
600
60.2
60.0
400
59.0
200
-
58.0
FY2011
FY2012
FY2013
FY2014
FY2015
FY2016E FY2017E
Source: Company, Angel Research
November 4, 2015
4
Nilkamal | 2QFY2016 Result Update
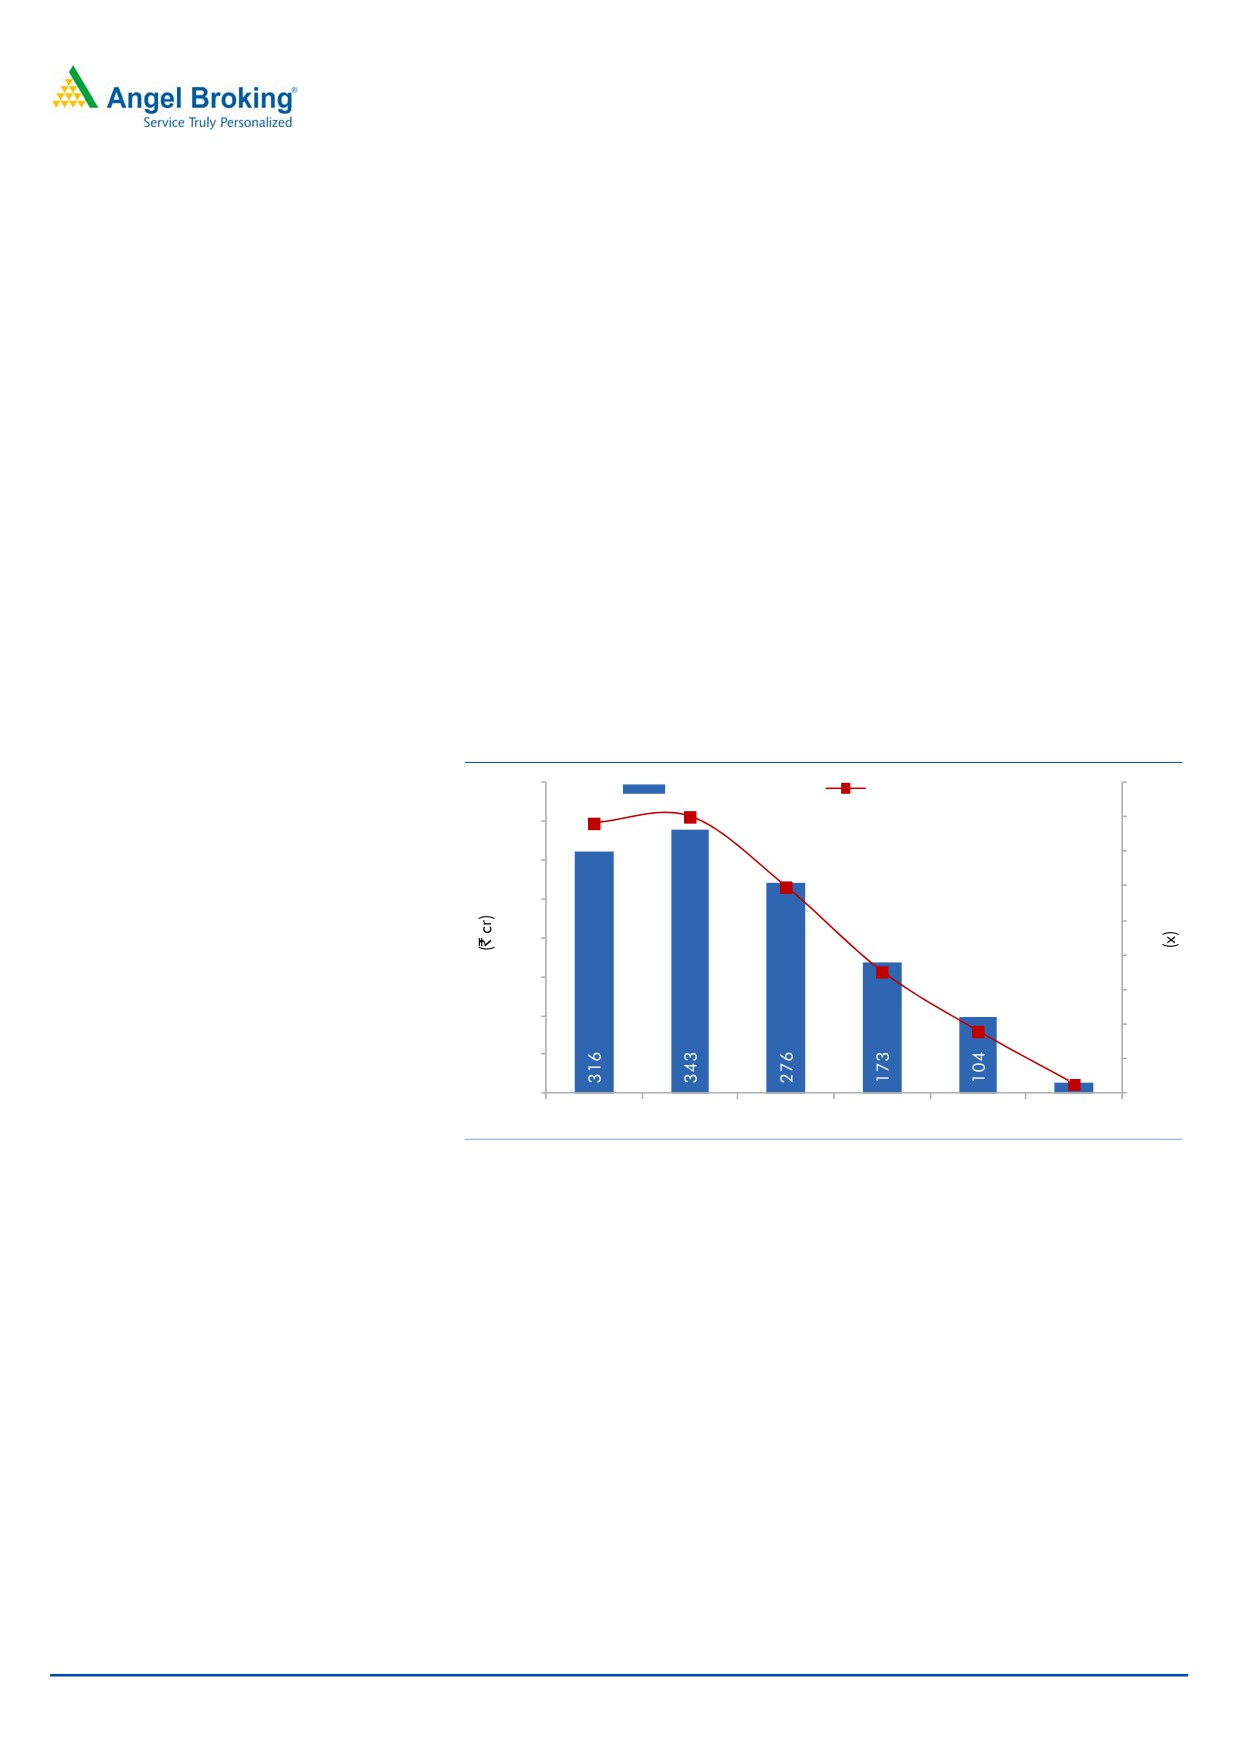
Strong Balance Sheet
NILK’s balance sheet is stress free with its net-debt/equity maintained below the
1.0x mark over the past three years. The debt level of the company declined
significantly in FY2015, while there was a further reduction by
~`35cr in
1HFY2016. The benefits of this are evident in the decline in interest expense over
the past two quarters which are adding directly to the bottom-line. As on FY2015,
the net debt to equity stood at 0.4x which we expect to decline to 0.2x levels by
FY2016E, with the current reduction in loans. We expect the company to be almost
net debt free by FY2017E. The company has sufficient capacity in place to cater to
improvement in demand and we expect operating leverage to come into play.
The asset turnover (Gross Block) is expected to increase from 2.5x in FY2015 to
2.7x in FY2017E due to an expected sales CAGR of 8.0% over FY2015-17E and
gross block CAGR of 4.0%. The working capital cycle has improved to 82 days in
FY2015 from 94 days in FY2014. This is on the back of inventory days coming
down to 59 days in FY2015 from 67days in FY2014 and with debtor days
declining from 50 days in FY2014 to 46 days in FY2015.
Exhibit 5: Net debt to equity to decline
405
Net Debt (LHS)
Net debt to equity (RHS)
0.9
355
0.8
0.8
0.8
0.7
305
0.6
0.6
255
0.5
205
0.4
0.4
155
0.3
105
0.2
0.2
55
0.1
0.0
5
0.0
FY2012
FY2013
FY2014
FY2015E FY2016E FY2017E
Source: Company, Angel Research
Increase in Promoter’s stake
The company’s Promoters have steadily increased their stake in the company over
the past few years from 61.0% to 64.1%. The Promoter of the company is said to
have the best insight into his business and this steady increase in stake indicates
that they are positive about the future prospects of the company.
November 4, 2015
5
Nilkamal | 2QFY2016 Result Update
Exhibit 6: Increase in Promoter’s Stake
64.1
64.1
64.5
64.0
63.6
63.2
63.2
63.5
63.0
62.2
62.2
62.2
62.5
62.0
61.5
61.0
61.0
60.5
60.0
59.5
59.0
Source: Company, Angel Research
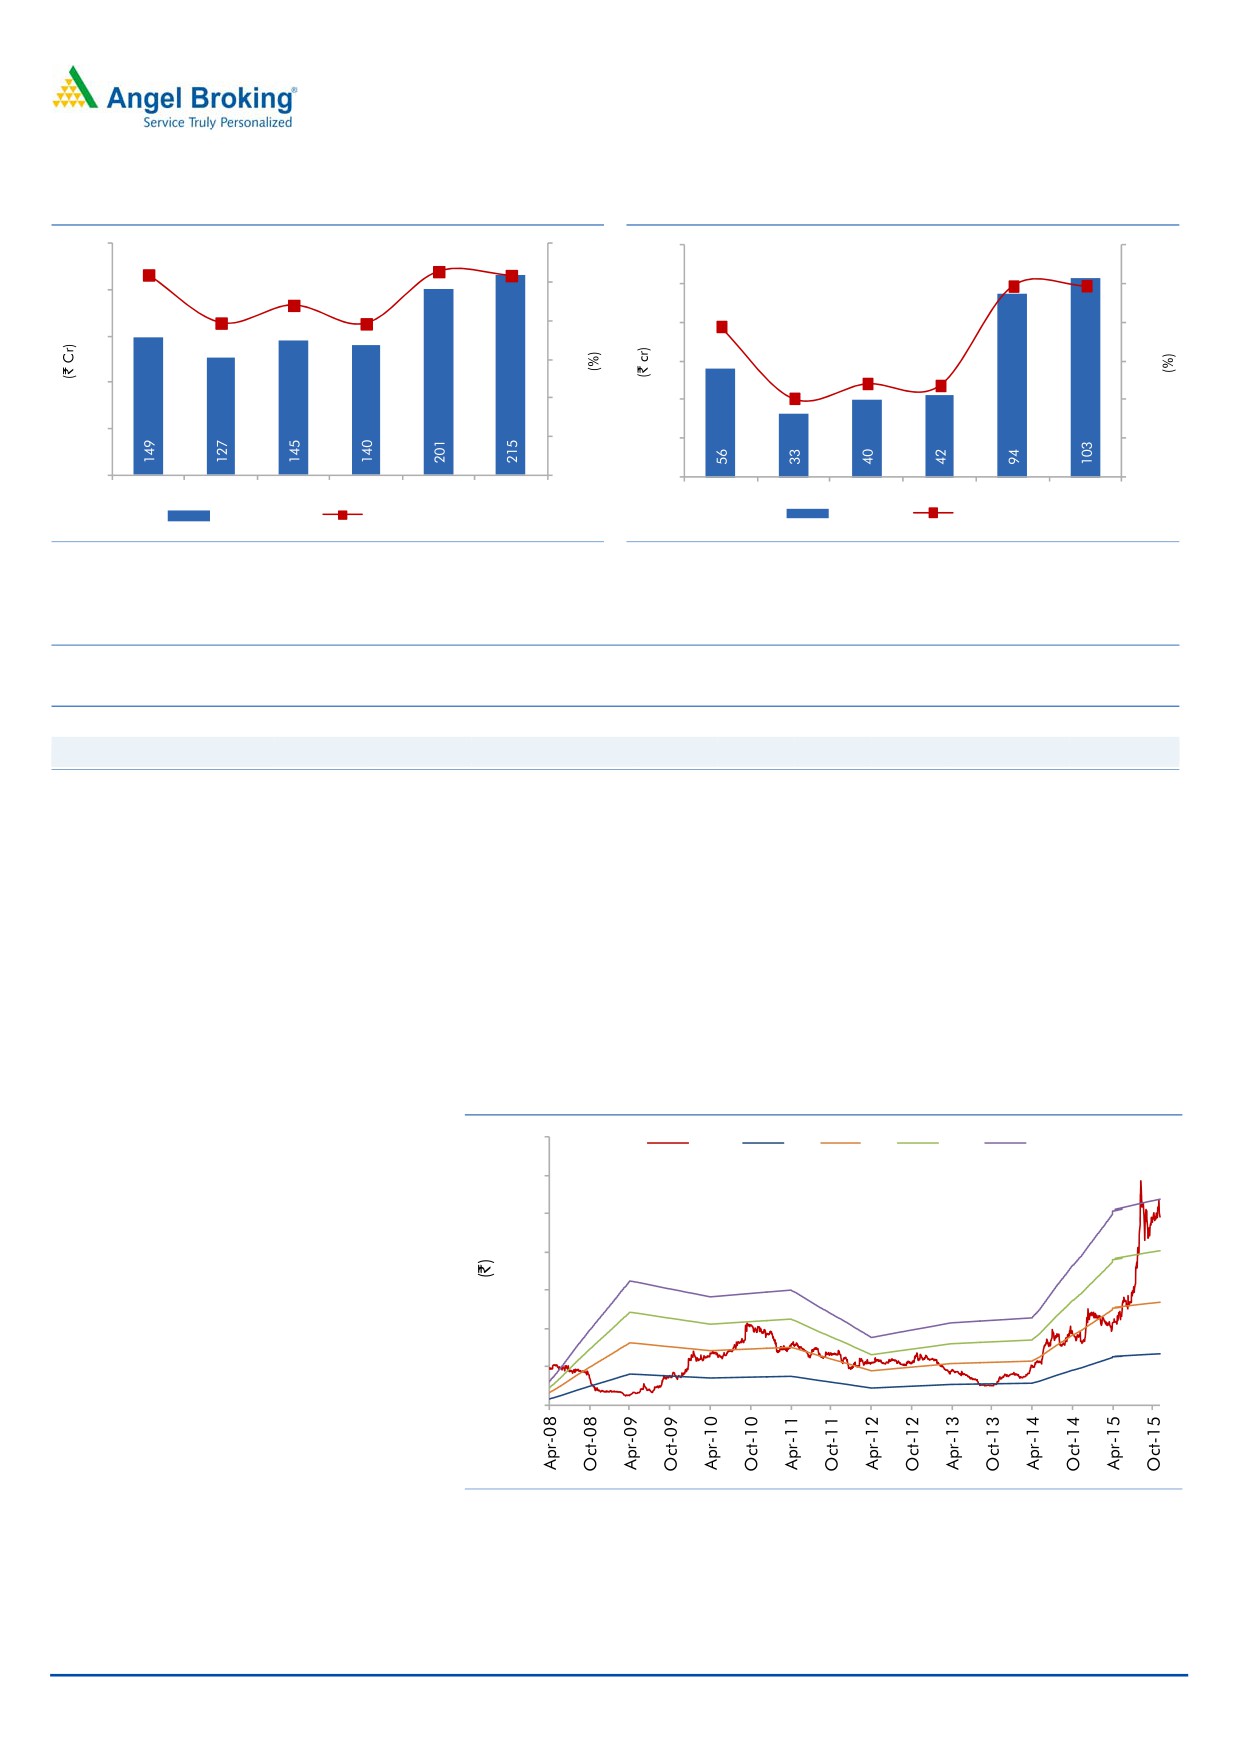
Financials
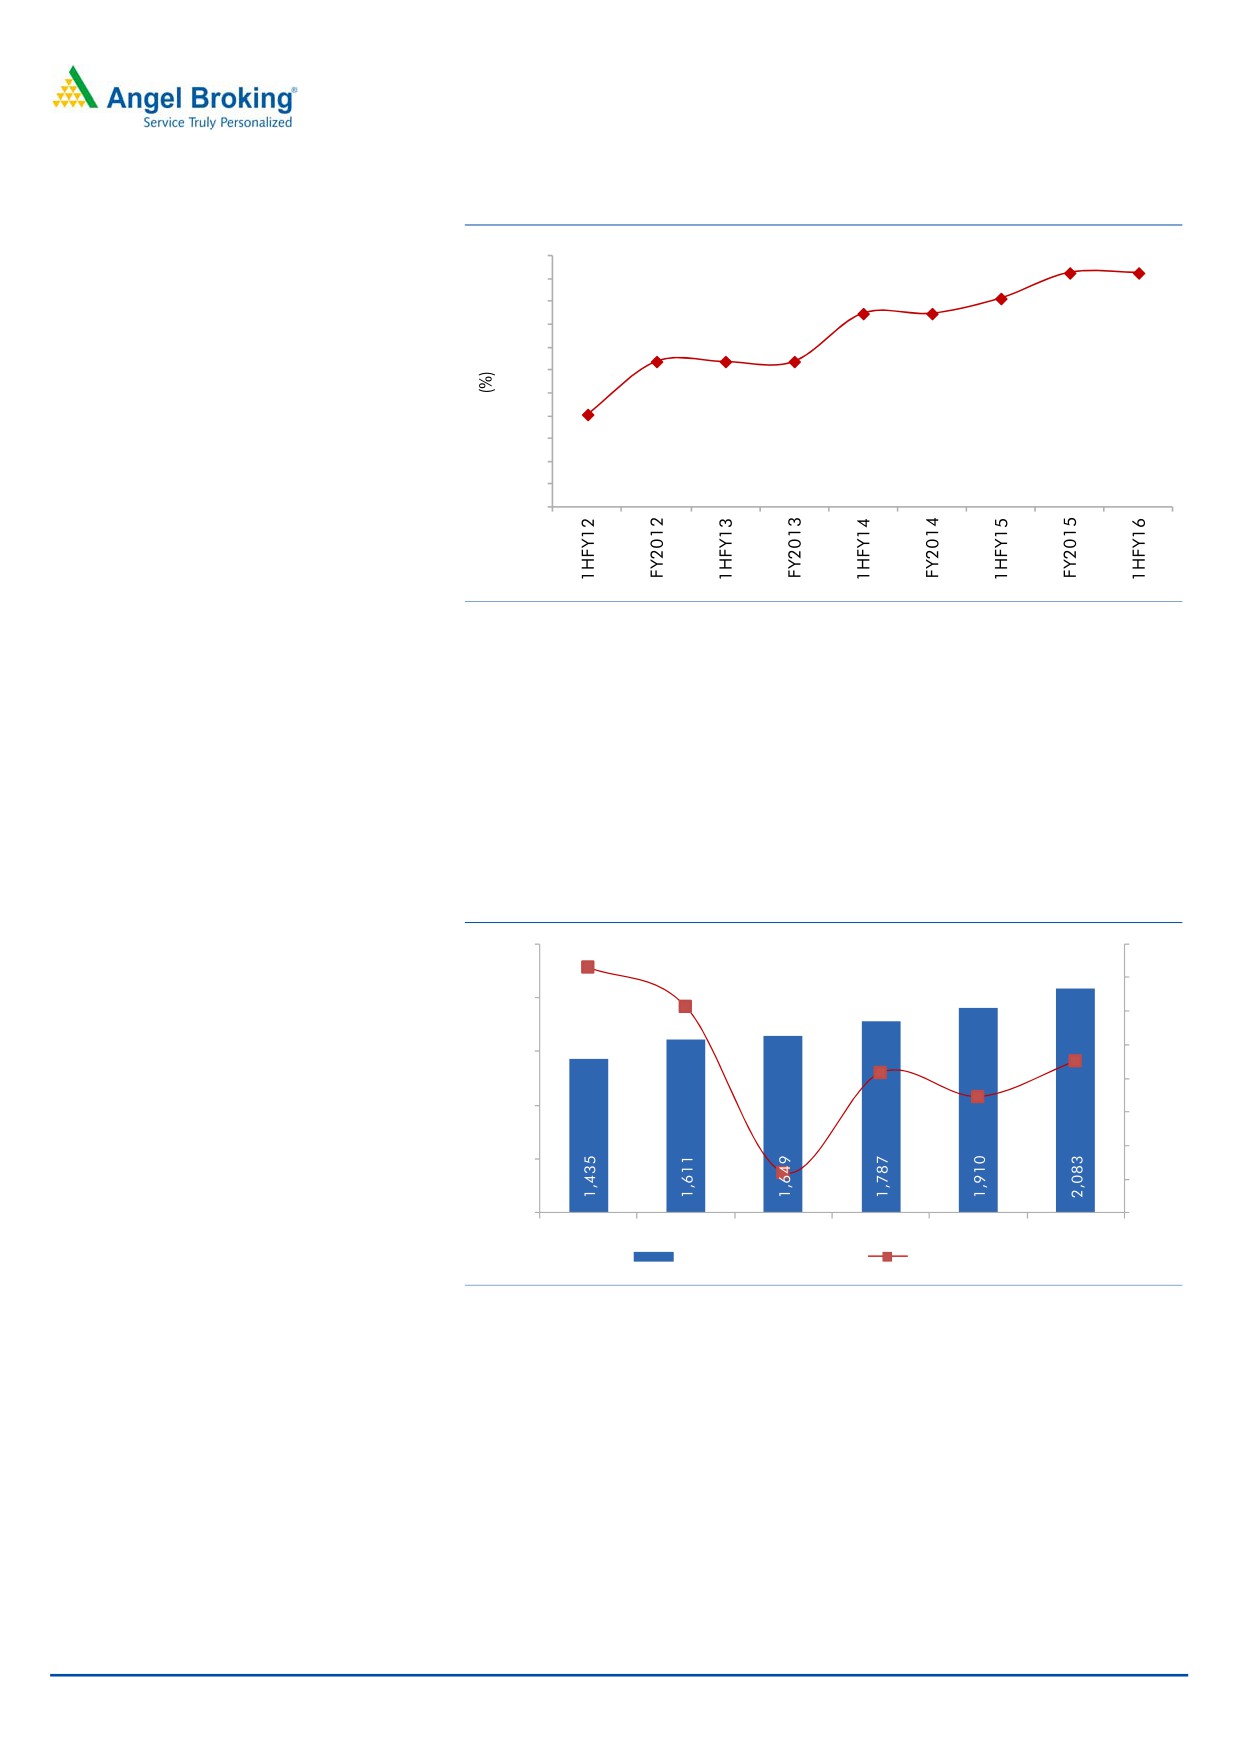
Revival in Indian economy to aid revenue growth
We are estimating the company’s Plastics division to post a CAGR of 9.0% over
FY2015E-17E resulting in the overall top-line registering a CAGR of 8.0% over
FY2015-2017E to `2,083cr in FY2017E.
Exhibit 7: Revenue to post 8.0% CAGR over FY2015-17E
2,500
16.0
14.6
14.0
2,000
12.3
12.0
10.0
1,500
8.3
9.0
6.9
8.0
1,000
6.0
4.0
500
2.4
2.0
-
0.0
FY2012
FY2013
FY2014
FY2015
FY2016E
FY2017E
Revenue (LHS ` cr)
Growth (RHS %)
Source: Company, Angel Research
We expect the EBITDA margin to improve marginally by
249bp over
FY2015-2017E to 10.3%. The company has reduced its debt level in FY2015E by
`95cr (net debt including current maturities) and it has reduced an additional
~`35cr in the current year. This has resulted in lower interest outgo so far. We
expect the benefits to add up to the bottom-line which in our view should more
than double to `103cr in FY2017E from `42cr in FY2015.
November 4, 2015
6
Nilkamal | 2QFY2016 Result Update
Exhibit 8: EBITDA margins to rebound
Exhibit 9: PAT trajectory
250
12.0
120
6.0
10.4
10.5
10.
3
4.9
8.8
10.0
100
5.0
5.0
200
7.9
7.8
8.0
80
3.9
4.0
150
6.0
60
2.4
3.0
2.4
100
4.0
40
2.0
2.0
50
2.0
20
1.0
0
0.0
0
0.0
FY2012
FY2013
FY2014
FY2015
FY2016E FY2017E
FY2012
FY2013
FY2014
FY2015E FY2016E FY2017E
EBITDA (LHS)
EBITDA Margin (RHS)
PAT (LHS)
PATM (RHS)
Source: Company, Angel Research
Source: Company, Angel Research
Exhibit 10: Relative valuation (Trailing twelve months)
Company
Mcap
Sales
OPM
PAT
EPS
RoE
P/E
P/BV
EV/BITDA
EV/Sales
(` cr)
(` cr)
(%)
(` cr)
(`)
(%)
(x)
(x)
(x)
(x)
Nilkamal
1,749
1,841
9.8
81
54.4
14.9
21.5
3.2
10.2
1.0
8,031
4,237
15.9
322
25.3
25.9
25.0
6.5
11.9
1.9
Supreme Industries
Source: Company, Angel Research
Outlook and Valuation
We expect the Material Handling segment of the Plastics division to be the main
beneficiary from an expected up-turn in the economy. We have built in revenue
CAGR of 8.0% over FY2015-17E to `2,083cr. The EBITDA margin is expected to
be at 10.3% in FY2017E. With lower interest out go, the net profit is expected to
be at `103cr in FY2017E. At the current market price, the stock is trading at
FY2017E PE of 16.9x. We have a Neutral rating on the stock.
Exhibit 11: One-year forward PE chart
1400
Price
4x
8x
12x
16x
1200
1000
800
600
400
200
0
Source: Company, Angel Research
November 4, 2015
7
Nilkamal | 2QFY2016 Result Update
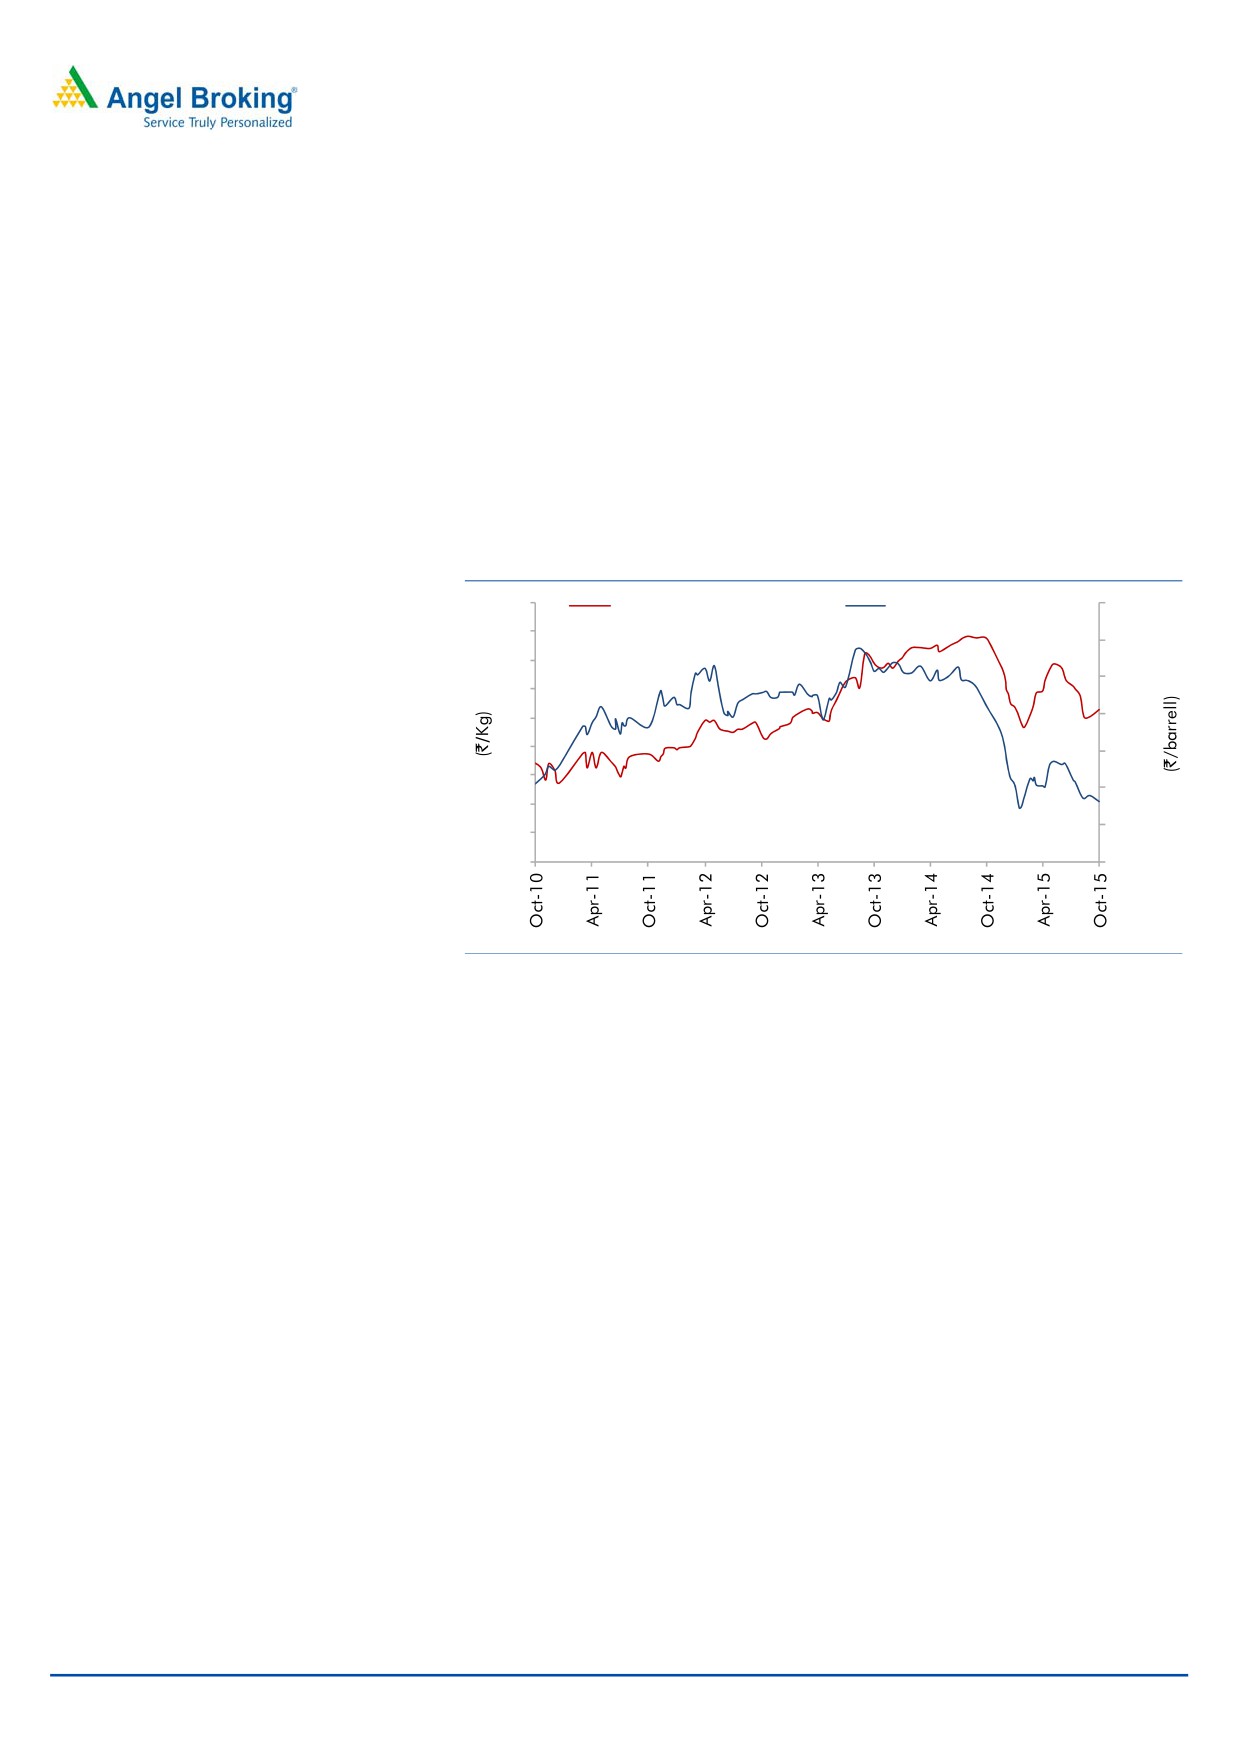
Concerns
Volatile raw material prices: Raw materials account for 63% of net sales.
High volatility in crude and raw material prices could have a negative impact
on the company’s performance.
Economic Slowdown: Economic slowdown will have a negative impact on
the performance of the company as both plastics and @home are dependent
on the economic scenario.
Competition from the unorganized segment: Availability of low priced
furniture from the unorganized segment poses a threat as they are able to
undercut prices by compromising on quality.
Exhibit 12: Crude and Polypropylene price fluctuation
130
Avg Polyethylene Prices (LHS)
Brent Prices INR (RHS)
8,500
120
7,500
110
6,500
100
90
5,500
93
80
4,500
70
3,500
60
3130
2,500
50
40
1,500
Source: Company, Angel Research
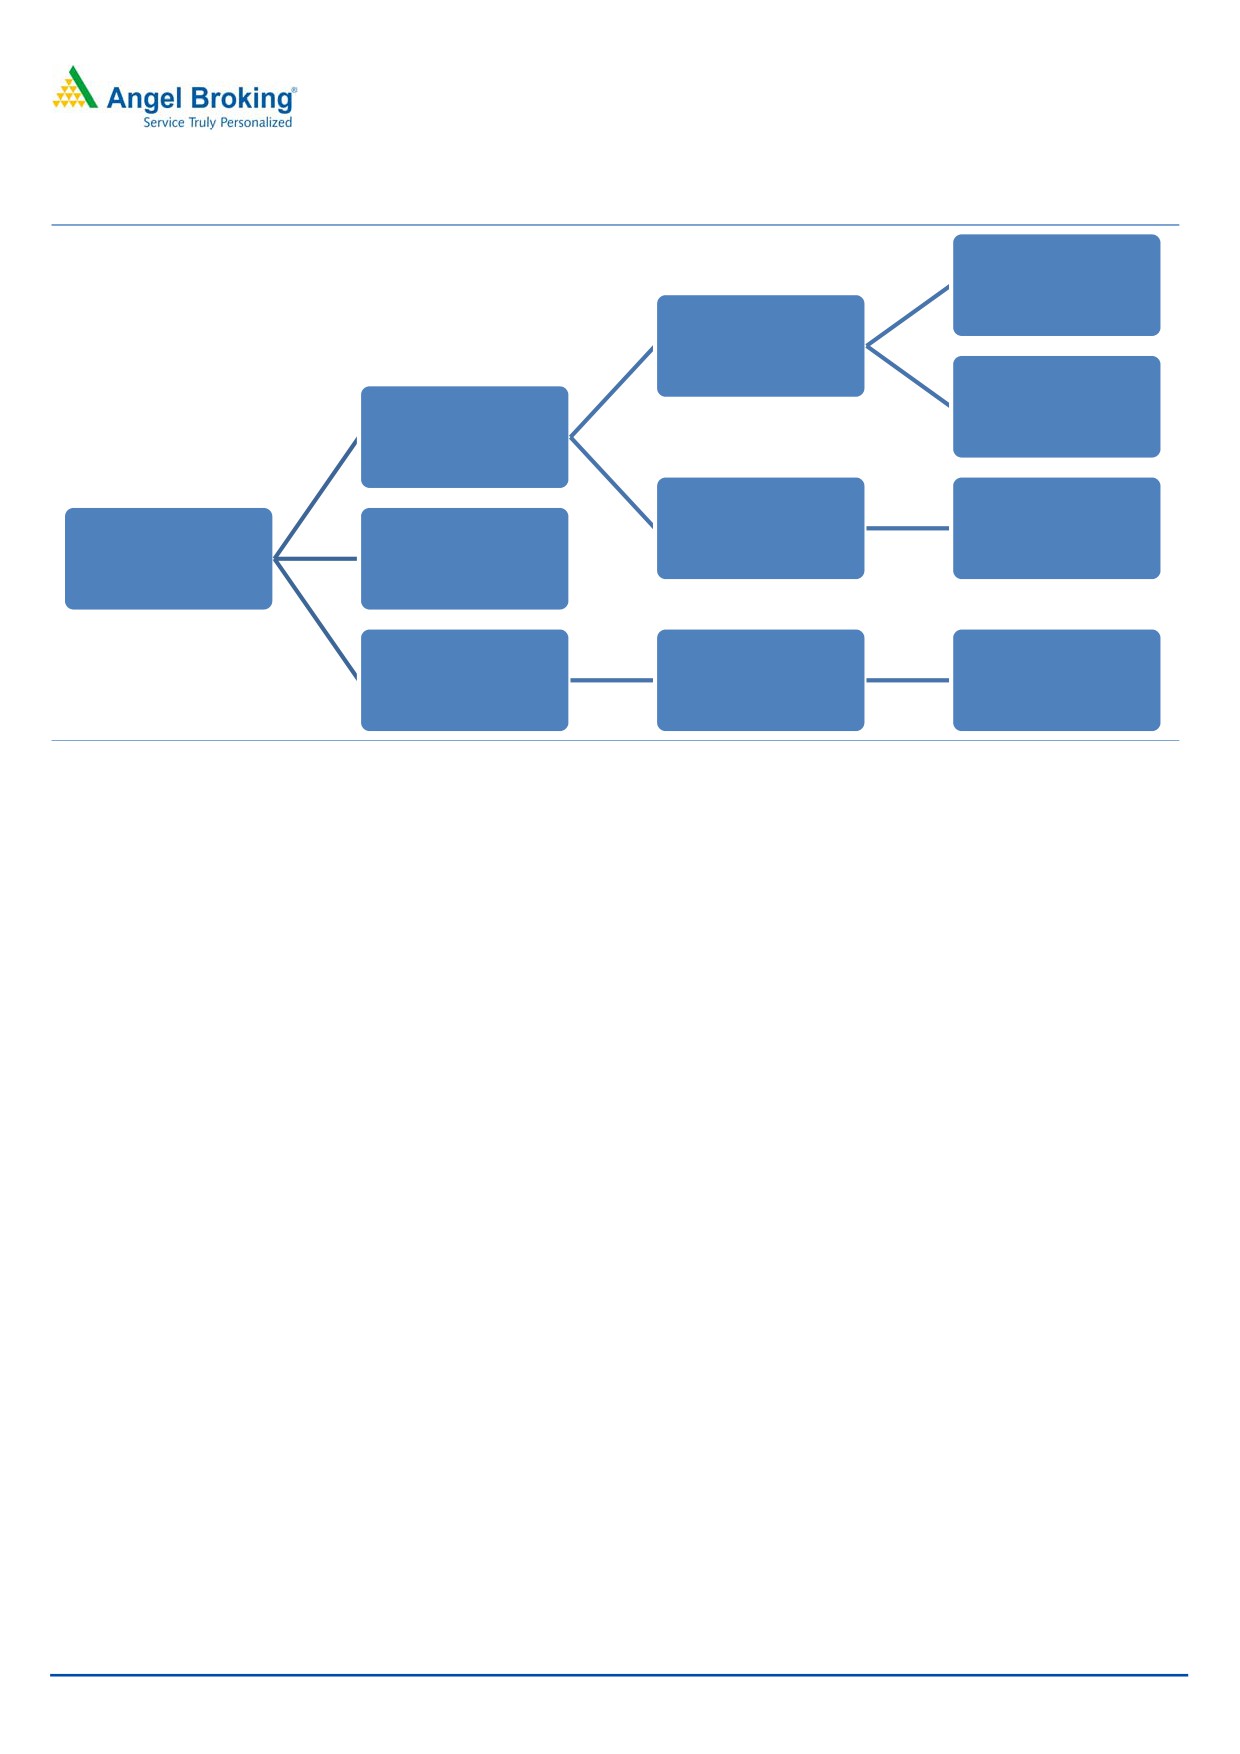
Company background
Incorporated in 1985, Nilkamal Ltd (NILK) is a market leader in moulded plastic
products. The company has three divisions, viz Plastics, Lifestyle Furniture, and
Furnishings and Accessories. The products of these divisions are sold through the
company’s retail chain “@home”; further, the company has recently forayed into
the mattress business. The company’s manufacturing plants are located at Barjora
and Hooghly in West Bengal, Hosur in Tamil Nadu, Jammu, Kharadapada and
Vasona in Dadra & Nagar Haveli, Noida in UP, Sinnor in Maharashtra and in
Pudducherry.
NILK is a market leader in the Material Handling segment, backed by its ability to
directly reach a very diverse set of industrial customers through
400+
self-employed sales people operating from 50+ regional sales offices across
India. The Moulded Furniture segment of the company enjoys a ~39% market
share in its category. NILK has 26 small format stores along with a strong network
of 40+ depots and 1000+ channel partners on a pan India basis, thus enabling it
to serve the remotest rural markets. Its retail store chain “@home”, operates
18 stores across 13 cities covering a retail space of over 3.15 lakh sq. ft.
November 4, 2015
8
Nilkamal | 2QFY2016 Result Update
Exhibit 13: NILK Divisions
Major Industries - Dairy,
Pharma, Logistics,
Agriculture, Seafood,
Hospitality
Material Hadling (58%)
Products - Crates, pallets,
metal storage racks,
forklifts and material
Plastics (83%)
handling equipment
Chairs, dining tables,
stools, sofas, trolleys,ready
Moulded Furniture (42%)
to assemble furtniture,
NILK
Mattress & others (4%)
office solutions.
@home - 19 large format
Home furniture,
Retail (13%)
store in 13 cities
furnishings, and
(over 3.15 lac sq.ft.)
accessories.
Source: Company, Angel Research
Subsidiaries
Nilkamal Eswaran Plastic Pvt. Ltd (Sri Lanka): 76% holding; the company is
a leading manufacturer of moulded furniture in Sri Lanka.
Nilkamal Eswaran Marketing Pvt. Ltd (Sri Lanka): 76% holding.
Nilkamal Crates & Bins FZE (UAE): A wholly owned subsidiary, manufacturing
and exporting plastic containers, pallets, parts bins, waste bins, ice boxes, metal
wire cage and hand pallet trucks.
Joint Ventures
Nilkamal BITO Storage Systems Pvt. Ltd: 50% JV; into manufacturing and selling of
metal storage systems.
Cambro Nilkamal Pvt Ltd: 50% JV; manufactures hospitality products suited for
large restaurants and hotels.
November 4, 2015
9
Nilkamal | 2QFY2016 Result Update
Profit and loss statement (standalone)
Y/E March (` cr)
FY2013
FY2014
FY2015E
FY2016E
FY2017E
Net Sales
1,611
1,649
1,787
1,910
2,083
Other operating income
-
-
-
-
-
Total operating income
1,611
1,649
1,787
1,910
2,083
% chg
12.3
2.4
8.3
6.9
9.0
Net Raw Materials
1,018
1,043
1,133
1,149
1,264
% chg
16.0
2.5
8.6
1.4
10.0
Power and Fuel
47
40
41
46
48
% chg
10.9
(15.8)
3.4
12.1
4.5
Personnel
102
105
113
122
131
% chg
12.9
3.7
7.2
8.2
7.3
Other
317
316
360
392
425
% chg
14.8
(0.4)
14.0
8.8
8.5
Total Expenditure
1,484
1,504
1,647
1,709
1,868
EBITDA
127
145
140
201
215
% chg
(14.7)
14.3
(3.4)
43.8
6.9
(% of Net Sales)
7.9
8.8
7.8
10.5
10.3
Depreciation & Amortisation
44
49
54
53
55
EBIT
82
96
86
149
160
% chg
(23.8)
16.5
(10.2)
72.4
7.4
(% of Net Sales)
5.1
5.8
4.8
7.8
7.7
Interest & other Charges
43
41
32
21
18
Other Income
4
4
6
12
10
(% of Net Sales)
0.3
0.2
0.3
0.6
0.5
Recurring PBT
39
55
54
127
141
% chg
(42.4)
38.3
(0.6)
134.7
11.1
PBT (reported)
44
58
61
139
152
Tax
12
18
18
44
49
(% of PBT)
28.6
31.1
29.8
32.0
32.0
PAT (reported)
31
40
42
94
103
Extraordinary Expense/(Inc.)
(2)
-
-
-
-
ADJ. PAT
33
40
42
94
103
% chg
(41.2)
21.7
6.1
122.5
9.3
(% of Net Sales)
2.0
2.4
2.4
4.9
5.0
Basic EPS (`)
22.1
26.8
28.5
63.3
69.2
Fully Diluted EPS (`)
22.1
26.8
28.5
63.3
69.2
% chg
(41.2)
21.7
6.1
122.5
9.3
Dividend
7
7
8
8
8
Retained Earning
24
33
35
87
96
November 4, 2015
10
Nilkamal | 2QFY2016 Result Update
Balance sheet (Standalone)
Y/E March (`cr)
FY2013
FY2014
FY2015E
FY2016E
FY2017E
SOURCES OF FUNDS
Equity Share Capital
15
15
15
15
15
Reserves& Surplus
414
448
478
564
660
Shareholders’ Funds
429
463
492
579
675
Total Loans
394
320
207
176
167
Other Long Term Liabilities
32
33
37
37
37
Long Term Provisions
7
7
7
7
7
Deferred Tax (Net)
22
24
16
16
16
Total Liabilities
885
847
759
815
902
APPLICATION OF FUNDS
Gross Block
681
717
716
745
774
Less: Acc. Depreciation
343
385
432
485
540
Less: Impairment
-
-
-
-
-
Net Block
338
333
284
260
234
Capital Work-in-Progress
4
2
1
1
1
Lease adjustment
-
-
-
-
-
Goodwill
-
-
-
-
-
Investments
25
26
26
26
26
Long Term Loans and adv.
51
56
52
52
52
Other Non-current asset
1
0
1
1
1
Current Assets
608
579
557
636
764
Cash
25
18
8
46
123
Loans & Advances
48
43
40
41
42
Inventory
305
301
277
309
337
Debtors
230
218
232
240
262
Other current assets
-
-
-
-
-
Current liabilities
143
149
161
161
176
Net Current Assets
465
430
395
475
587
Misc. Exp. not written off
-
-
-
-
-
Total Assets
885
847
759
815
902
November 4, 2015
11
Nilkamal | 2QFY2016 Result Update
Cash flow statement (Standalone)
Y/E March (`cr)
FY2013
FY2014
FY2015E FY2016E FY2017E
Profit before tax
44
58
61
139
152
Depreciation
44
49
54
53
55
Change in Working Capital
(52)
28
25
(41)
(36)
Direct taxes paid
(12)
(18)
(27)
(44)
(49)
Others
(4)
(4)
(6)
(12)
(10)
Cash Flow from Operations
19
113
106
94
113
(Inc.)/Dec. in Fixed Assets
(51)
(34)
2
(29)
(30)
(Inc.)/Dec. in Investments
0
(0)
0
0
0
(Incr)/Decr In LT loans & adv.
(1)
(5)
4
-
-
Others
4
4
6
12
10
Cash Flow from Investing
(48)
(36)
12
(17)
(19)
Issue of Equity
-
-
-
-
-
Inc./(Dec.) in loans
32
(74)
(109)
(31)
(9)
Dividend Paid (Incl. Tax)
(7)
(7)
(8)
(8)
(8)
Others
9
(3)
(11)
-
-
Cash Flow from Financing
34
(84)
(128)
(39)
(17)
Inc./(Dec.) in Cash
5
(7)
(10)
38
77
Opening Cash balances
20
25
18
8
46
Closing Cash balances
25
18
8
46
123
November 4, 2015
12
Nilkamal | 2QFY2016 Result Update
Key Ratios (Standalone)
Y/E March
FY2013
FY2014
FY2015E
FY2016E
FY2017E
Valuation Ratio (x)
P/E (on FDEPS)
53.2
43.7
41.2
18.5
16.9
P/CEPS
22.6
19.7
18.2
11.9
11.0
P/BV
4.1
3.8
3.6
3.0
2.6
Dividend yield (%)
0.4
0.4
0.4
0.4
0.4
EV/Net sales
1.3
1.2
1.1
1.0
0.8
EV/EBITDA
16.5
14.0
13.7
9.2
8.2
EV / Total Assets
2.4
2.5
2.6
2.3
2.0
Per Share Data (`)
EPS (Basic)
22.1
26.8
28.5
63.3
69.2
EPS (fully diluted)
22.1
26.8
28.5
63.3
69.2
Cash EPS
51.8
59.6
64.5
98.5
106.3
DPS
4.7
4.6
4.5
4.5
4.5
Book Value
287.6
310.1
330.0
388.1
452.1
DuPont Analysis
EBIT margin
5.1
5.8
4.8
7.8
7.7
Tax retention ratio
0.7
0.7
0.7
0.7
0.7
Asset turnover (x)
2.1
2.1
2.4
2.7
2.8
ROIC (Post-tax)
7.6
8.3
8.1
14.1
14.9
Cost of Debt (Post Tax)
8.1
8.0
8.5
7.6
7.2
Leverage (x)
0.8
0.6
0.4
0.2
0.0
Operating ROE
7.1
8.6
8.0
15.3
15.1
Returns (%)
ROCE (Pre-tax)
9.9
11.4
11.0
19.3
19.0
Angel ROIC (Pre-tax)
10.6
12.1
11.6
20.7
21.9
ROE
7.9
9.0
8.9
17.6
16.5
Turnover ratios (x)
Asset TO (Gross Block)
2.5
2.4
2.5
2.6
2.7
Inventory / Net sales (days)
66
67
59
56
57
Receivables (days)
48
50
46
46
46
Payables (days)
34
36
34
34
34
WC cycle (ex-cash) (days)
94
94
82
78
78
Solvency ratios (x)
Net debt to equity
0.8
0.6
0.4
0.2
0.0
Net debt to EBITDA
2.7
1.9
1.2
0.5
0.1
Int. Coverage (EBIT/ Int.)
1.9
2.3
2.7
7.0
8.8
November 4, 2015
13
Nilkamal | 2QFY2016 Result Update
Research Team Tel: 022 - 39357800
DISCLAIMER
Angel Broking Private Limited (hereinafter referred to as “Angel”) is a registered Member of National Stock Exchange of India Limited,
Bombay Stock Exchange Limited and Metropolitan Stock Exchange of India Limited. It is also registered as a Depository Participant with
CDSL and Portfolio Manager with SEBI. It also has registration with AMFI as a Mutual Fund Distributor. Angel Broking Private Limited is
a registered entity with SEBI for Research Analyst in terms of SEBI (Research Analyst) Regulations, 2014 vide registration number
INH000000164. Angel or its associates has not been debarred/ suspended by SEBI or any other regulatory authority for accessing
/dealing in securities Market. Angel or its associates including its relatives/analyst do not hold any financial interest/beneficial
ownership of more than 1% in the company covered by Analyst. Angel or its associates/analyst has not received any compensation /
managed or co-managed public offering of securities of the company covered by Analyst during the past twelve months. Angel/analyst
has not served as an officer, director or employee of company covered by Analyst and has not been engaged in market making activity
of the company covered by Analyst.
This document is solely for the personal information of the recipient, and must not be singularly used as the basis of any investment
decision. Nothing in this document should be construed as investment or financial advice. Each recipient of this document should
make such investigations as they deem necessary to arrive at an independent evaluation of an investment in the securities of the
companies referred to in this document (including the merits and risks involved), and should consult their own advisors to determine
the merits and risks of such an investment.
Reports based on technical and derivative analysis center on studying charts of a stock's price movement, outstanding positions and
trading volume, as opposed to focusing on a company's fundamentals and, as such, may not match with a report on a company's
fundamentals.
The information in this document has been printed on the basis of publicly available information, internal data and other reliable
sources believed to be true, but we do not represent that it is accurate or complete and it should not be relied on as such, as this
document is for general guidance only. Angel Broking Pvt. Limited or any of its affiliates/ group companies shall not be in any way
responsible for any loss or damage that may arise to any person from any inadvertent error in the information contained in this report.
Angel Broking Pvt. Limited has not independently verified all the information contained within this document. Accordingly, we cannot
testify, nor make any representation or warranty, express or implied, to the accuracy, contents or data contained within this document.
While Angel Broking Pvt. Limited endeavors to update on a reasonable basis the information discussed in this material, there may be
regulatory, compliance, or other reasons that prevent us from doing so.
This document is being supplied to you solely for your information, and its contents, information or data may not be reproduced,
redistributed or passed on, directly or indirectly.
Neither Angel Broking Pvt. Limited, nor its directors, employees or affiliates shall be liable for any loss or damage that may arise from
or in connection with the use of this information.
Note: Please refer to the important ‘Stock Holding Disclosure' report on the Angel website (Research Section). Also, please refer to the
latest update on respective stocks for the disclosure status in respect of those stocks. Angel Broking Pvt. Limited and its affiliates may
have investment positions in the stocks recommended in this report.
Disclosure of Interest Statement
Nilkamal
1. Analyst ownership of the stock
No
2. Angel and its Group companies ownership of the stock
No
3. Angel and its Group companies' Directors ownership of the stock
No
4. Broking relationship with company covered
No
Note: We have not considered any Exposure below ` 1 lakh for Angel, its Group companies and Directors
Ratings (Based on expected returns
Buy (> 15%)
Accumulate (5% to 15%)
Neutral (-5 to 5%)
over 12 months investment period):
Reduce (-5% to -15%)
Sell (< -15%)
November 4, 2015
14