Initiating Coverage | Education
November 18, 2015
Navneet Education
ACCUMULATE
CMP
`88
A stable business model
Target Price
`97
Navneet Education’s is primarily engaged in the business of publishing educational
Investment Period
12 Months
material, in both print and digital formats. The company also manufactures paper and
non-paper stationary products.
Stock Info
Investment Arguments
Sector
Education
Business expansion to mitigate cyclical risk: NEL’s Publication business is seasonal in
Market Cap (` cr)
2,092
nature and any strong growth is dependent on major changes in the syllabus of
Maharashtra (market share of 60%) and Gujarat boards (market share of 65%). Now,
Net Debt (` cr)
138
the company is attempting to increase its revenues through business expansion in
Beta
0.5
different segments. It is taking initiatives like
52 Week High / Low
120 / 87
(a) Content publication for CBSE syllabus: Apart from Maharashtra and Gujarat, NEL
Avg. Daily Volume
20,049
is targeting to grow its presence in other states through its CBSE content business. It is
Face Value (`)
2
anticipated that the growth may continue to be strong in the segment on account of a
BSE Sensex
25,864
syllabus change and also with more schools in different states adopting CBSE curriculum.
Nifty
7,838
(b) Selling supplementary books to government: NEL takes orders to sell
Reuters Code
NAVN.BO
supplementary books to Maharashtra government, which get distributed to students in
Bloomberg Code
NELI@IN
government schools. In FY2013, NEL generated ~`27cr through this business. But in
FY2014, there were no government orders after many controversies arose related to
the issue of tenders. The tenders issue then got resolved and in FY2015 the company
Shareholding Pattern (%)
generated a revenue of around `25cr. Going forward, we expect the company to
achieve strong revenue from this segment.
Promoters
61.8
MF / Banks / Indian Fls
15.2
Higher exports to drive stationary growth business: In the Stationary segment, we
expect the company to report healthy growth in coming financial years on back of
FII / NRIs / OCBs
2.5
higher growth in exports. The company mainly exports to USA and Africa. Also, the
Indian Public / Others
20.5
company is looking to tap newer geographies like the Middle East. In FY2015, exports
in the segment reported a yoy growth of ~33% to ~`170cr. In FY2016, the company
Abs. (%)
3m 1yr
3yr
expects around `200cr from export sales. On the margin front, the company is
expecting a margin improvement by 30-40bp, benefitting from economies of scale.
Sensex
(7.8)
(1.7)
41.3
NEL
(12.2)
(10.8)
58.0
Outlook and Valuation: Given the company’s proven track record, its strong brand,
consistent performance of Government projects and E-Learning (Digital) segments,
and with it tapping new segments like CBSE across India, we expect it to report a
3 years - share price chart
healthy top-line and bottom-line CAGR of 4.1% and 5.5%, respectively, over FY2015-
17E. Moreover, NEL has repaid the `90cr loan which will lead to significant saving in
140
120
interest cost in the coming financial years. At the current market price, the stock trades
100
at a P/E of 14.4x its FY2017E EPS. We initiate coverage on the stock with an
80
Accumulate recommendation and target price of `97 (16x FY2017E EPS), indicating
60
an upside of ~11% in the stock price from the present levels.
40
20
Key financials
0
Y/E March (` cr)
FY2014
FY2015
FY2016E
FY2017E
Net sales
882
979
998
1,062
% chg
9.5
11.0
1.9
6.4
Net profit
115
130
137
145
Source: Company, Angel Research
% chg
8.0
13.1
5.1
5.9
EBITDA margin (%)
23.6
24.2
24.1
24.0
EPS (`)
4.8
5.5
5.8
6.1
P/E (x)
18.2
16.1
15.3
14.4
P/BV (x)
4.4
3.9
3.4
3.0
RoE (%)
24.1
24.0
22.0
20.5
RoCE (%)
25.6
30.1
26.9
25.7
Amarjeet S Maurya
EV/Sales (x)
2.6
2.2
2.2
2.0
022-39357800 Ext: 6831
EV/EBITDA (x)
10.9
9.2
9.1
8.5
Source: Company, Angel Research, Note: CMP as of November 17, 2015
Please refer to important disclosures at the end of this report
1
Navneet Education | Education
Investment Arguments
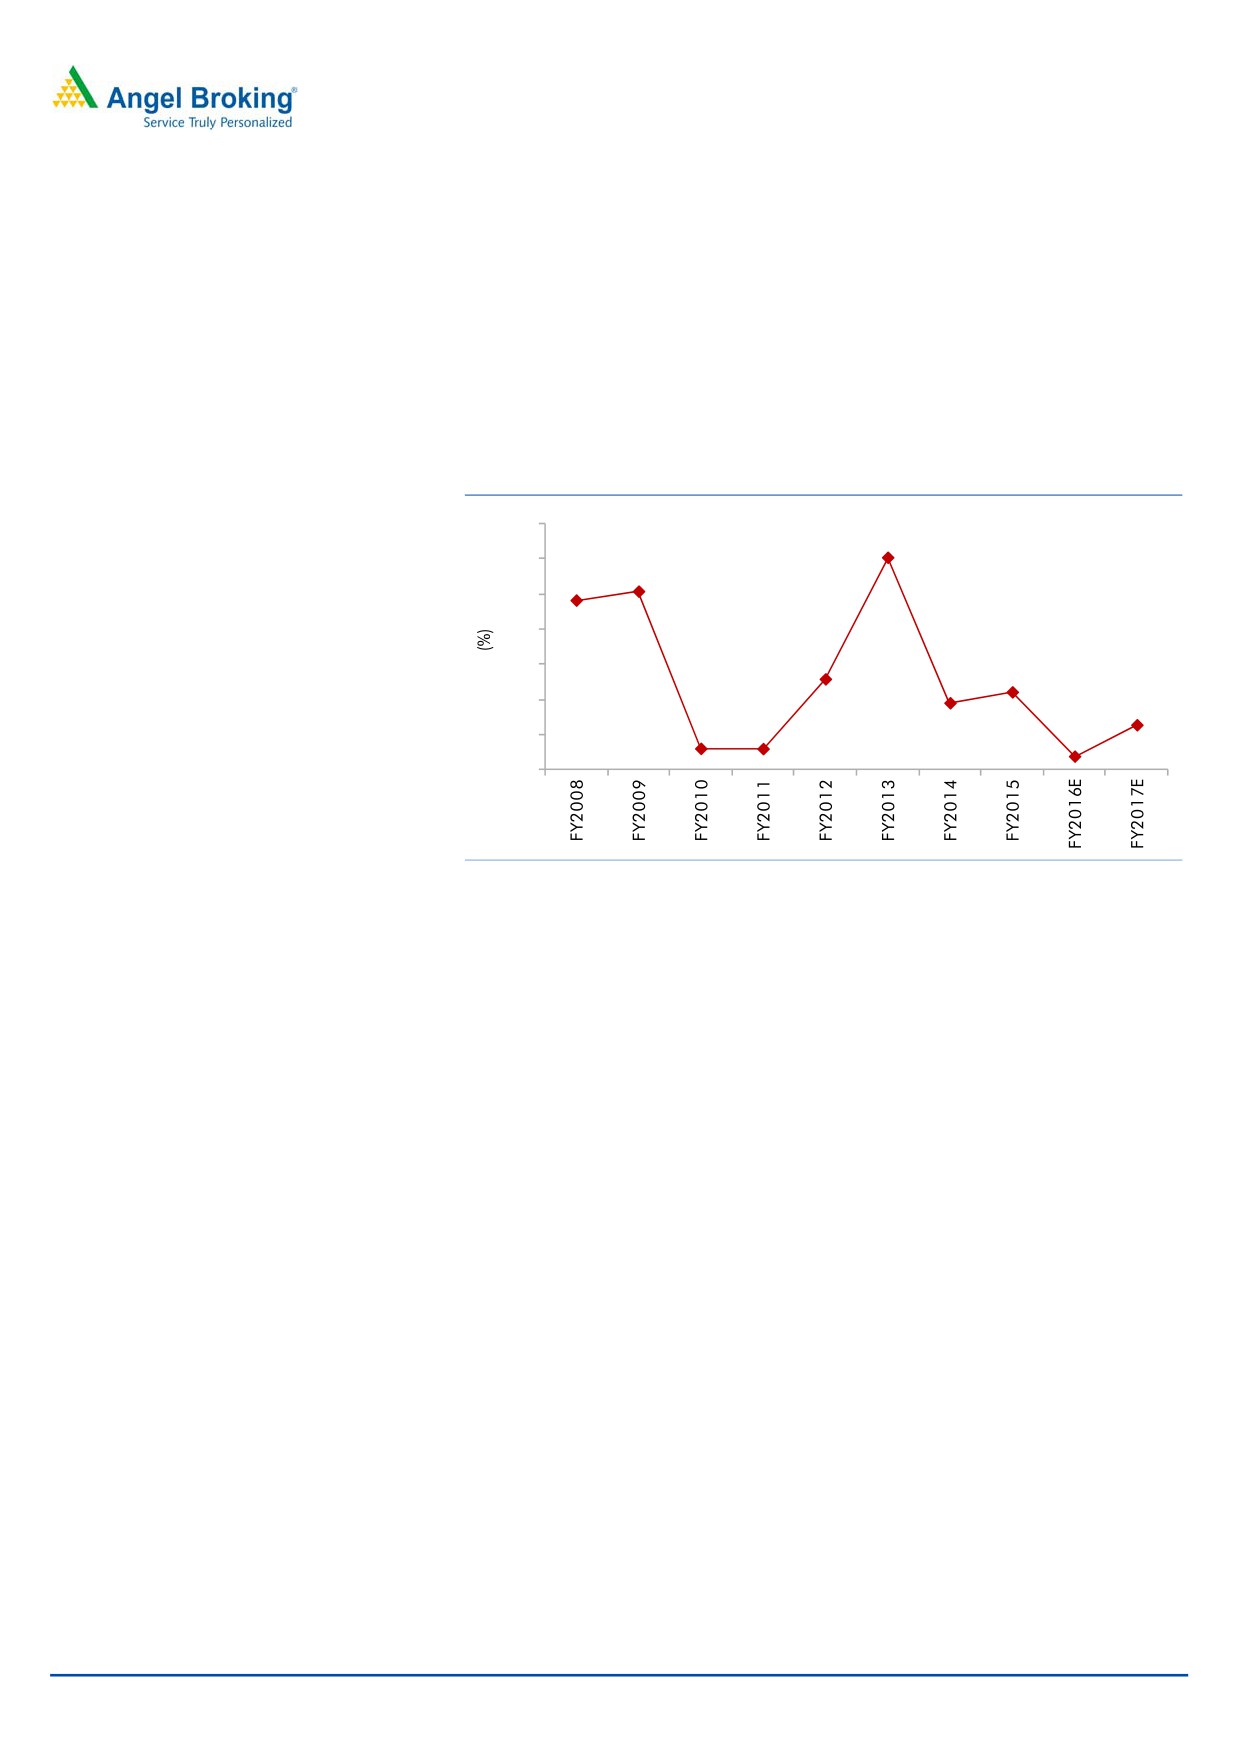
Top-line to report 4.1% CAGR over FY2015-17E
The company’s business mainly comprises of Publication, Stationary and
e-Learning segments. In the past, whenever there has been a major change in the
syllabuses of Maharashtra and Gujarat boards, NEL has reported a strong double
digit revenue growth. Going forward, in FY2016 and FY2017, there would be no
major change in syllabus.
Exhibit 1: Top-line performance tracking change in syllabus
35
30.2
30
25.4
24.1
25
Going forward, in FY2016 and FY2017,
20
there would be no major change in
12.9
15
11.0
syllabus
9.5
10
6.4
3.0
3.0
5
1.9
0
Source: Company, Angel Research
November 18, 2015
2
Navneet Education | Education
Exhibit 2: Syllabus change expected for FY16 & FY17
Academic
Maharashtra
Gujrat
Year
Std. Subject
Std.
Subject
I
All Subjects (All Mediums)
VI
All Subjects (English & Hindi Mediums)
II
All Subjects (All Mediums) VII All Subjects (English & Hindi Mediums)
All Languages
VIII
All Subjects (English & Hindi Mediums)
FY2014
X History & Political Science
Geography & Economics
Science - Environment
III
All Subjects (All Mediums)
I
All Subjects (Gujrati Medium)
IV
All Subjects (All Mediums)
II
All Subjects (Gujrati Medium)
FY2015
III
All Subjects (Gujrati Medium)
IV
All Subjects (Gujrati Medium)
V All Subjects (Gujrati Medium)
V
All Subjects (All Mediums)
I
All Subjects (English & Hindi Mediums)
VI
All Subjects (All Mediums)
II
All Subjects (English & Hindi Mediums)
FY2016
III
All Subjects (English & Hindi Mediums)
IV
All Subjects (English & Hindi Mediums)
V All Subjects (English & Hindi Mediums)
VII
All Subjects (All Mediums)
IX
All Subjects (All Mediums)
FY2017
VIII
All Subjects (All Mediums)
XI
All Commerce Subjects (All Mediums)
Source: Company, Angel Research
We expect healthy growth going forward, owing to the following reasons
(a) Adoption of CBSE syllabus on the rise across India: Apart from Maharashtra
and Gujarat, NEL is targeting to grow its presence in other states through its
CBSE content business. It is anticipated that the growth may continue to be in
double digits in the segment with more number of schools in different states
adopting CBSE curriculum.
Exhibit 3: CBSE segment’s expected revenue trend
60
In the CBSE segments, NEL expect
50
revenue of `30cr in FY16 & `50cr in
50
FY17
40
30
30
20
16
10
0
FY2015
FY2016E
FY2017E
Source: Company, Angel Research
November 18, 2015
3
Navneet Education | Education
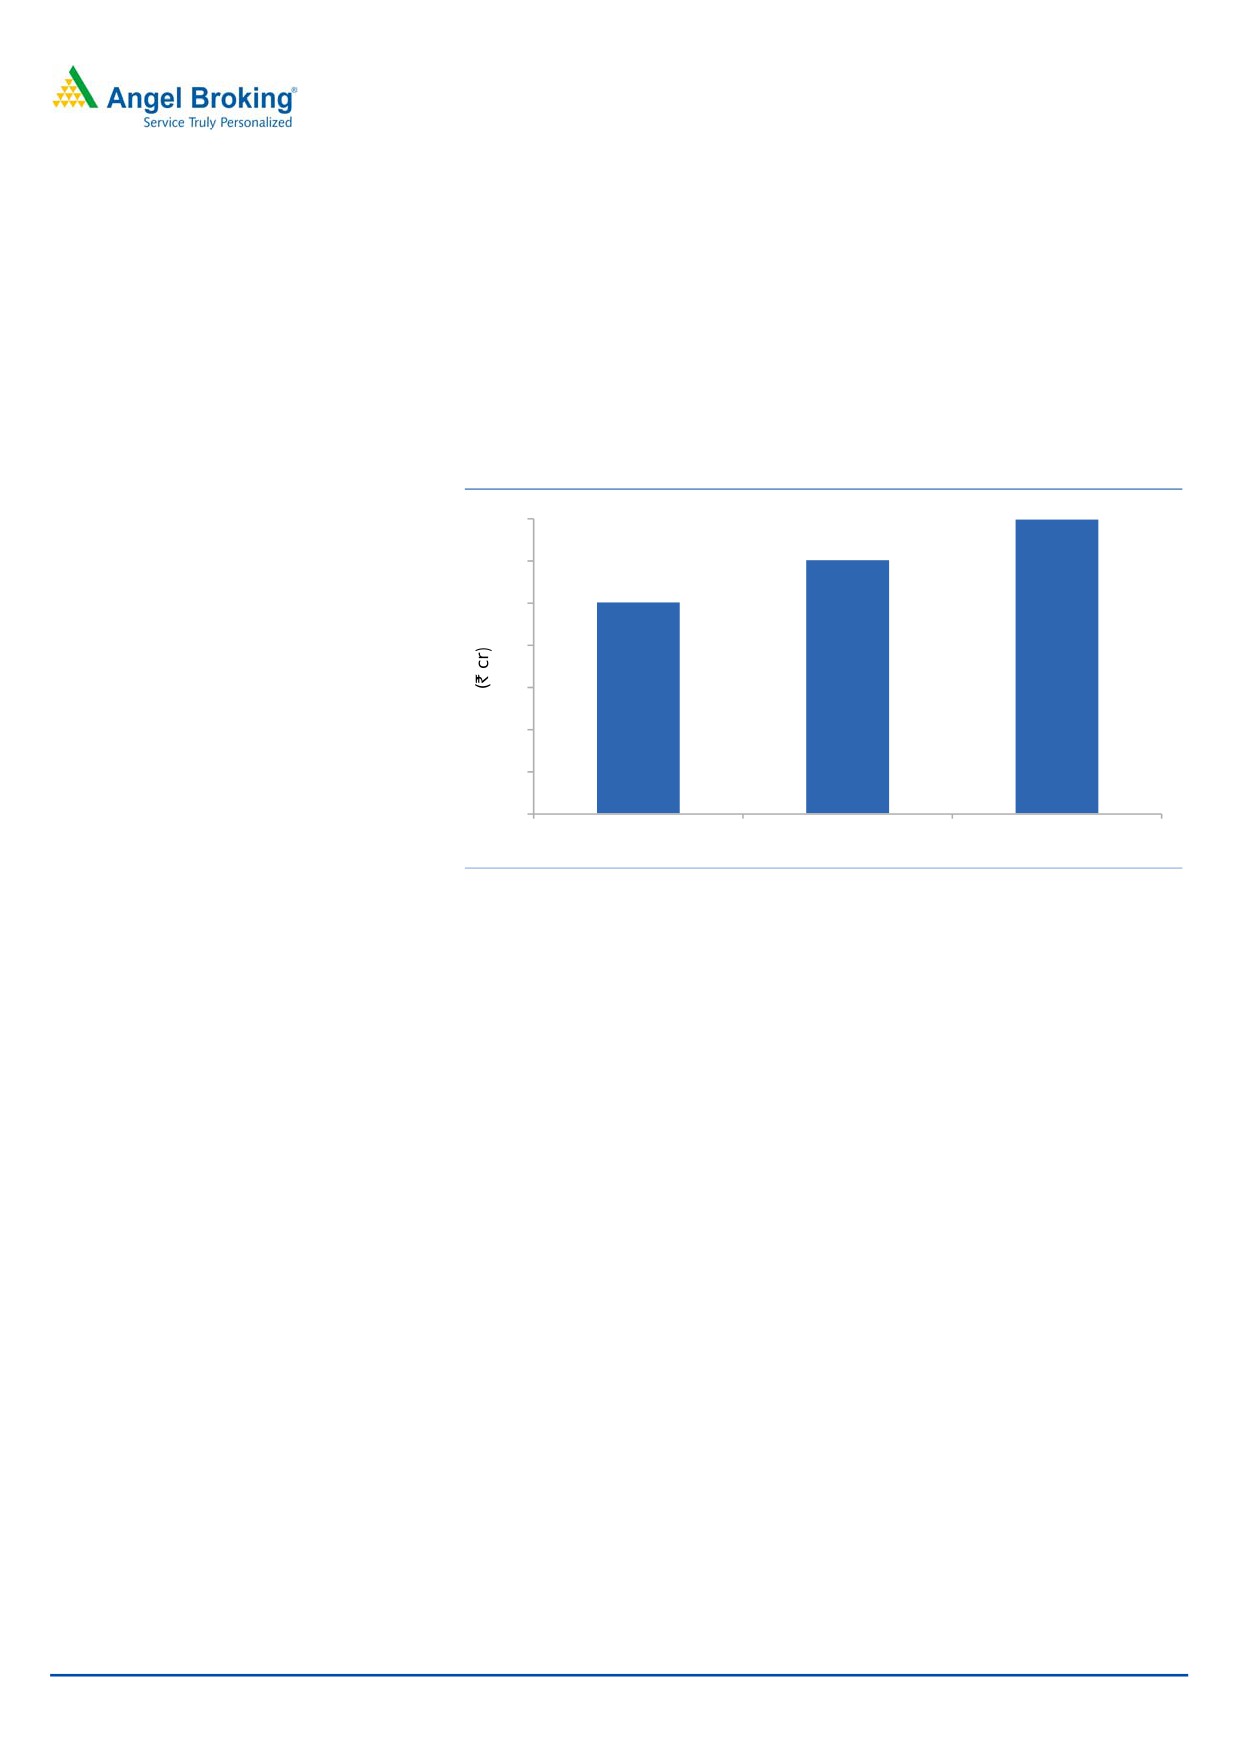
(b) Government Projects: NEL takes orders to sell supplementary books to
Maharashtra government, which get distributed to students in government
schools. In FY2013, NEL generated
~`27cr through the Government
segment. But in FY2014, there were no government orders after many
controversies arose related to the issue of tenders. The tenders issue then got
resolved and in FY2015 the company generated revenue of around `25cr.
Going forward, we expect the company to achieve strong revenue from this
segment.
Exhibit 4: Government orders’ expected revenue trend
35
35
30
30
25
25
20
15
10
5
0
FY2015
FY2016E
FY2017E
Source: Company, Angel Research
(c) E-Learning segment: In this segment, NEL is targeting products such as
e-learning tablets, cloud based interactive exams, application based audio
visuals and also B2B products such as ‘Top Class’ provided to educational
institutions. In FY2015, the company has generated a revenue of `20cr from
this segment. Going ahead, we expect decent growth from this segment.
Expect healthy growth in Stationary business
In the Stationary segment, we expect the company to report healthy growth in
coming financial years on back of higher growth in exports. The company mainly
NEL is looking to tap newer
exports to USA and Africa. Also, the company is looking to tap newer geographies
geographies like the Middle East &
like the Middle East. In FY2015, the company has reported ~33% growth. In
expects around
`200cr from export
FY2016, the company expects around `200cr from export sales. On the margin
sales in FY16
front, the company is expecting an improvement by 30-40bp, benefitting from
economies of scale.
November 18, 2015
4
Navneet Education | Education
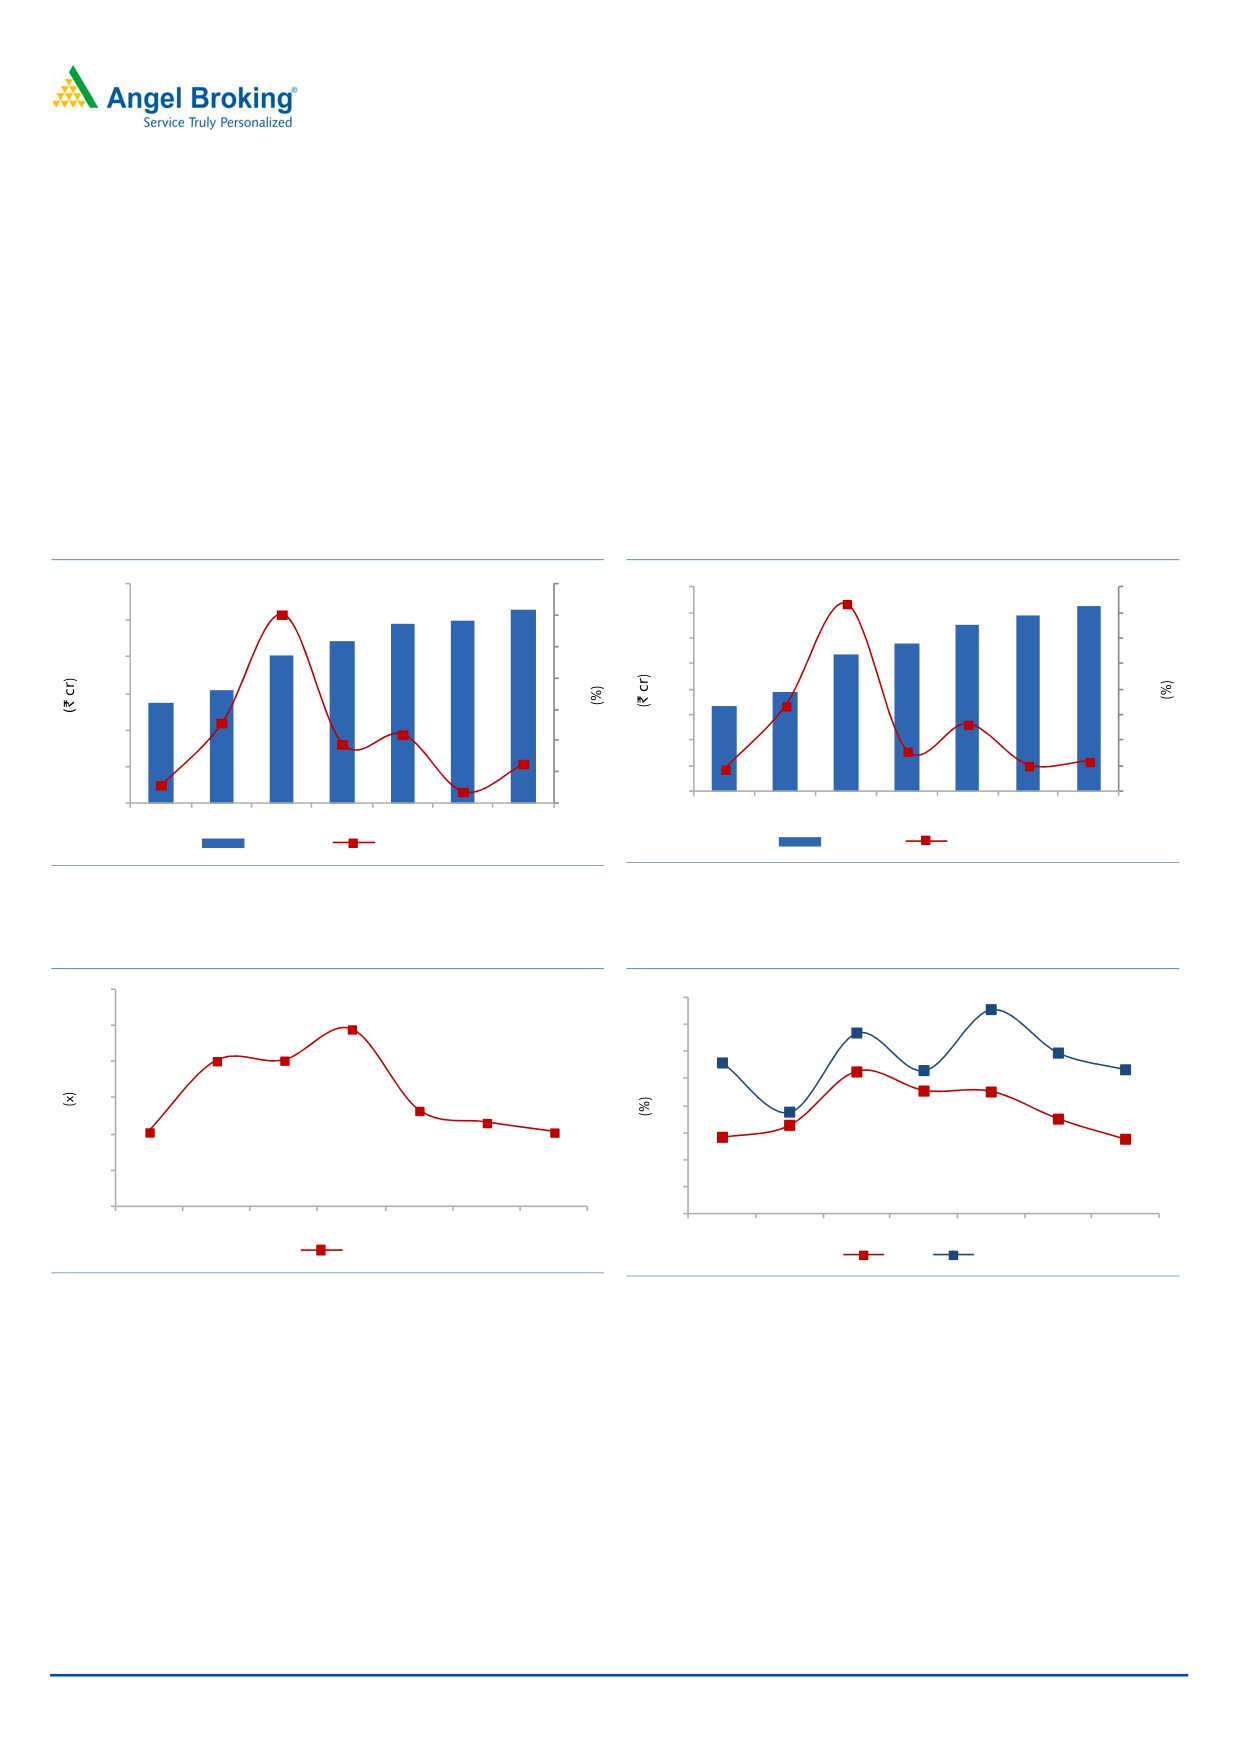
Financial outlook
Going ahead, we expect NEL to report
Going ahead, we expect NEL to report a top-line CAGR of 4.1% over FY2015-17E
a top-line CAGR of
~4.1% over
to ~`1,062cr owing to healthy growth in Publication as well as Stationery
FY2015-17E to ~`1,062cr
businesses. In the Publication business, we expect double-digit growth, driven by
growth in CBSE school, Government projects and E-Learning (Digital) segments.
On the bottom-line front, we expect the
On the bottom-line front, we expect the company to report a 5.5% CAGR over
company to report a 5.5% CAGR over
FY2015-17E on account of healthy top-line growth and operating margin.
FY2015-17E
Moreover, NEL has repaid the `90cr loan which will lead to significant saving in
interest costs in the coming financial years.
Exhibit 5: Projected Net Sales growth trend
Exhibit 6: Projected Net Profit growth trend
1,200
35
36.8
30.2
1,062
160
145
40
979
998
137
30
140
130
35
1,000
882
115
806
120
107
30
25
800
100
25
619
20
78
548
80
67
20
600
12.9
13.2
11.0
15
60
15
9.5
16.8
400
7.9
6.4
10
40
5.1
5.9
10
4.4
200
3.0
20
5
1.9
5
0
0
-
0
FY2011
FY2012
FY2013
FY2014
FY2015
FY2016E FY2017E
FY2011
FY2012
FY2013
FY2014
FY2015 FY2016E FY2017E
Net Sales
yoy growth (%)
Net Profit
yoy growth (%)
Source: Company, Angel Research
Source: Company, Angel Research
Exhibit 7: Debt/Equity trend
Exhibit 8: ROE and ROCE trend
30.1
0.6
31
0.5
28.4
0.5
29
26.9
0.4
0.4
26.2
27
25.6
25.7
0.4
25
0.3
22.5
0.3
25.5
0.2
23
0.2
0.2
24.1
24.0
0.2
21
22.0
21.6
19
20.7
20.5
0.1
17
0.0
15
FY2011
FY2012
FY2013
FY2014
FY2015
FY2016E FY2017E
FY2011
FY2012
FY2013
FY2014
FY2015
FY2016E FY2017E
D/E
ROE
ROCE
Source: Company, Angel Research
Source: Company, Angel Research
November 18, 2015
5
Navneet Education | Education
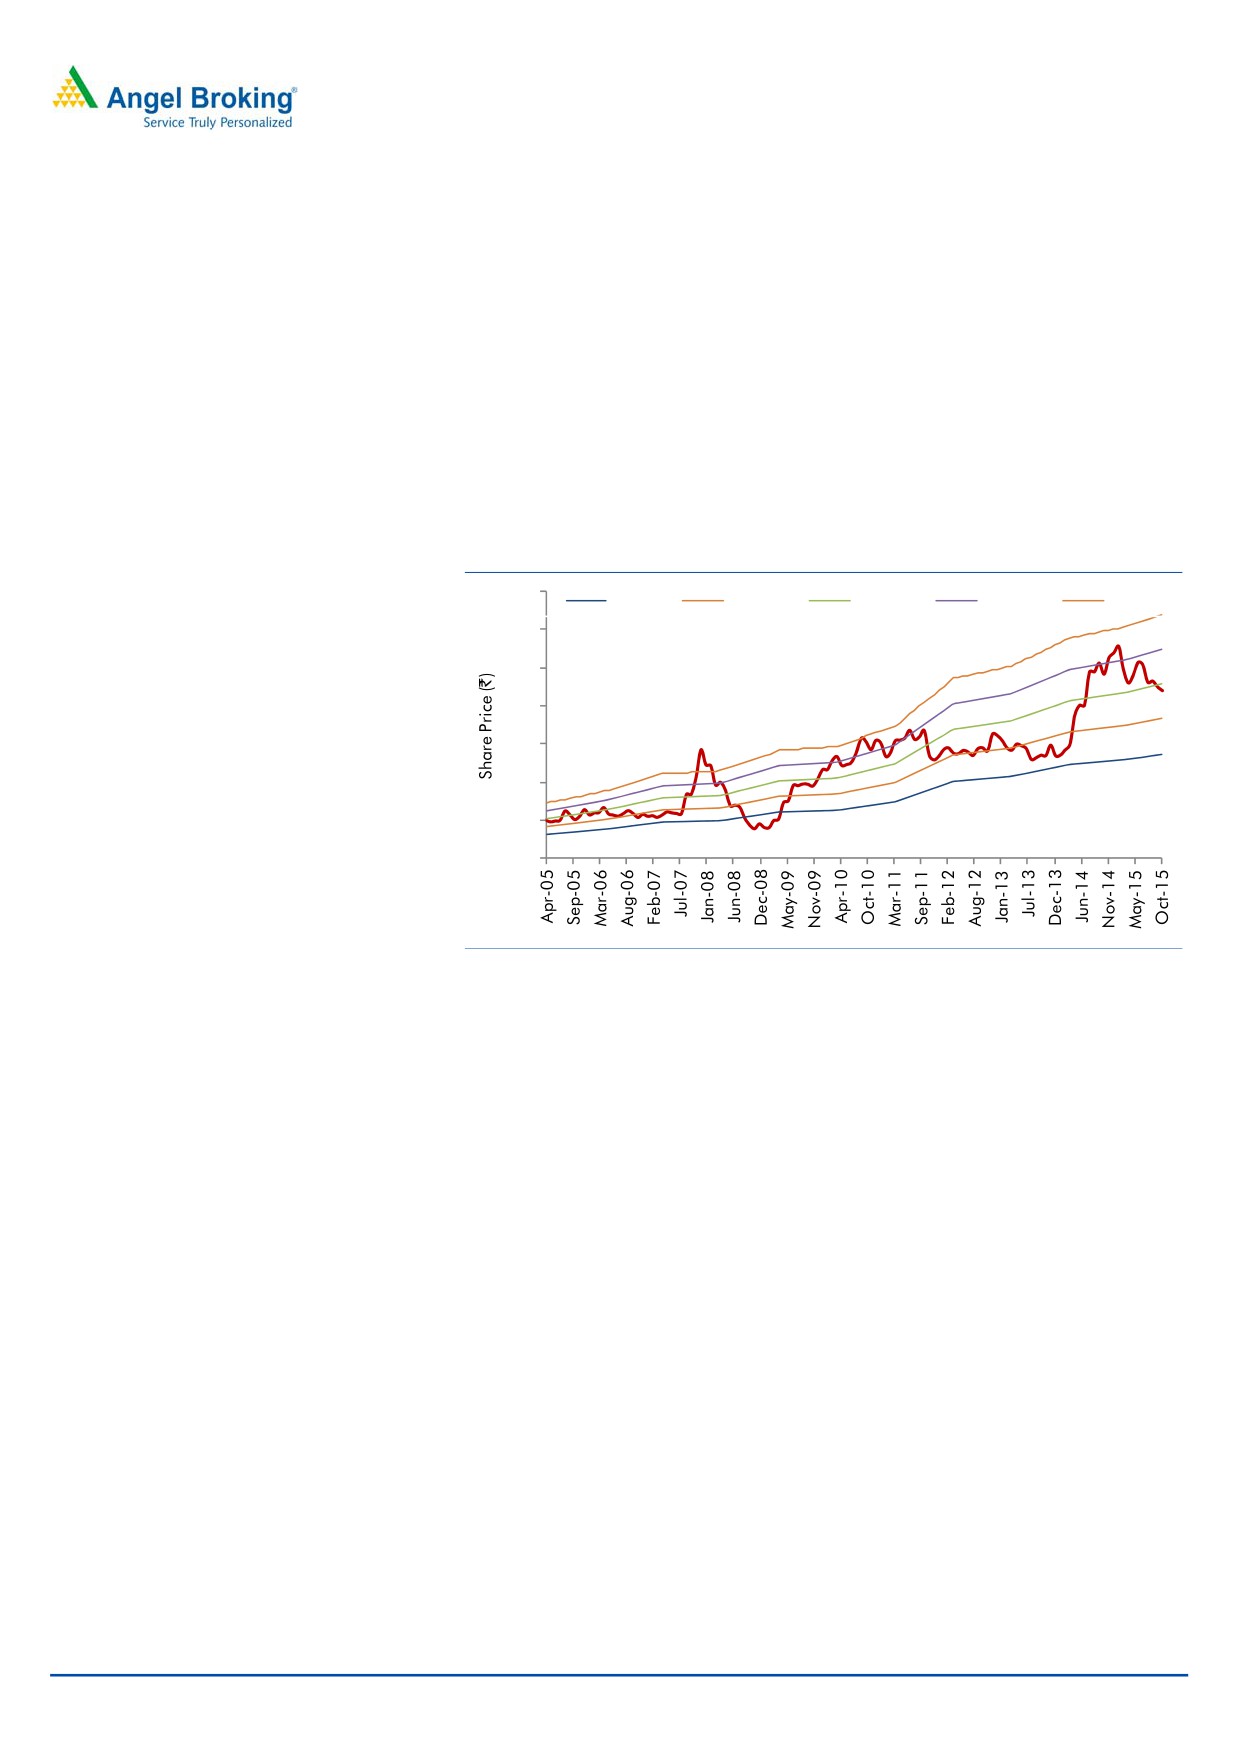
Outlook and Valuation
Given the company’s proven track record, its strong brand, consistent performance of
Government projects and E-Learning (Digital) segments, and with it tapping new
segments like CBSE across India, we expect it to report a healthy top-line and bottom-
line CAGR of 4.1% and 5.5%, respectively, over FY2015-17E. Moreover, NEL has
repaid the `90cr loan which will lead to significant saving in interest cost in the coming
financial years. At the current market price, the stock trades at a P/E of 14.4x its
FY2017E EPS. We initiate coverage on the stock with an Accumulate recommendation
and target price of `97 (16x FY2017E EPS), indicating an upside of ~11% in the stock
price from the present levels.
Exhibit 9: One year PE forward chart
140
9x
12x
15x
18x
21x
120
100
80
60
40
20
0
Source: Company, Angel Research
Downside risks to our estimates include 1) adverse volatility in currency exchange
rates could impact company’s profitability as
17% of the company’s total
consolidated revenue comes from exports sales (2) the company’s Publication
business is largely present in Maharashtra and Gujarat, which exposes the
company to concentration risk.
November 18, 2015
6
Navneet Education | Education
Company Background
Navneet Education Ltd, formerly Navneet Publication (India) Ltd, is in the business
of publication of knowledge based information in educational and general books
form as well as in electronic media, and manufacturing of paper and other
stationery products. The company’s segments include Publication and Stationery.
The company's products are sold under the brand names - Navneet, Vikas, Gala,
FfUuNn and Boss. The company’s portfolio of education based books includes
supplementary books like digests (guide) and workbooks, which are published in
five languages: English, Gujarati, Hindi, Marathi, and Urdu. The company also
publishes various titles in the children and general books category, which are not
based on syllabus, such as coloring and activity books, board books, story books
and books on health and hygiene, art and artist, cooking, mehendi, and
embroidery.
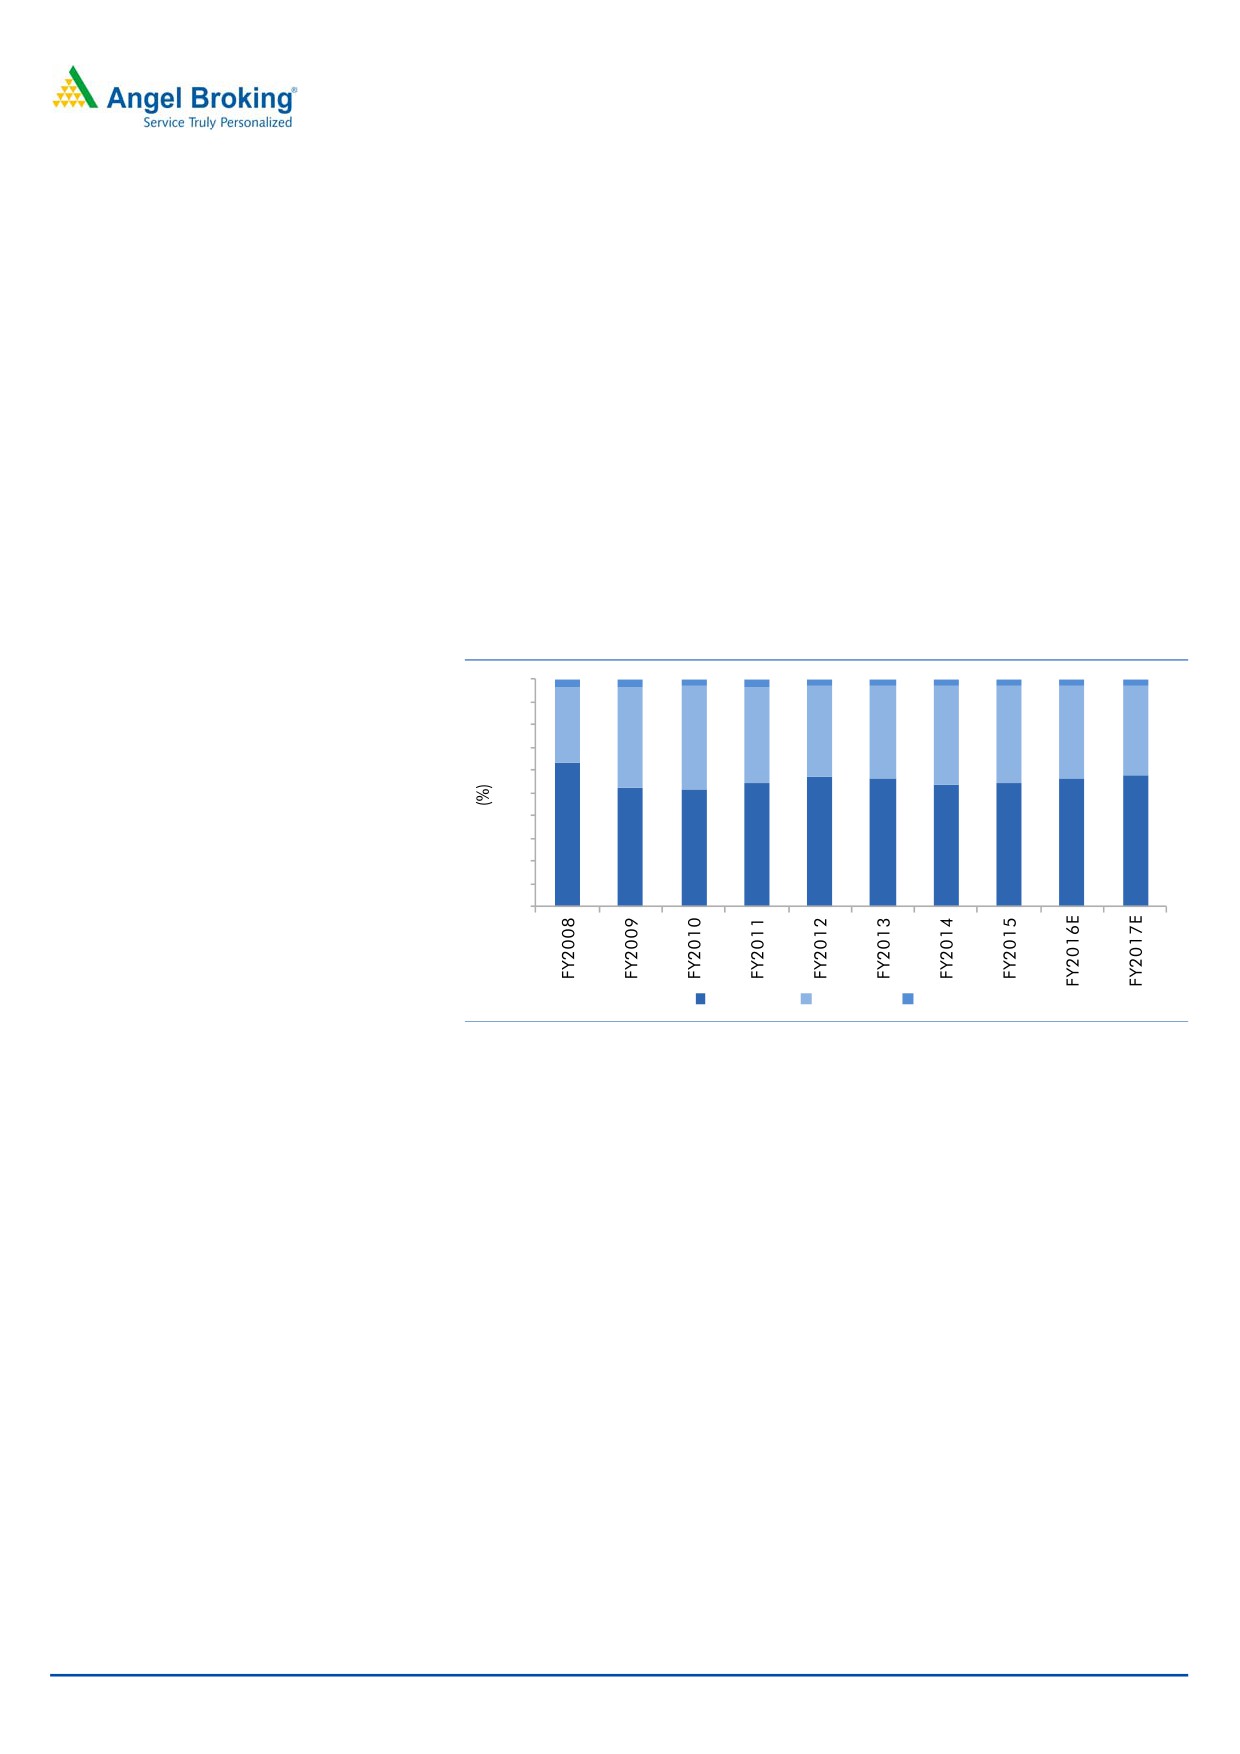
Exhibit 10: Segment wise revenue break-up of NEL
100
3
3
3
3
3
3
3
3
3
3
90
80
33
40
40
41
40
44
45
42
43
43
70
60
50
40
30
64
55
57
57
54
57
58
52
52
54
20
10
0
Publishing Stationery
Others
Source: Company, Angel Research
November 18, 2015
7
Navneet Education | Education
Consolidated Profit & Loss Statement
Y/E March (` cr)
FY2013
FY2014
FY2015
FY2016E
FY2017E
Total operating income
806
882
979
998
1,062
% chg
30.2
9.5
11.0
1.9
6.4
Total Expenditure
616
674
742
758
807
Raw Materials
387
434
464
474
505
Personnel Expenses
69
74
87
92
100
Others Expenses
160
167
191
192
202
EBITDA
190
208
237
241
255
% chg
44.7
9.5
14.0
1.4
5.9
(% of Net Sales)
23.6
23.6
24.2
24.1
24.0
Depreciation& Amortisation
23
26
31
35
36
EBIT
167
182
206
206
218
% chg
45.8
9.4
13.3
(0.2)
6.0
(% of Net Sales)
20.7
20.7
21.1
20.6
20.6
Interest & other Charges
8
10
9
7
7
Other Income
4
4
2
12
12
(% of PBT)
2.2
2.0
1.1
5.7
5.4
Share in profit of Associates
-
-
-
-
-
Recurring PBT
162
176
200
211
223
% chg
35.6
8.2
13.6
5.6
5.9
Prior Period & Extraord. Exp./(Inc.)
-
-
-
-
-
PBT (reported)
162
176
200
211
223
Tax
55
60
69
74
78
(% of PBT)
33.9
34.4
34.7
35.0
35.0
PAT (reported)
107
115
130
137
145
Less: Minority interest (MI)
1
(0)
0
0
0
PAT after MI (reported)
107
115
130
137
145
ADJ. PAT
107
115
130
137
145
% chg
36.8
8.0
13.1
5.1
5.9
(% of Net Sales)
13.2
13.1
13.3
13.7
13.7
Basic EPS (`)
4.5
4.8
5.5
5.8
6.1
Fully Diluted EPS (`)
4.5
4.8
5.5
5.8
6.1
% chg
36.8
7.9
13.2
5.1
5.9
November 18, 2015
8
Navneet Education | Education
Balance Sheet
Y/E March (` cr)
FY2013
FY2014
FY2015
FY2016E FY2017E
SOURCES OF FUNDS
Equity Share Capital
48
48
48
48
48
Reserves& Surplus
370
430
495
574
658
Shareholders Funds
418
478
542
622
706
Minority Interest
0
0
0
0
0
Total Loans
169
234
144
144
145
Deferred Tax Liability
6
7
5
5
5
Total Liabilities
594
719
691
771
856
APPLICATION OF FUNDS
Gross Block
332
365
374
394
414
Less: Acc. Depreciation
157
178
204
239
275
Net Block
174
187
170
155
139
Capital Work-in-Progress
6
5
4
4
4
Investments
31
47
49
49
49
Current Assets
498
604
599
681
779
Inventories
275
334
348
383
413
Sundry Debtors
166
196
189
205
233
Cash
4
7
6
13
17
Loans & Advances
35
47
38
50
69
Other Assets
19
20
19
30
48
Current liabilities
117
126
132
120
116
Net Current Assets
381
478
467
561
663
Deferred Tax Asset
2
1
1
1
1
Mis. Exp. not written off
-
-
-
-
-
Total Assets
594
719
691
771
856
November 18, 2015
9
Navneet Education | Education
Cashflow Statement
Y/E March (` cr)
FY2013
FY2014
FY2015
FY2016E
FY2017E
Profit before tax
164
176
200
211
223
Depreciation
23
26
31
35
36
Change in Working Capital
(118)
(89)
(10)
(87)
(98)
Interest / Dividend (Net)
5
8
7
7
7
Direct taxes paid
-
(61)
(65)
(74)
(78)
Others
(0)
(0)
(0)
-
-
Cash Flow from Operations
74
59
162
92
91
(Inc.)/ Dec. in Fixed Assets
(39)
(45)
(6)
(20)
(20)
(Inc.)/ Dec. in Investments
(30)
(16)
(2)
-
-
Cash Flow from Investing
(70)
(62)
(8)
(20)
(20)
Issue of Equity
-
-
-
-
-
Inc./(Dec.) in loans
(22)
(50)
(56)
0
1
Dividend Paid (Incl. Tax)
(43)
(48)
(53)
(58)
(61)
Interest / Dividend (Net)
59
104
(46)
(7)
(7)
Cash Flow from Financing
(6)
6
(156)
(64)
(67)
Inc./(Dec.) in Cash
(2)
3
(1)
8
3
Opening Cash balances
5
4
7
6
13
Closing Cash balances
4
7
6
13
17
November 18, 2015
10
Navneet Education | Education
Key Ratios
Y/E March
FY2013
FY2014
FY2015
FY2016E FY2017E
Valuation Ratio (x)
P/E (on FDEPS)
19.6
18.2
16.1
15.3
14.4
P/CEPS
16.0
14.9
13.0
12.2
11.6
P/BV
5.0
4.4
3.9
3.4
3.0
Dividend yield (%)
2.0
2.3
2.5
2.7
2.9
EV/Sales
2.8
2.6
2.2
2.2
2.0
EV/EBITDA
11.7
10.9
9.2
9.1
8.5
EV / Total Assets
3.1
2.7
2.7
2.4
2.2
Per Share Data (`)
EPS (Basic)
4.5
4.8
5.5
5.8
6.1
EPS (fully diluted)
4.5
4.8
5.5
5.8
6.1
Cash EPS
5.5
5.9
6.8
7.2
7.6
DPS
1.8
2.0
2.2
2.4
2.6
Book Value
17.6
20.1
22.8
26.1
29.6
Returns (%)
ROCE
28.4
25.6
30.1
26.9
25.7
Angel ROIC (Pre-tax)
30.1
27.7
32.7
29.3
27.8
ROE
25.5
24.1
24.0
22.0
20.5
Turnover ratios (x)
Asset Turnover (Gross Block)
2.4
2.4
2.6
2.5
2.6
Inventory / Sales (days)
125
138
130
140
142
Receivables (days)
75
81
70
75
80
Payables (days)
13
9
7
5
4
WC cycle (ex-cash) (days)
187
210
193
210
218
November 18, 2015
11
Navneet Education | Education
Research Team Tel: 022 - 39357800
DISCLAIMER
Angel Broking Private Limited (hereinafter referred to as “Angel”) is a registered Member of National Stock Exchange of India Limited,
Bombay Stock Exchange Limited and Metropolitan Stock Exchange of India Limited. It is also registered as a Depository Participant with
CDSL and Portfolio Manager with SEBI. It also has registration with AMFI as a Mutual Fund Distributor. Angel Broking Private Limited is
a registered entity with SEBI for Research Analyst in terms of SEBI (Research Analyst) Regulations, 2014 vide registration number
INH000000164. Angel or its associates has not been debarred/ suspended by SEBI or any other regulatory authority for accessing
/dealing in securities Market. Angel or its associates including its relatives/analyst do not hold any financial interest/beneficial
ownership of more than 1% in the company covered by Analyst. Angel or its associates/analyst has not received any compensation /
managed or co-managed public offering of securities of the company covered by Analyst during the past twelve months. Angel/analyst
has not served as an officer, director or employee of company covered by Analyst and has not been engaged in market making activity
of the company covered by Analyst.
This document is solely for the personal information of the recipient, and must not be singularly used as the basis of any investment
decision. Nothing in this document should be construed as investment or financial advice. Each recipient of this document should
make such investigations as they deem necessary to arrive at an independent evaluation of an investment in the securities of the
companies referred to in this document (including the merits and risks involved), and should consult their own advisors to determine
the merits and risks of such an investment.
Reports based on technical and derivative analysis center on studying charts of a stock's price movement, outstanding positions and
trading volume, as opposed to focusing on a company's fundamentals and, as such, may not match with a report on a company's
fundamentals.
The information in this document has been printed on the basis of publicly available information, internal data and other reliable
sources believed to be true, but we do not represent that it is accurate or complete and it should not be relied on as such, as this
document is for general guidance only. Angel Broking Pvt. Limited or any of its affiliates/ group companies shall not be in any way
responsible for any loss or damage that may arise to any person from any inadvertent error in the information contained in this report.
Angel Broking Pvt. Limited has not independently verified all the information contained within this document. Accordingly, we cannot
testify, nor make any representation or warranty, express or implied, to the accuracy, contents or data contained within this document.
While Angel Broking Pvt. Limited endeavors to update on a reasonable basis the information discussed in this material, there may be
regulatory, compliance, or other reasons that prevent us from doing so.
This document is being supplied to you solely for your information, and its contents, information or data may not be reproduced,
redistributed or passed on, directly or indirectly.
Neither Angel Broking Pvt. Limited, nor its directors, employees or affiliates shall be liable for any loss or damage that may arise from
or in connection with the use of this information.
Note: Please refer to the important ‘Stock Holding Disclosure' report on the Angel website (Research Section). Also, please refer to the
latest update on respective stocks for the disclosure status in respect of those stocks. Angel Broking Pvt. Limited and its affiliates may
have investment positions in the stocks recommended in this report.
Disclosure of Interest Statement
Navneet Education
1. Analyst ownership of the stock
No
2. Angel and its Group companies ownership of the stock
No
3. Angel and its Group companies' Directors ownership of the stock
No
4. Broking relationship with company covered
No
Note: We have not considered any Exposure below ` 1 lakh for Angel, its Group companies and Directors
Ratings (Based on expected returns
Buy (> 15%)
Accumulate (5% to 15%)
Neutral (-5 to 5%)
over 12 months investment period):
Reduce (-5% to -15%)
Sell (< -15)
November 18, 2015
12