Initiating coverage | Chemical
March 27, 2017
Navin Fluorine International
BUY
CMP
`2,957
The unique chemistry of growth
Target Price
`3,650
Navin Fluorine (NFIL), part of the Arvind Mafatlal group, is a leader in fluorine
Investment Period
12 Months
based chemicals in India. It operates mainly in four segments i.e. Refrigerant,
Organic Fluoride, Specialty Chemicals and CRAMs. While Refrigerant segment
Stock Info
will continue to generate strong cash flows, the incremental focus of the company
is the high margin and scalable specialty chemicals and CRAMs business. While
Sector
Commodity Chemicals
the contribution from the JV with Piramal group is expected to commence from
Market Cap (` cr)
2,900
FY2018 onwards, NFIL has also entered into supply and technology licenses
Beta
0.9
agreement with Honeywell to produce next generation automobile refrigerant.
52 Week High / Low
3012/1592
Judicious capital allocation has been a key differentiator of NFIL: NFIL received
Avg. Daily Volume
5,475
~`400cr from sales of carbon credit over FY2011-13, while part of that was used
Face Value (`)
10
to repay debt & one-time dividend, the management chose to diversify the
BSE Sensex
29,421
remaining funds in valued added business like CRAMs. This gave an entry to NFIL to
Nifty
9,108
global Pharma and Agro chemical companies. With gradual phase out of Refrigerant,
the move was in right direction which is paying off now in the form of high growth.
Reuters Code
NAFL.BO
Increasing share of high valued added business like Speciality Chemicals &
Bloomberg Code
NFIL@IN
CRAMS should be margin accretive: NFIL’s business mix has changed favorably
over the last few years and share of value added products, specialty chemicals
and CRAMs has gone up from 41% in FY2013 to 51% in FY2016, we expect this
Shareholding Pattern (%)
to further go up to 60% by FY2019, which we believe will be margin accretive for
Promoters
38.7
the company. Its EBITDA margin has increased from 13% in FY2013 to 18.5% in
MF / Banks / Indian Fls
21.9
FY2016 and we believe this has further scope to improve to 22% by FY2019.
FII / NRIs / OCBs
11.8
JV with Piramal Enterprises a win-win situation for both: NFIL (49%) & Piramal
Indian Public / Others
27.7
Enterprises
(51%) entered into a JV in 2014 to manufacture Specialty Fluorine
Chemicals targeted at healthcare segment. The JV with an investment of `140cr is
likely to start contributing from FY2018 onwards. The JV with Piramal is a
Abs.(%)
3m 1yr 3yr
testimony to NFIL’s capability of handling the complex fluorine molecules, while
Sensex
12.6
15.8
34.8
being strategically fit it is a win-win situation for both the players.
NFIL
15.9
68.0
910.0
Improvement in RoCE a result of low debt and strong cash flows: NFIL has been
generating strong cash flows, as a result, which it is able to fund its capex via
internal accruals (negligible debt equity) leading to strong return ratios. The RoCE
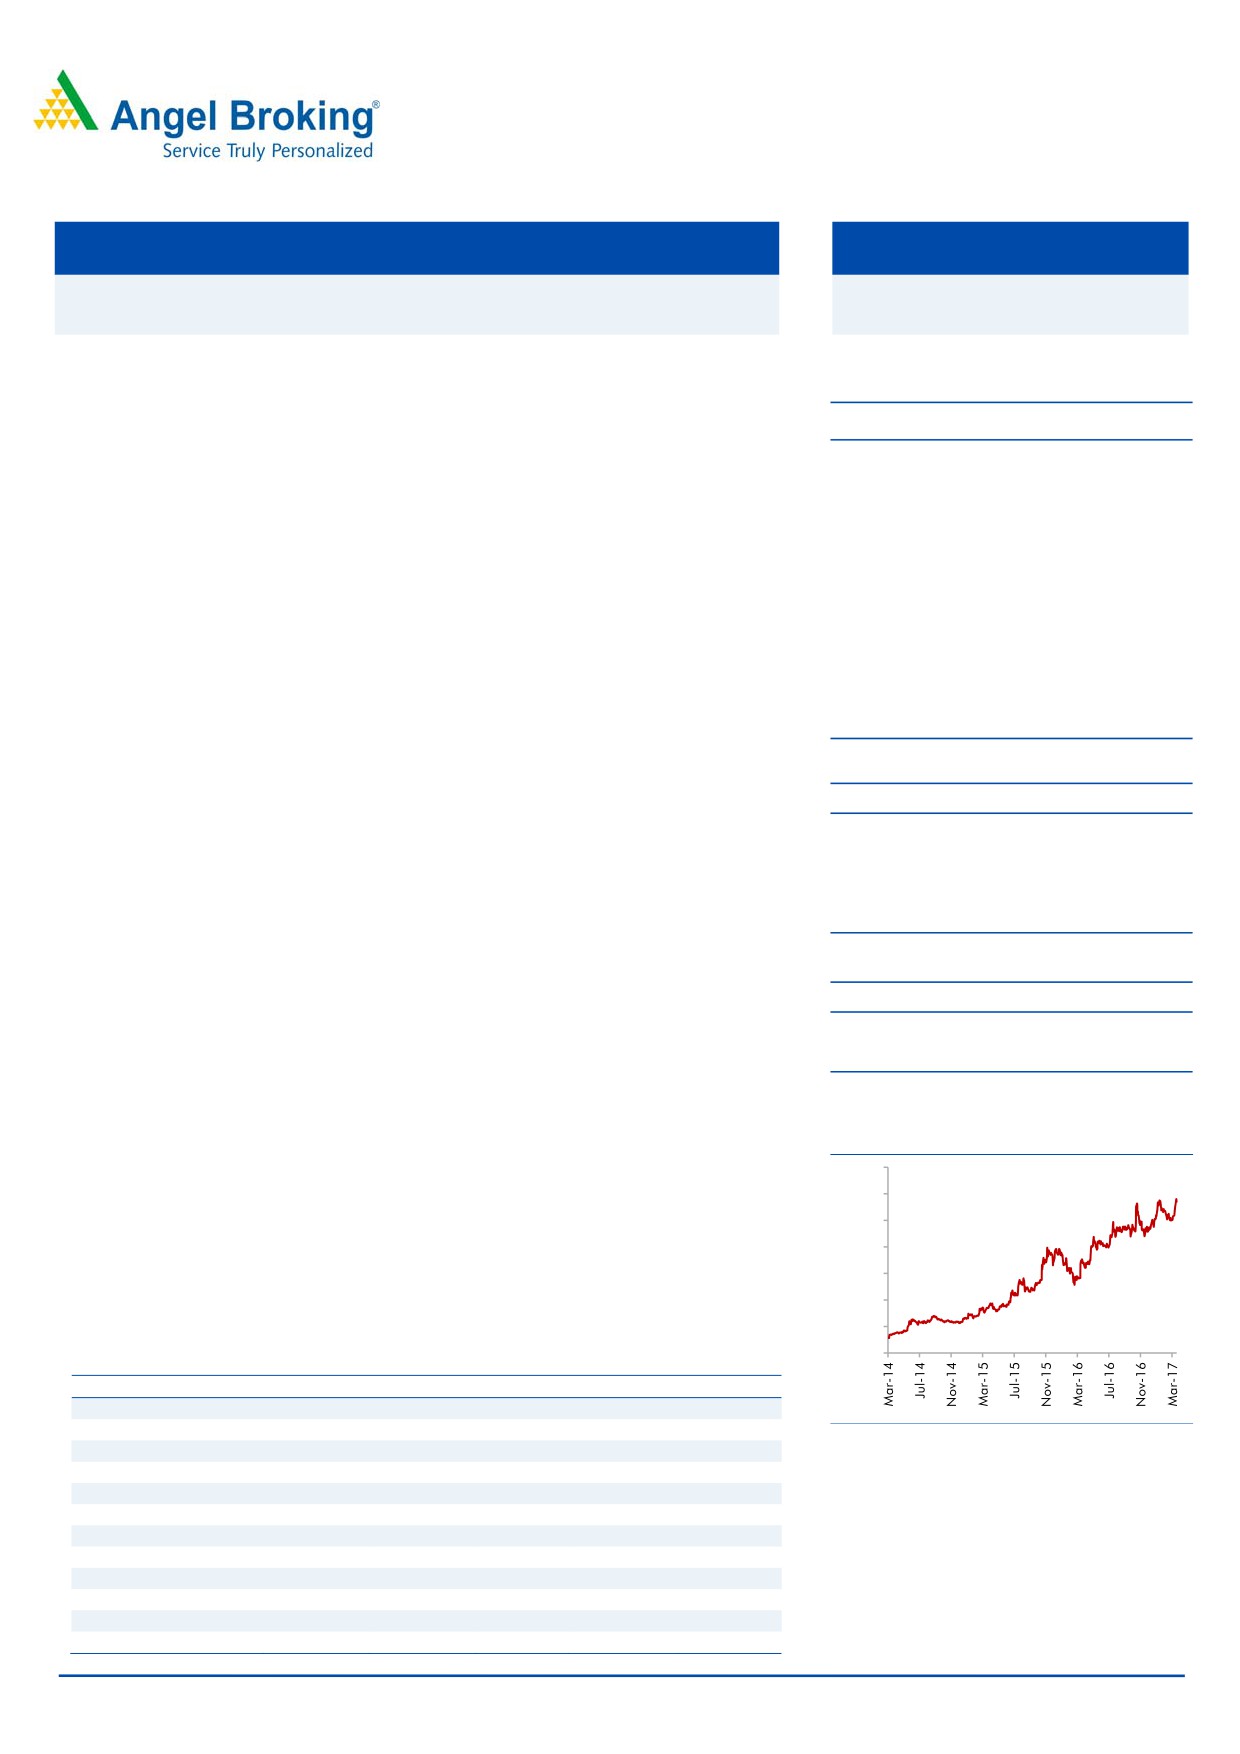
3-year price chart
has improved from 9.9% in FY2013 to 14.1% by FY2016 and with increasing
3,500
share of value added products we expect this to touch 22.7% by FY2019.
3,000
Outlook and Valuation: NFIL’s presence in the high margin, scalable business
2,500
with strong entry barriers makes it a unique player in the Indian specialty
2,000
chemical industry. At the CMP, the stock is trading at 17x its FY2019E EPS and
1,500
10.1x EV/EBITDA. We believe NFIL would continue to attract premium valuations
1,000
due to the long term growth visibility. We have valued the stock at 21x its FY2019E
500
EPS and recommend BUY on the stock with 12 months target price of `3,650.
0
Key Financials (Consolidated)
Y/E March (` cr)
FY15
FY16
FY17E
FY18E
FY19E
Net Sales
546
636
789
945
1,154
% chg
21.6
16.5
24.0
19.8
22.1
Source: Company, Angel Research
Net Profit
49
86
118
140
170
% chg
(2.5)
75.1
35.9
19.4
21.2
OPM (%)
11.0
17.8
21.1
22.4
22.6
EPS (`)
50.6
88.4
120.1
143.4
173.8
P/E (x)
58.4
33.5
24.6
20.6
17.0
P/BV (x)
5.1
4.6
4.0
3.4
2.9
RoE (%)
8.9
14.4
17.2
17.8
18.5
RoCE (%)
7.0
14.1
19.3
21.3
22.7
Siddharth Purohit
EV/Sales (x)
5.3
4.6
3.6
2.9
2.3
022 - 3935 7800 Ext: 6872
EV/EBITDA (x)
46.1
25.0
16.7
12.9
10.1
Source: Company, Angel Research; Note: CMP as of March 24, 2017
Please refer to important disclosures at the end of this report
1
Initiating coverage | Navin Fluroine
Company background
Navin Fluorine International Ltd (NFIL), part of the Arvind Mafatlal Group is one of
the largest manufacturers of Specialty Fluorochemicals in India. With nearly
5 decades of expertise NFIL has evolved over the years and has now got into high
margin and scalable business like specialty chemicals and CRAMs. The company’s
manufacturing facilities are located at Surat in Gujarat and Dewas in Madhya
Pradesh. The primary business of the company can be dividend into the following
four segments - Refrigerant, Specialty Chemicals, Inorganic Fluoride, and CRAMs.
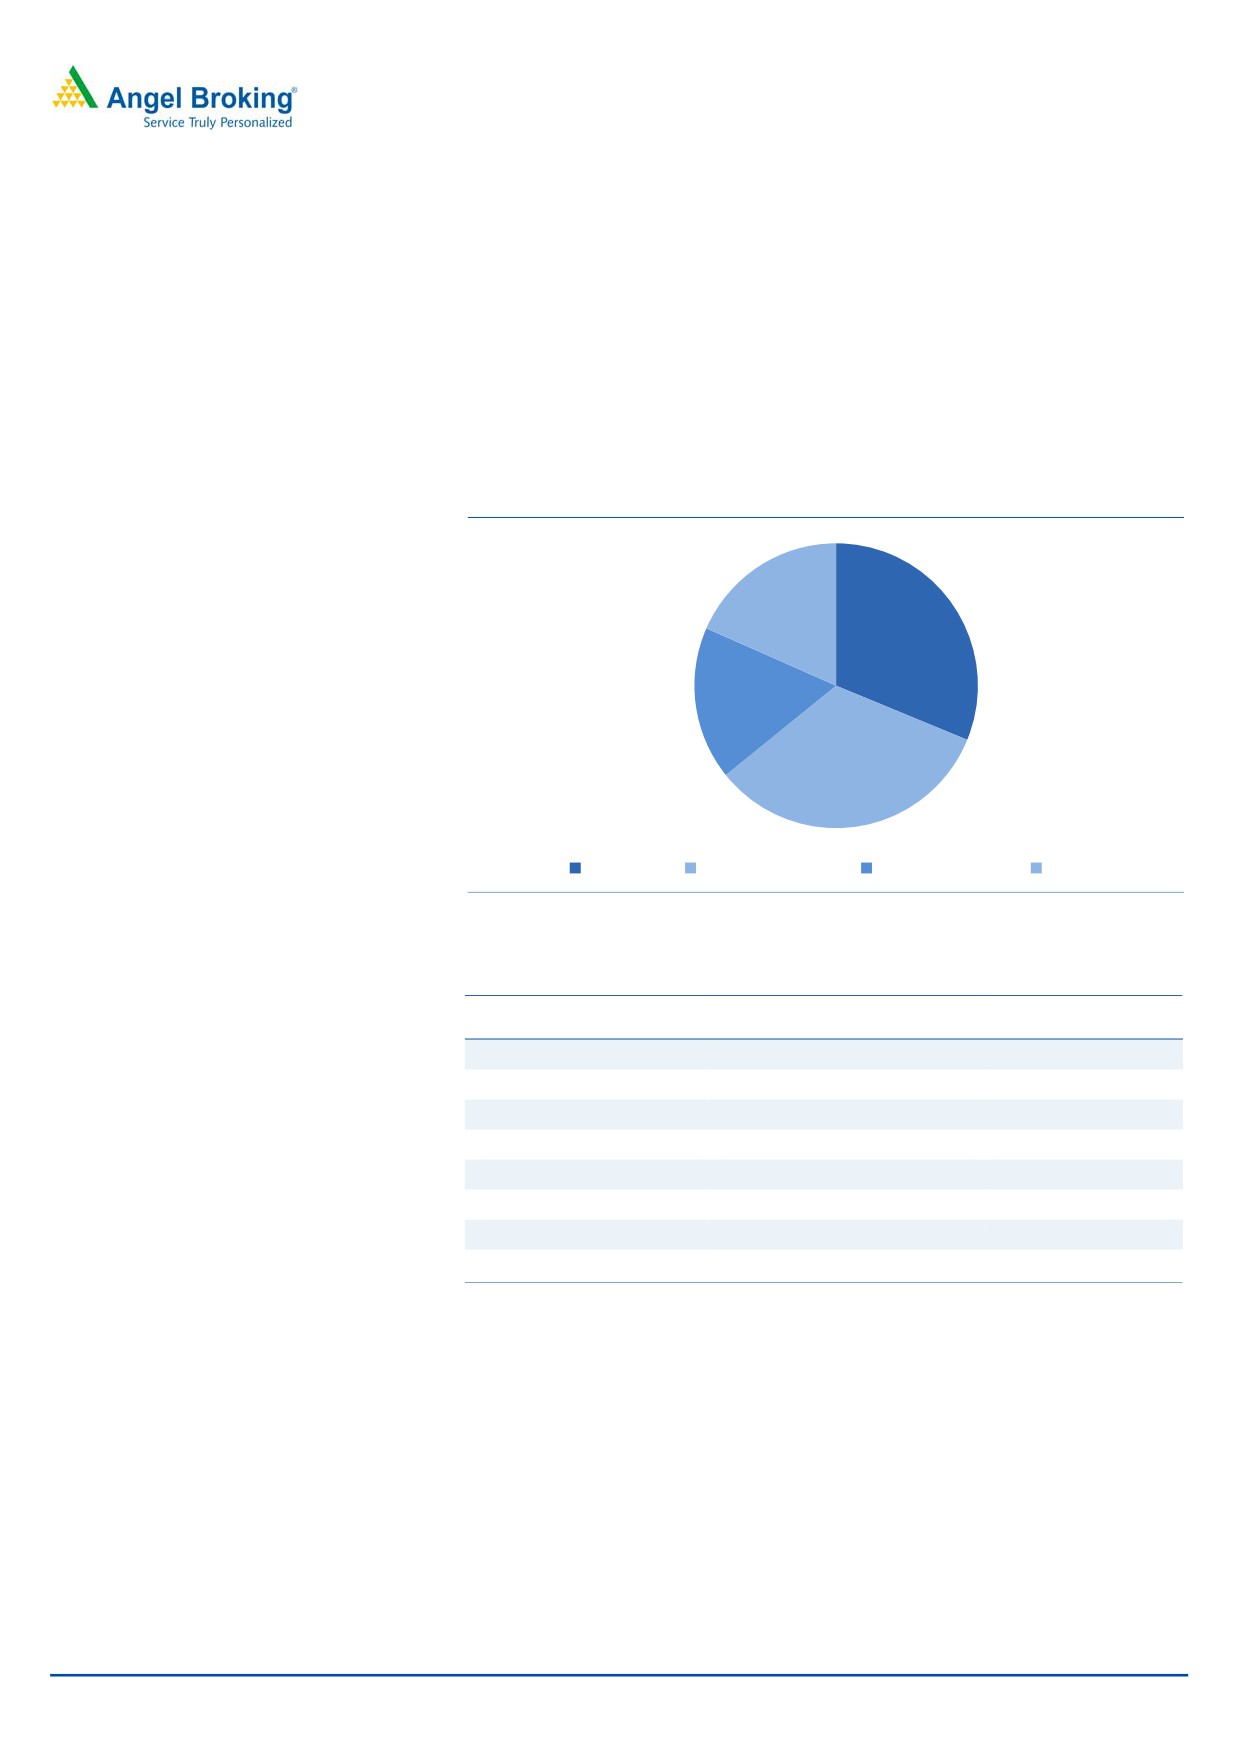
Exhibit 1: Segmental Revenue Contribution (%)
18
31
17
33
Refrigerent
Speacity Chemicals
Inorganic Flouride
CRAMs
Source: Company, Angel Research
Exhibit 2: Marquee Client Base
Specialty Chemicals &
Pharma Segment
Refrigerant Segment
Agro Chemicals
SUN Pharmaceuticals
CLRIANT
SAMSUNG
LUPIN
BAYER
VOLTAS
Orchid Pharma
SYNGENTA
BLUE STAR
HETERO
BAYER Crop Science
CARRIER
NOVARTIS
DUPONT
LG
Dr Reddy's
BASF
ROCHE
Aurobindo
Source: Company, Angel Research
Key management Personnel:
Mr Shekhar S Khanolkar - Managing Director -Mr Khanolkar has been the MD of
NFIL, since Jan,2011. He served as President of Fluorochemicals segment at NFIL
from Nov-2008 to Jan-2011. Backed by strong qualifications, BE -Chemical and
Masters from Harvard Business School, he has been instrumental behind the
growth of the company.
March 27, 2017
2
Initiating coverage | Navin Fluroine
Exhibit 3: Business Segment
Refrigerant
Specialty Chemicals
Inorganic Fluorides
CRAMs
Fluorine based
Key Products Refrigerant Gas- Viz
Aluminum Fluoride
Contract Research &
Intermediates
Manufacturing of
R-22,R-22 (PTFE Grade),
Ammonium Bi-Fluoride
fluorine based compounds
HFC-134a
Anhydrous Hydrofluoric
Air Conditioning and
Pharmaceutical &
User Industry
Pharma & Agrochemicals
Steel, Aluminum, Glass
Refrigeration
Agro Chem companies
Entry Barriers High
Very High
Low
Very High
Profitability
High
High
Low
Very High
Lowering of Quota and
Longer than expected slowdown
Prolonged slowdown in
Delayed off take
Risk
Early Phase out R-22 gas
in global agrochem business
user industry
from clients
Source: Company, Angel Research
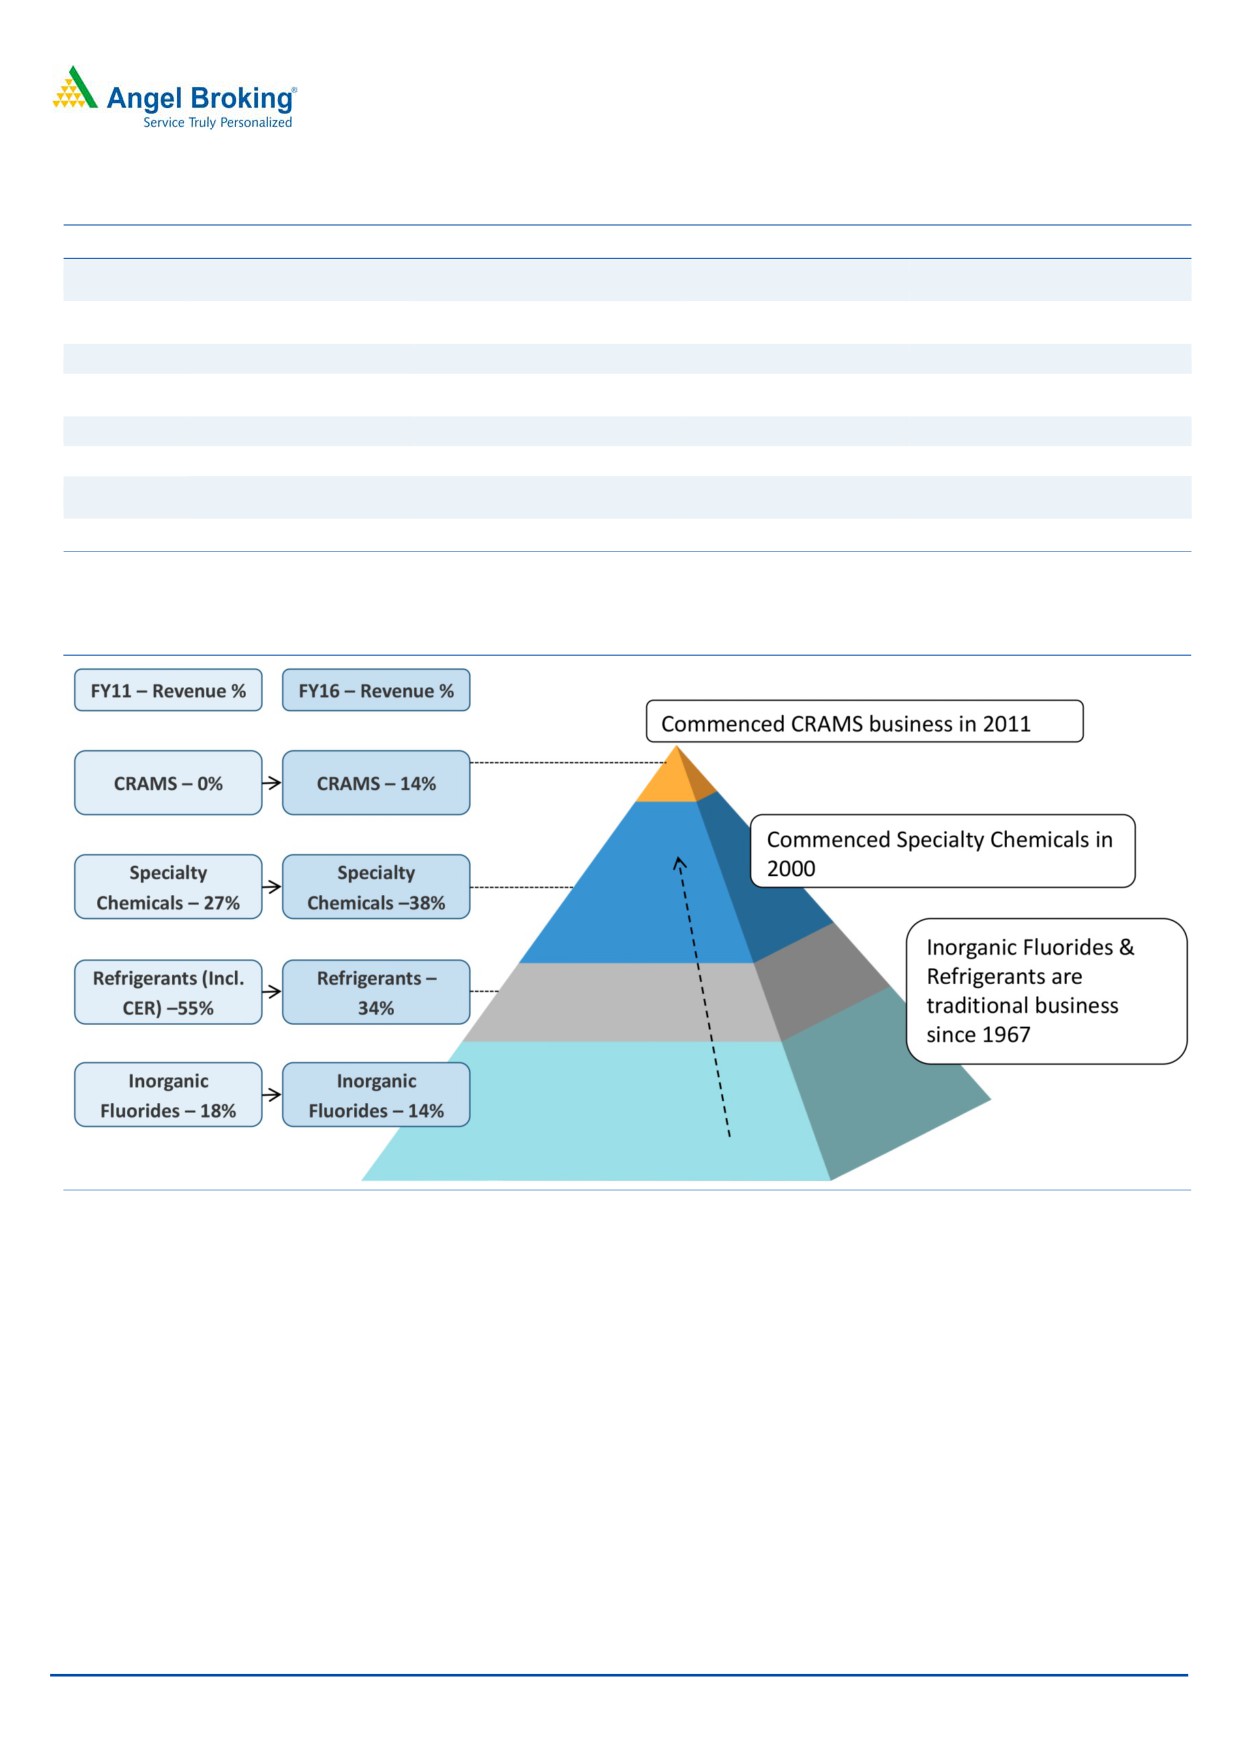
Exhibit 4: Higher Incremental business from valued added segment
Source: Company, Angel Research
March 27, 2017
3
Initiating coverage | Navin Fluroine
Investment Rationale
Judicious capital allocation has been a key differentiator of NFIL: NFIL received
~`400cr from sales of carbon credit over FY2011-13, and taking a proactive
decision the management chose to diversify by deploying funds in in valued added
business like CRAMs. This gave an entry to NFIL to global Pharma and Agro
chemical companies. With gradual phase out of Refrigerant, the move was in right
direction which is paying off now in the form of high growth. While there are other
players also in the Fluorinated chemical business, they do also have sizeable
operations in segments which are not necessarily related to each other. While in
case of NFIL all the segments of business are related to fluorine based molecules
and it has not gone into unrelated diversification. Further the organizations
strategy is to focus and deploy more incremental capital towards the high value
added segment.
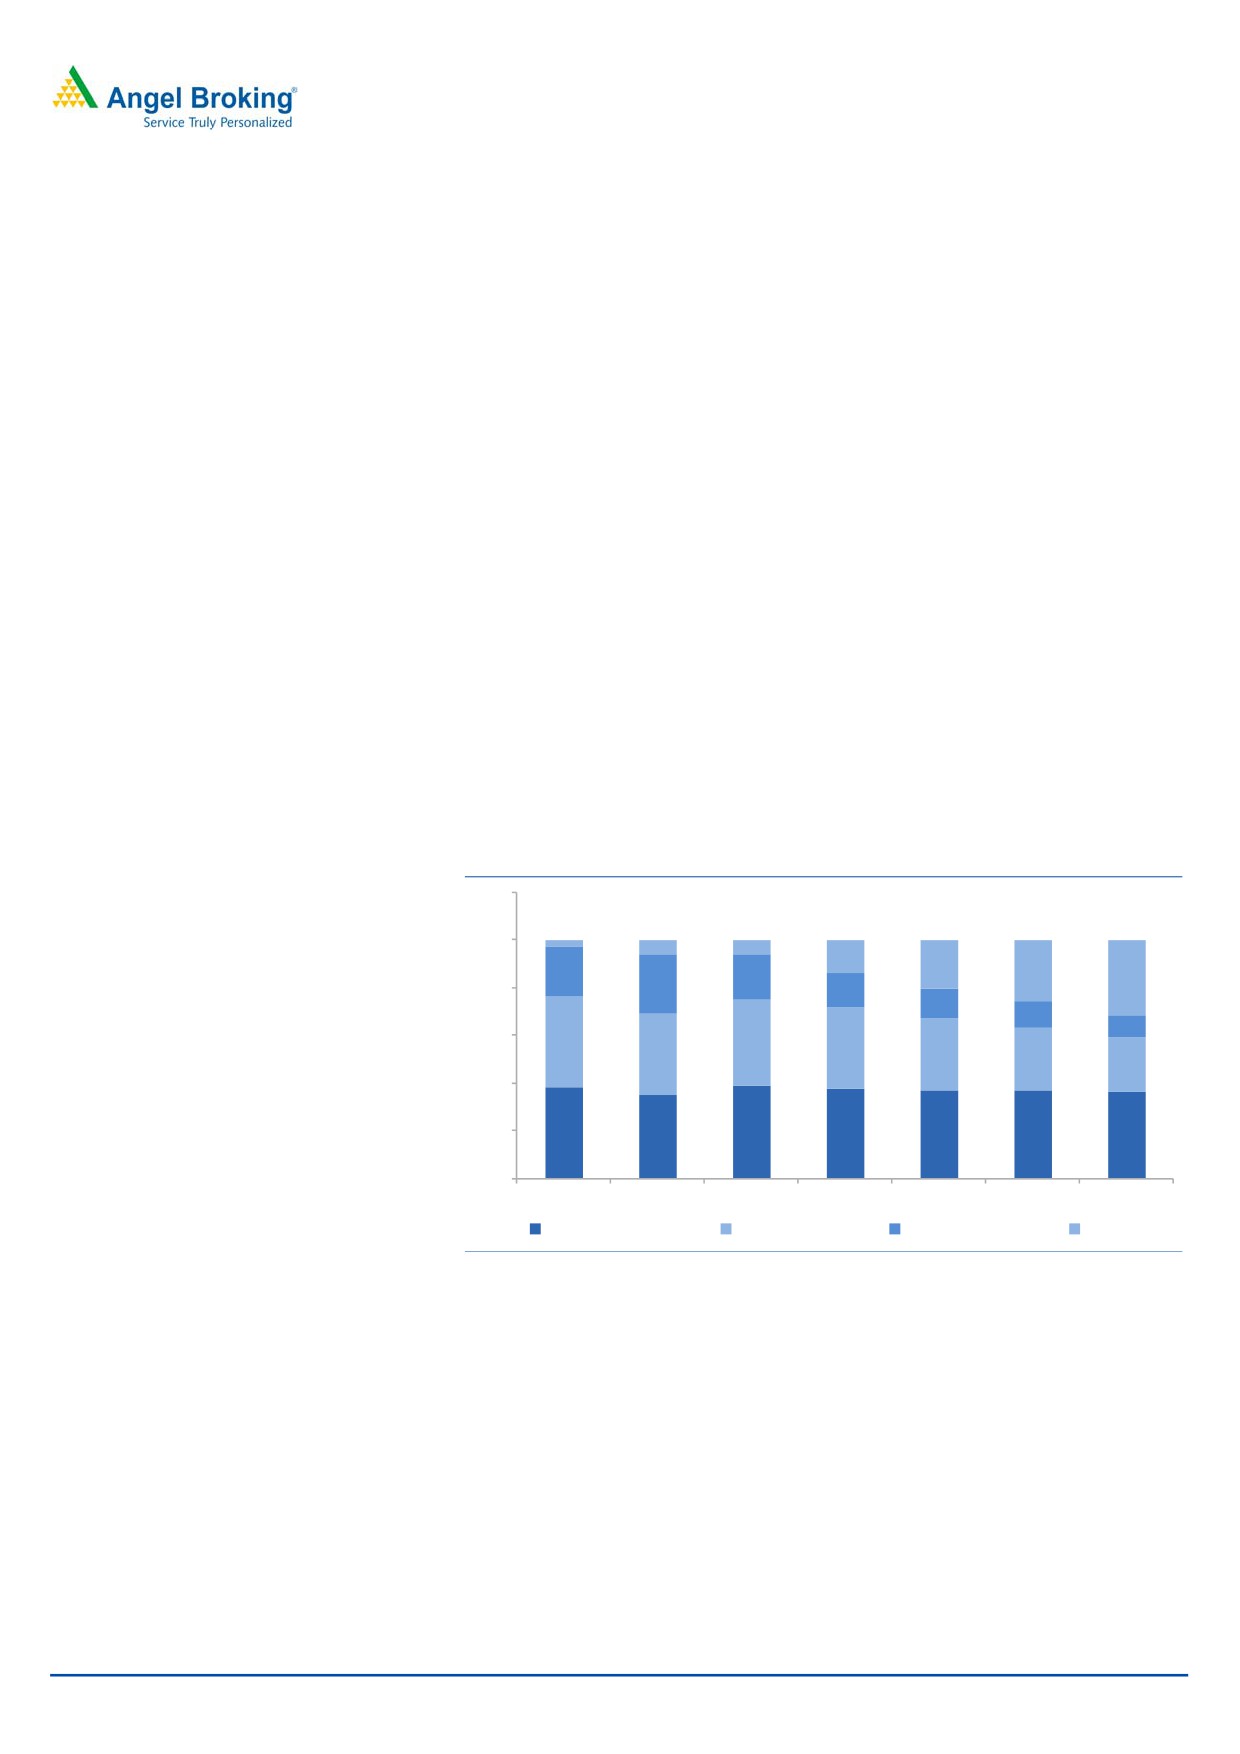
Increasing share of high valued added business should be margin accretive:
NFIL’s business mix has changed favorably over the last few years and share of
value added products, specialty chemicals and CRAMs has gone up from 41% in
FY2013 to 51% in FY2016, we expect this to further go up to 60% by FY2019,
which we believe will be margin accretive for the company. Its EBITDA margin has
increased from 13% in FY2013 to 18.5% in FY2016 and we believe this has
further scope to improve to 22% by FY2019.
Exhibit 5: Favourable change in business mix
120
100
3
6
6
14
21
21
26
19
32
80
25
15
13
11
9
60
38
36
34
34
30
26
23
40
20
38
35
39
38
37
37
36
0
FY13
FY14
FY15
FY16
FY17E
FY18E
FY19E
Speciality Chemicals
Refrigrant Gases
Inorganic Flouride
CRAMS
Source: Company, Angel Research
March 27, 2017
4
Initiating coverage | Navin Fluroine
Joint Venture with Piramal Enterprises a win-win situation for
both
NFIL and Piramal Group entered into a JV in 2014 in which NFIL holds 49% and
Piramal holds 51%. The JV will focus exclusively on Specialty Fluorine Chemicals
targeted at healthcare segment. The JV will invest `140cr and the project is on
schedule and is likely to start contributing from FY2018 onwards. The JV with
Piramal is a testimony to NFIL’s capability of handling the complex fluorine
molecules. We believe the JV is strategically fit and a win-win situation for both the
players, as NFIL will focus on the production and is assured of 100% product off
take by Piramal Enterprises. The Greenfield plant is being set up at NFIL’s land at
Dahej, which the company has leased out to the JV.
Exhibit 6: Key Highlights of the Joint Venture
Piramal Enterprises - 51% stake
Navin Fluorine -49% stake
JV Entered in 2014, to start commercial production by FY18
Investment of JV- `140 cr
Piramal’s pharma arm to buy out the entire output from the JV
NFIL to supply raw materials to the JV at arm lengths price
Source: Company, Angel Research
Recent partnership with Honeywell is another testimony of NFIL’s
ability to handle complex fluorine chemistry:
Recently, NFIL entered into a supply agreement and technology license with
Honeywell to produce Honeywell Solastice yf, an automobile refrigerant with a
lower global warming quality. Under the agreement, Honeywell will license its
proprietary process technologies to produce the refrigerant to Navin Flourine,
which will manufacture Solastice yf in India, exclusively for Honeywell.
Solastice yf, also known as HFO-1234yf is a next generation hydrofluro-olefin
(HFO) refrigerant that is a near drop in replacement for R-134a. R-134a is a HFC
with a global warming potential of 1300, which is used in vehicle air-condition
systems globally. Solastice yf is also being used in a growing number of stationary
air conditioning and commercial refrigeration applications.
March 27, 2017
5
Initiating coverage | Navin Fluroine
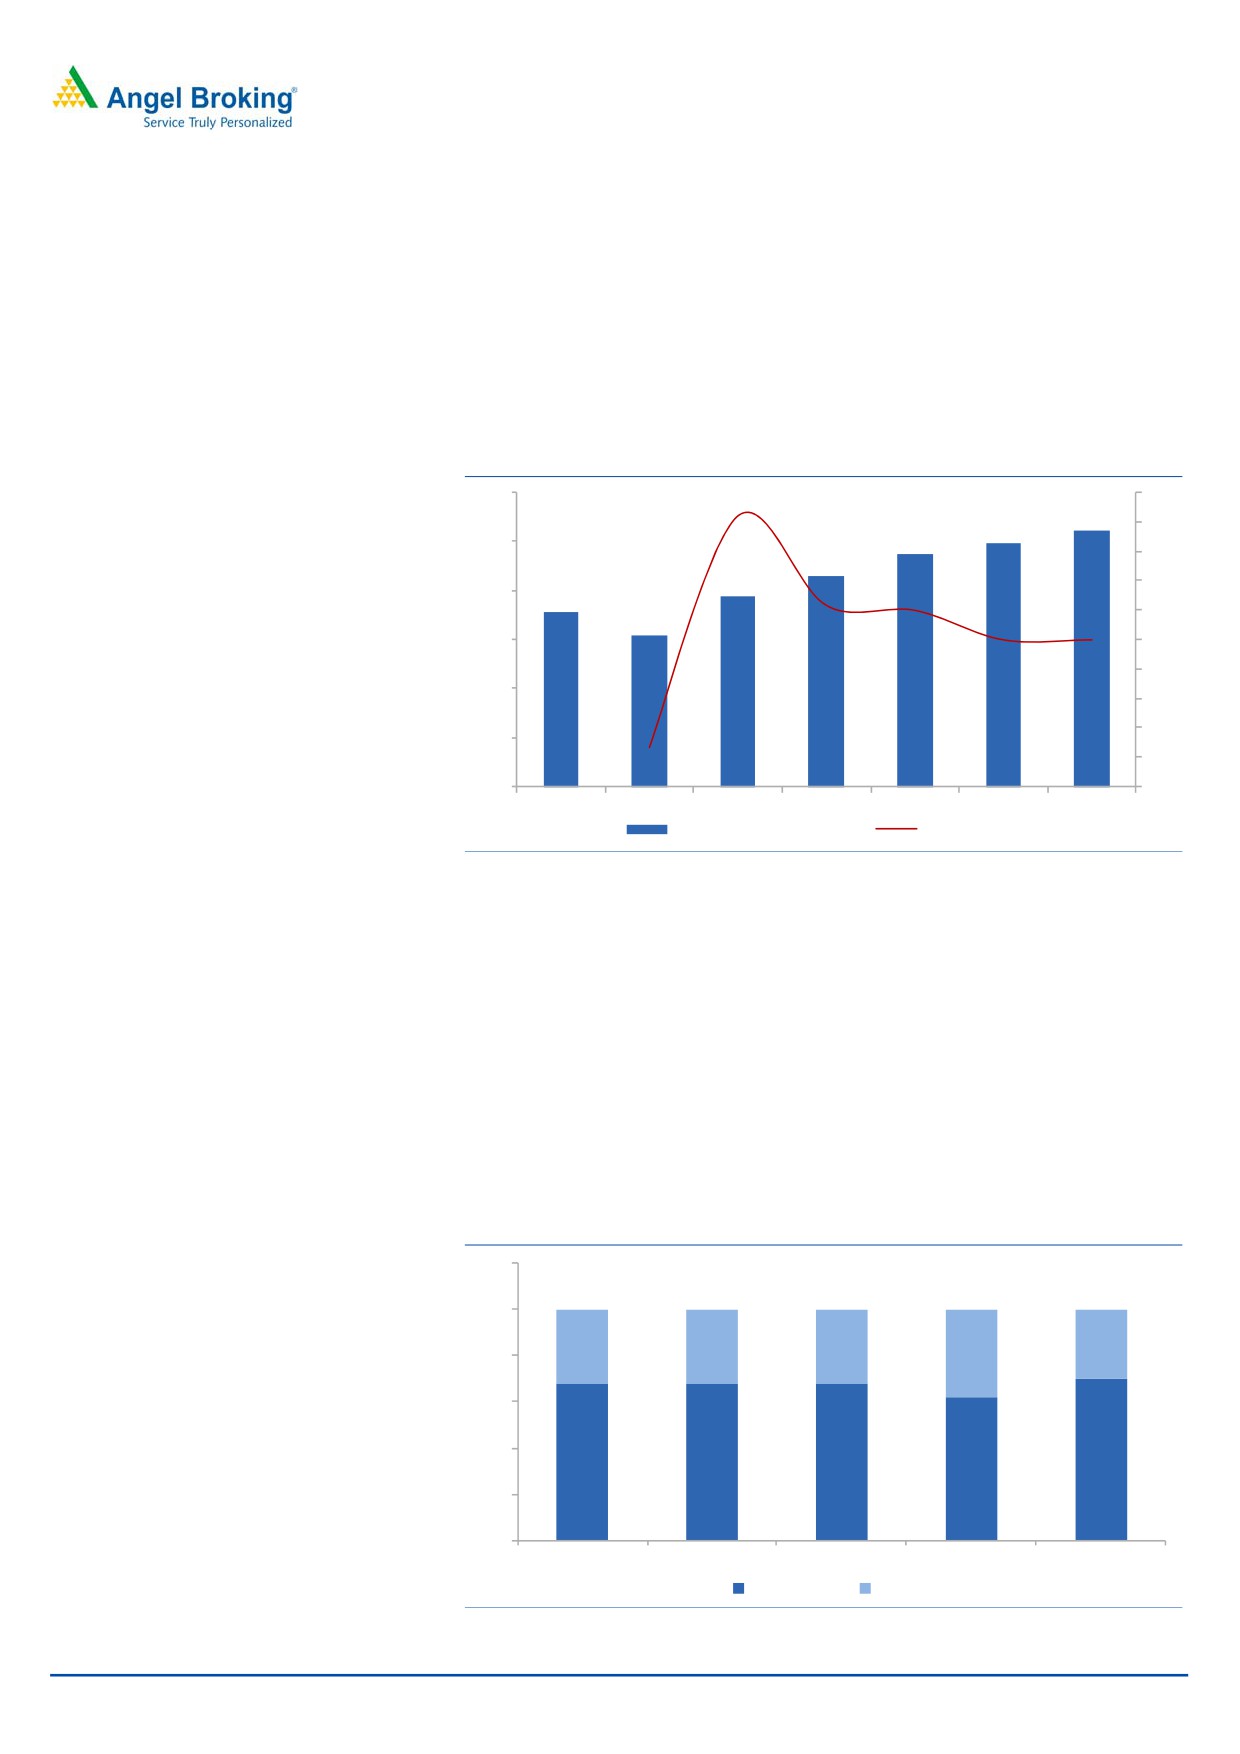
Refrigerant business unlikely to see de-growth in the near term
NFIL started the refrigerant business in
1967 and has a fully integrated
manufacturing facility for developing R22 gas. A backward integrated facility to
produce critical intermediaries like Sulphuric acid and Hydrofluoric acid has
ensured uninterrupted production of the refrigerant gas. NFIL sells its refrigerant
under the brand name of Mafron, which has become a generic name for
refrigerant in India over the years.
Exhibit 7: Steady revenue from refrigerant segment
300
30
26
25
250
20
15
200
11
10
10
150
5
5
5
0
100
(5)
(10)
50
(13)
(15)
177
154
194
215
237
248
261
0
(20)
FY13
FY14
FY15
FY16
FY17E
FY18E
FY19E
Refrigrant Gases (` cr)
% YoY Growth
Source: Company, Angel Research
As per the Montreal protocol, the phase out of HFC refrigerants of which R22 is the
most important has begun. In Europe, the phase out of R22 has already been
accomplished while the US will stop using R22 in 2020. In developing countries
the phase out had started in 2015 and will get over in 2030. With strict quota
restriction, we don’t expect any volume growth to come from the refrigerant
segment for NFIL. However, production cut down and effective demand supply
mismatch will ensure better price realization, and hence, the segment is likely to
remain steady cash flow for multiple years now. While R22 is being phased out for
refrigeration, there is no restriction on its use in Pharma sector as a feed stock and
this should compensate the decline in volume from other segments.
Exhibit 8: Geographical bifurcation of Refrigerant business
120
100
32
32
32
30
80
38
60
40
68
68
68
70
62
20
0
FY13
FY14
FY15
FY16
9mFY17
Domestic (%)
Exports (%)
Source: Company, Angel Research
March 27, 2017
6
Initiating coverage | Navin Fluroine
Specialty chemicals will continue to see increased traction: NFIL entered into
specialty chemicals business in 2000. This segment offers high scalability with
significant entry barriers. NFIL has dedicated multipurpose plants to process multi
step products and intermediates, which are high in the value chain. In this
segment, NFIL primarily supplies to the Pharmaceutical and Agrochemical
companies. In addition to the above industries, NFIL’s specialty chemicals also find
application in the Hydrocarbon and Fragrance segments to some extent.
Exhibit 9: Sustainable growth in Speciality Chemical segment
450
50
400
37.8
40
350
22.0
30
300
250
11.2
20
20.0
20.0
200
10
150
0
100
-12.09
(10)
50
177
156
215
239
292
350
420
0
(20)
FY13
FY14
FY15
FY16
FY17E
FY18E
FY19E
Speciality Chemicals (` cr)
% YoY Growth
Source: Company, Angel Research
The Specialty Chemicals supplied by NFIL are of low volume but high value in
nature. Although as a percentage of total input cost it might be low for the user,
but carries high importance, and that is the major reason for strong client
relationship of high repute for NFIL. The revenue from this segment has reported a
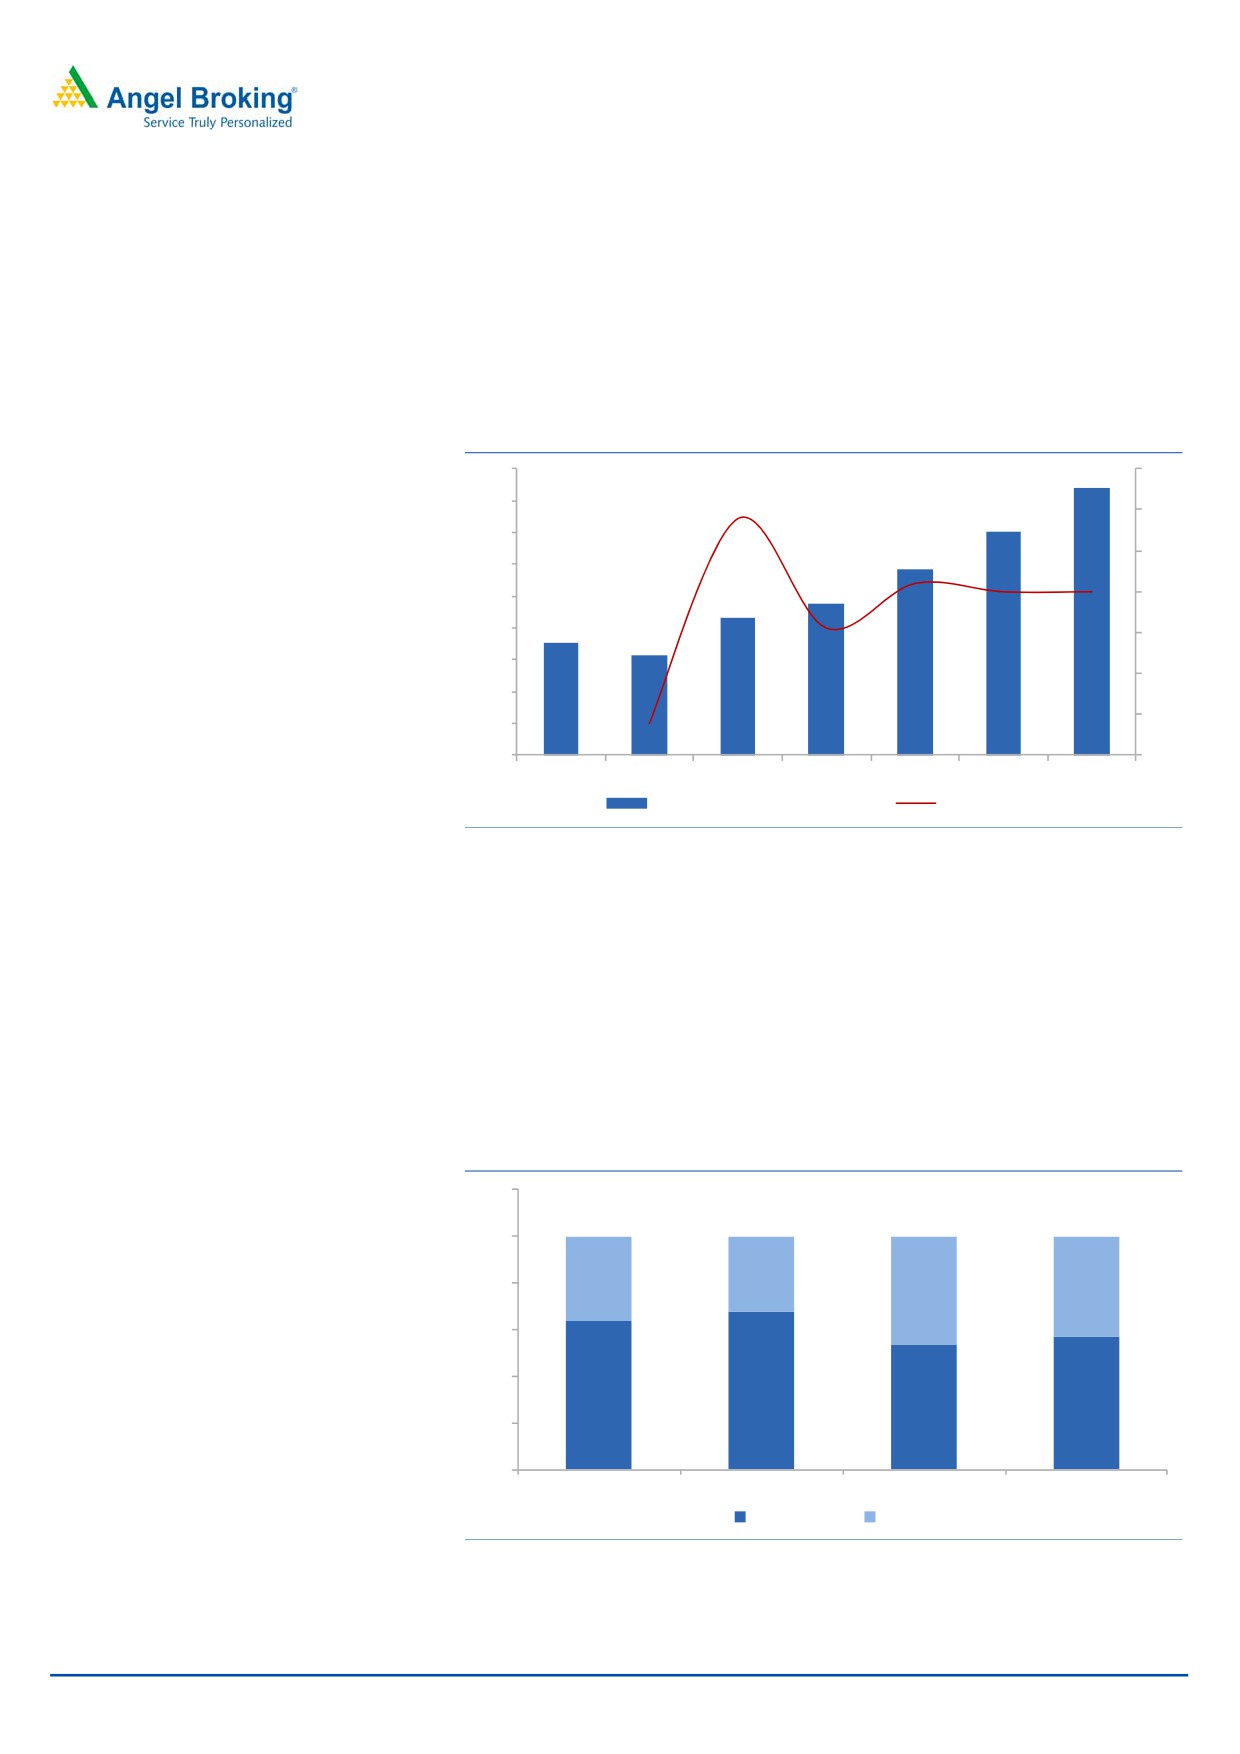
10.4% CAGR over FY2013-16. With global agrochemical industry going through a
phase of slow down the growth for NFIL has also been moderate. However, there
is trend of higher contribution from the exports business, which should be margin
accretive for the company.
Exhibit 10: Increasing share of exports in Speciality Chemicals
120
100
36
32
80
43
46
60
40
64
68
54
57
20
0
FY14
FY15
FY16
9mFY17
Domestic (%)
Exports (%)
Source: Company, Angel Research
March 27, 2017
7
Initiating coverage | Navin Fluroine
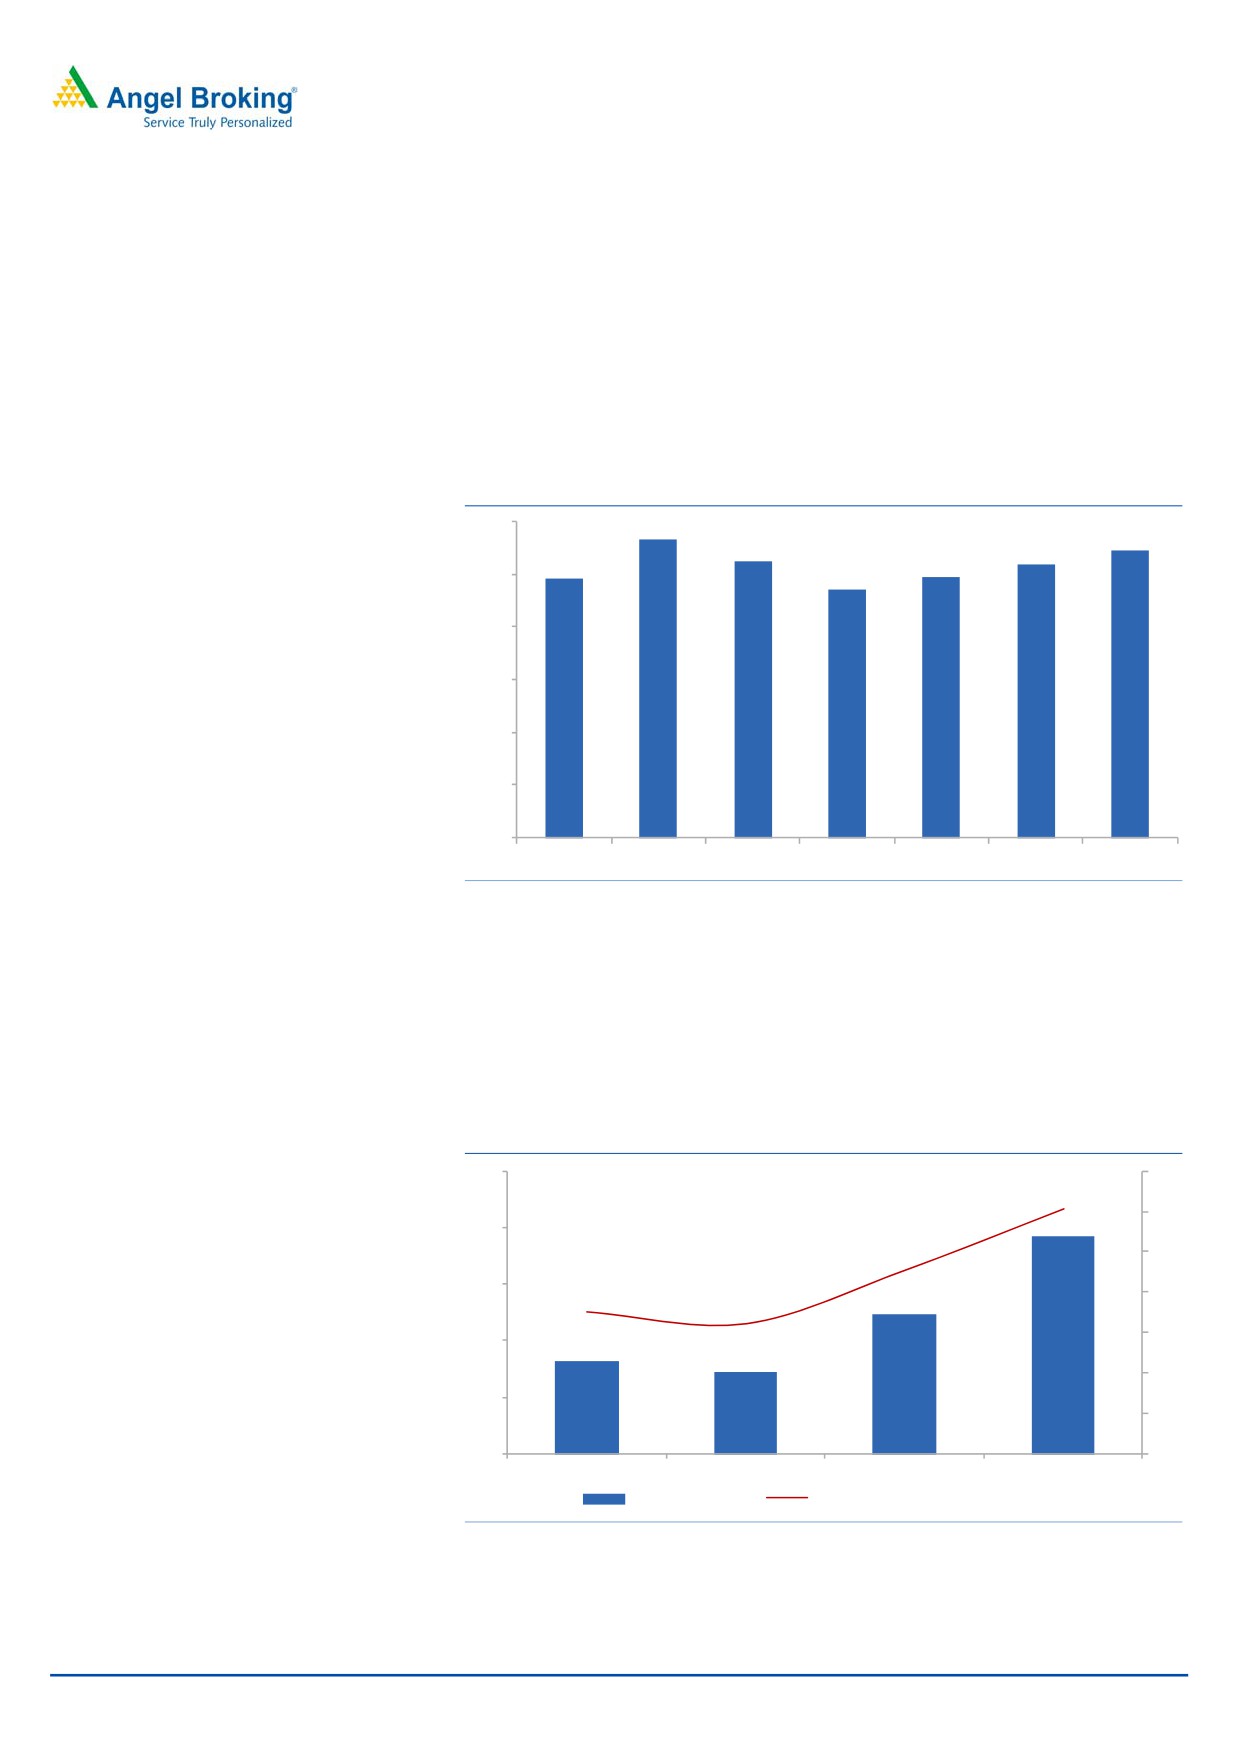
Inorganic fluoride segments growth will depend on the user
industries like Aluminum & Steel
The various inorganic fluorides like - Ammonium BiFluoride, Potassium Fluoride,
Sodium Fluoride supplied by NFIL find application in sectors like Aluminum Steel
and Glass production. Due to slow down in the user industry, the revenue from this
segment has remained muted over the years. These set of products being
commoditized in nature generally have relatively lower margins v/s. other products
of the company.
Exhibit 11: Subdued growth in Inorganic Fluoride ( Revenues ` cr)
120
113
109
105
104
98
99
100
94
80
60
40
20
0
FY13
FY14
FY15
FY16
FY17E
FY18E
FY19E
Source: Company, Angel Research
NFIL has been upgrading itself via continuous focus on R&D
While the traditional business of NFIL like Refrigerant and Inorganic Fluoride are
high volume business and doesn’t need major R&D. The new areas of business
which NFIL is actively pursuing are Specialty Chemicals and CRAMs, which need a
lot of R&D, hence NFIL has been spending higher amount on it every year.
Exhibit 12: Increasing share of R&D Expenses
25
4
3.0
3
20
2.3
3
15
1.8
2
1.6
2
10
1
5
1
8.2
7.2
12.4
19.2
0
0
FY13
FY14
FY15
FY16
R&D Expenses
R&D Expenses as % of Total Revenues
Source: Company, Angel Research
March 27, 2017
8
Initiating coverage | Navin Fluroine
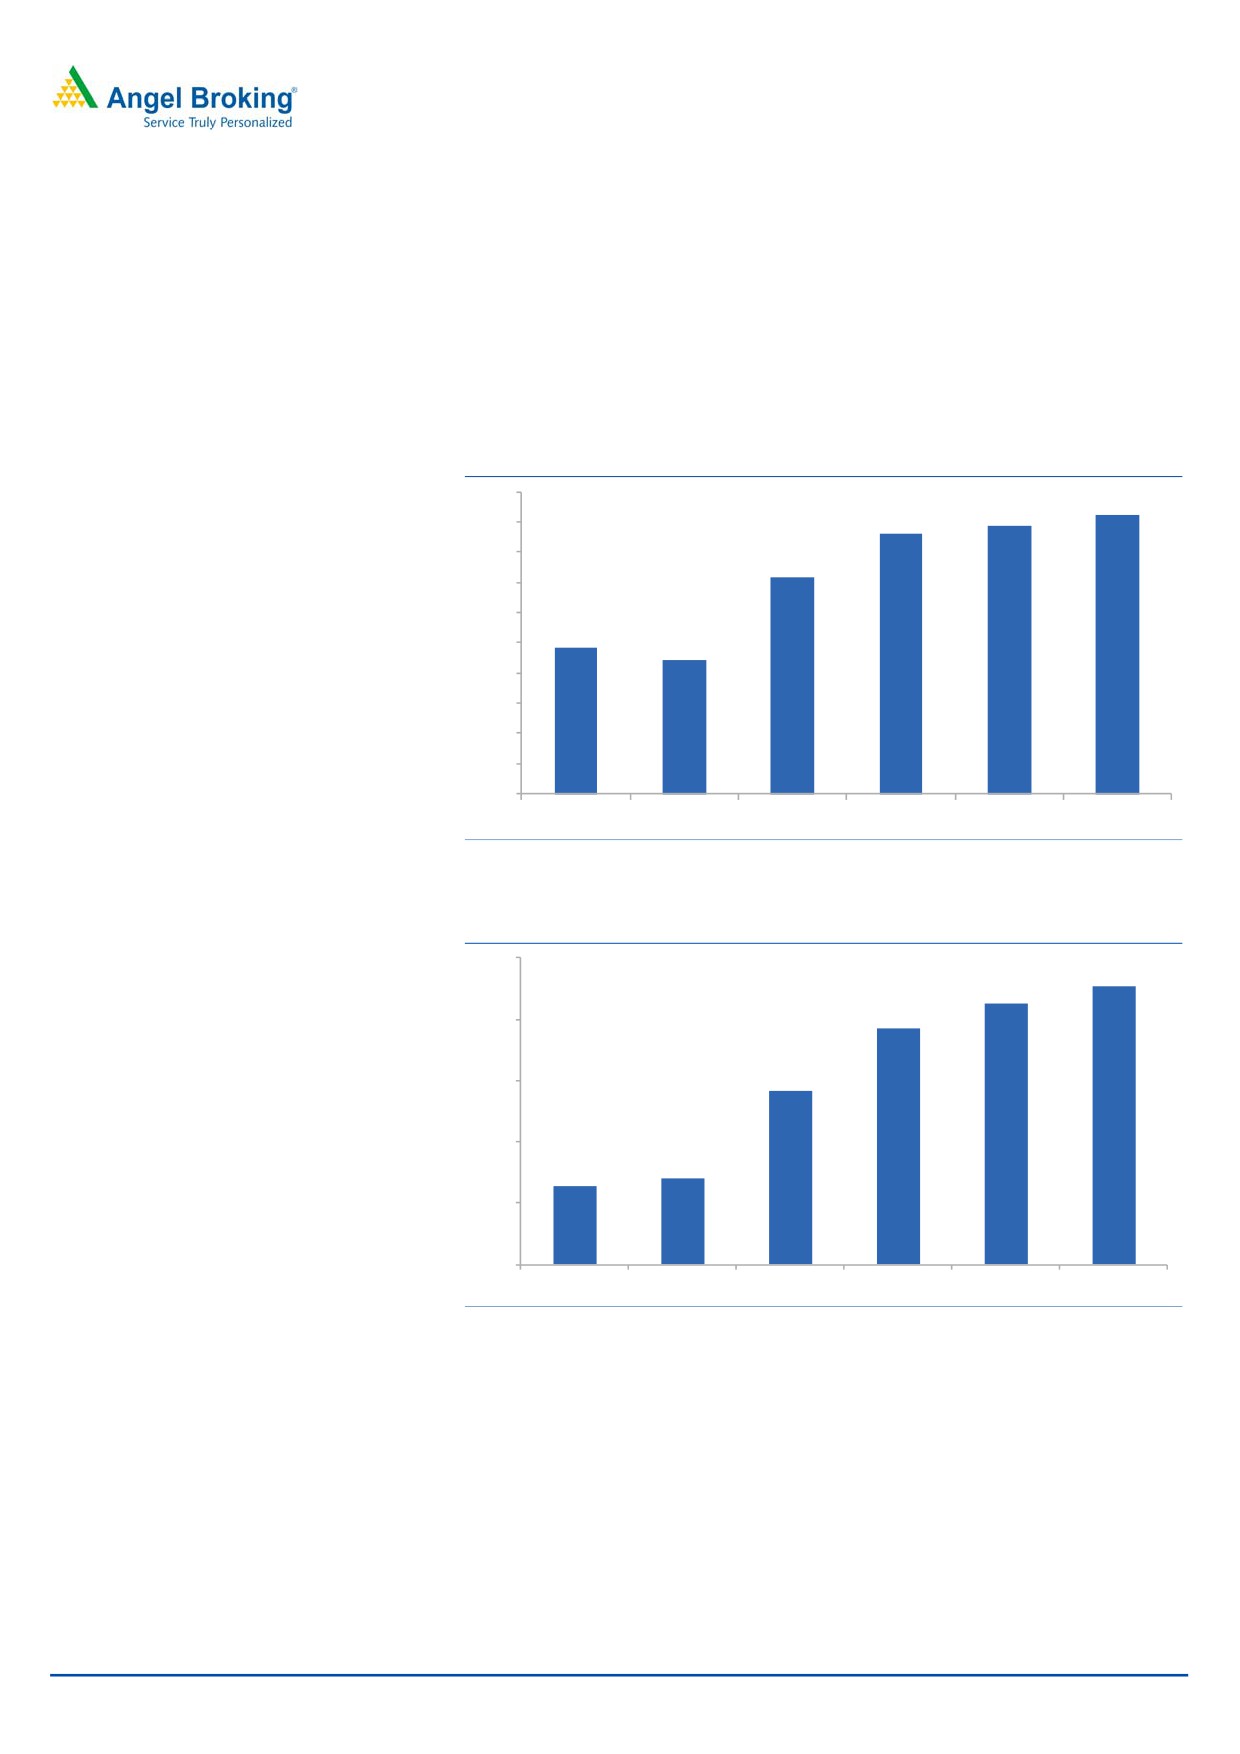
CRAMs will be the growth engine, Dewas plant to have high
asset turn over:
NFIL got a windfall gain of ~`400cr via sale of carbon credit and part of this was
used for starting the high margin and scalable Contract Research and
Manufacturing Services business. In order to make its presence felt in the global
markets the company acquired 51% stake in the UK based Manchester Orgaincs
Ltd, though small in size MOL is a highly specialized chemical research company.
The Company invested `65cr to set up a multipurpose plant. The plant with high
efficiency can operate at 2.5x-3x asset turn over at the peak level. After going
through various phases of customer audits, the plant started commercial
production in FY2016. Being the first cGMP compliant pilot plant for developing
high pressure fluorination, NFIL got access to global innovative Pharma companies
via this plant. The Dewas plant will help in growing the CRAMs business in the
years to come.
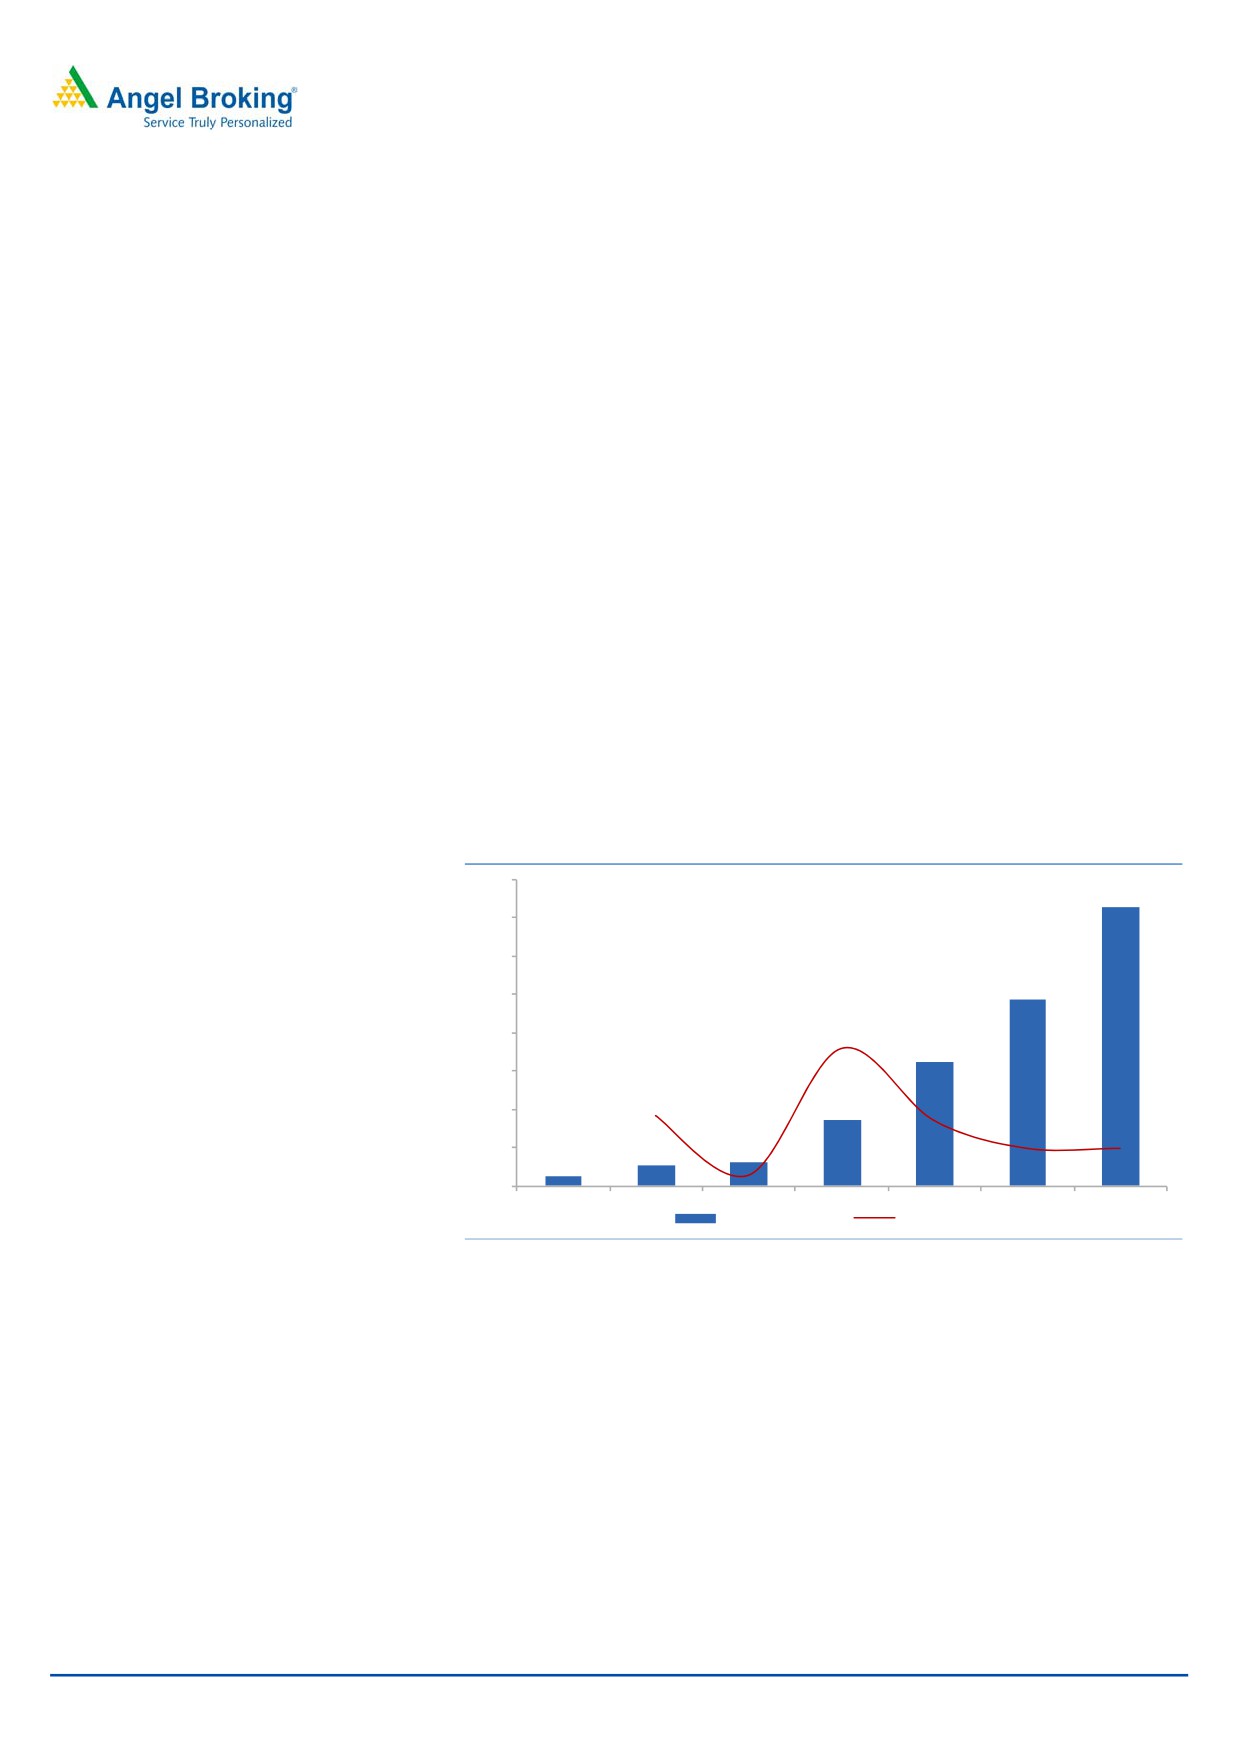
NFIL started the CRAMs business in 2011 and within a span of 5 years the share of
CRAMs in total business has gone up to 14% in FY2016. With increasing clients
mining, we expect the share of this increase upto 30% by FY2019. CRAMs is high
margin business with high entry barriers, but it also takes time to go through
various approval processes and build a scalable business.
Exhibit 13: High growth in CRAMS segment
400
365
350
300
243
250
200
162
181
150
87
100
93
86
50
27
31
50
50
14
15
0
CRAMS (` cr)
% YoY Growth
Source: Company, Angel Research
March 27, 2017
9
Initiating coverage | Navin Fluroine
Efforts for securing long term raw material sourcing to reduce
margin volatility:
NFIL’s margin is highly dependent on the movement of the raw material prices.
However, with higher contribution from the new business segments like Specialty
Chemicals and CRMAs, the correlation of price movement of input costs and
margins will reduce gradually. In the last few quarters, the cost of key raw
materials like Sulphur, Fluorspar, Chloroform & Boric Acid have seen downward
trend.
Exhibit 14: Raw materials as % of sales
48.0
47.6
47.5
47.2
47.0
46.4
46.5
46.0
45.5
45.0
44.7
44.5
44.0
43.5
43.0
FY13
FY14
FY15
FY16
Source: Company, Angel Research
Exhibit 15: Mix of Various Raw materials
As % of Total Raw materials
FY13
FY14
FY15
FY16
Fluorspar
36%
35%
26%
22%
Chloromethanes
11%
7%
14%
13%
Spor 11
7%
7%
5%
6%
Sulphur
6%
6%
7%
5%
Others
41%
44%
47%
54%
Total
100%
100%
100%
100%
Source: Company, Angel Research
Fluorspar is one of the key raw materials for the company, which is imported from
diverse regions. However, in order to secure long term availability of this key raw
material, the company has entered into a JV with GMDC in which NFIL holds 25%
stake. The JV is expected to supply fluorspar ore for further beneficiation from GMDC
mines. The JV is likely to start commercial production from FY2018 onwards.
Exhibit 16: Raw materials Mix
(` Cr)
FY13
FY14
FY15
FY16
Imported
184
140
174
173
Indigenous
63
69
110
87
Total
248
209
284
260
Imported
74%
67%
61%
67%
Indigenous
26%
33%
39%
33%
Source: Company, Angel Research
March 27, 2017
10
Initiating coverage | Navin Fluroine
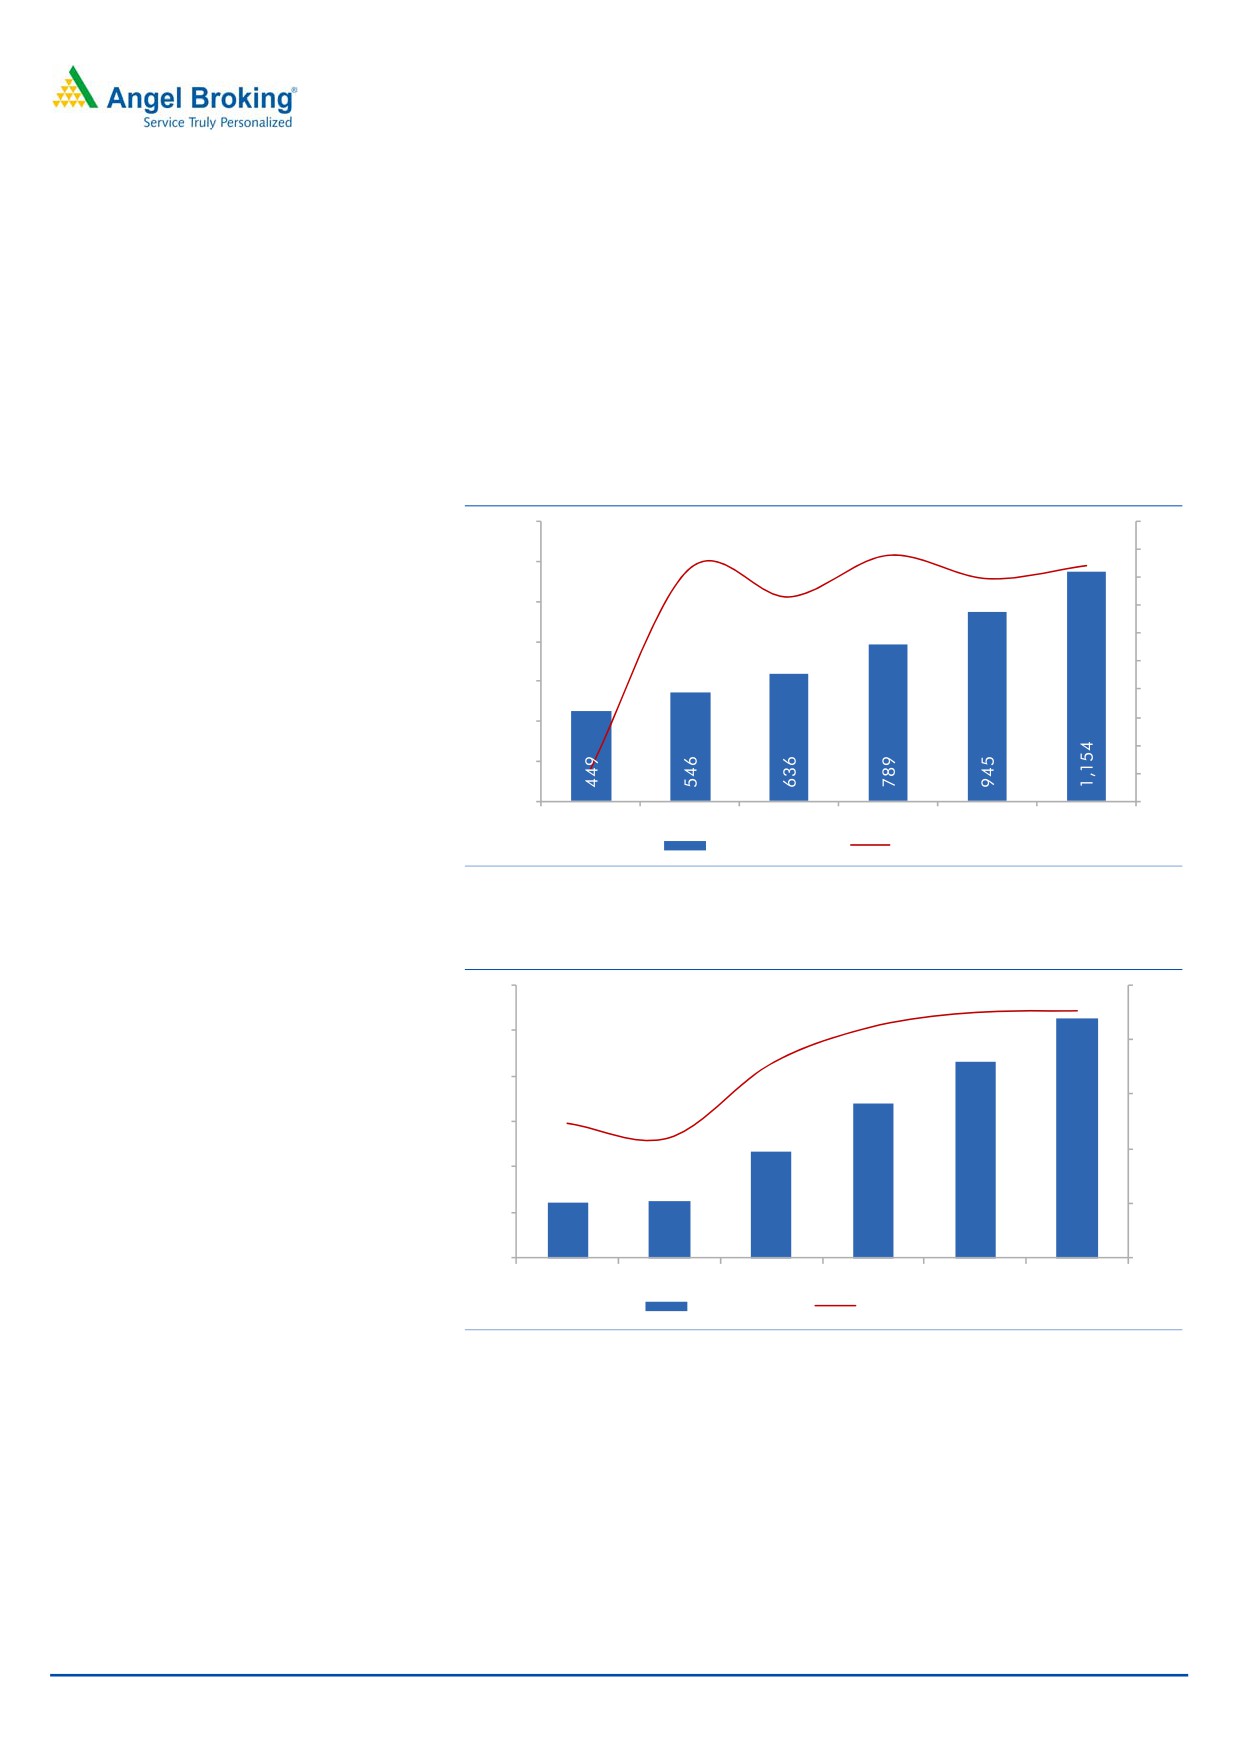
Expect Revenues /EBITDA / PAT to report 20%/30%/24% CAGR
over FY2016-19
NFIL reported a 16.8% growth in revenues in FY16, which has gained further
momentum during the year and we expect it to end FY17 with 24% YoY growth.
Over FY16-19the revenue CAGR is expected to be 22%, with large part of the
incremental growth being driven by the high margin specialty chemical and
CRAMs business. We expect EBITDA to report 31% CAGR over the same period on
the back of higher contribution from CRAMs segment, having better margins.
Exhibit 17: Revenue Growth
1,400
30
24.0
21.6
22.1
25
19.8
1,200
16.5
20
1,000
15
10
800
5
600
(14.4)
0
400
(5)
(10)
200
(15)
-
(20)
FY14
FY15
FY16
FY17E
FY18E
FY19E
Net Sales (` cr)
% Growth YoY
Source: Company, Angel Research
Exhibit 18: EBITDA & EBITDA Margin % Trend
300
22.4
22.6
25.0
21.1
264
250
17.8
215
20.0
200
170
15.0
12.3
11.0
150
116
10.0
100
61
63
5.0
50
0
0.0
FY14
FY15
FY16
FY17E
FY18E
FY19E
EBITDA (` cr)
EBITDA Margin (%)
Source: Company, Angel Research
March 27, 2017
11
Initiating coverage | Navin Fluroine
Low debt and strong cash flows has resulted in sharp
improvement in RoCE
NFIL has been generating strong cash flows, as a result of which it is able to fund
its capex via internal accruals, and hence the debt equity is at 0.2x, leading to
strong return ratios. The RoCE has improved from 9.9% in FY2013 to 14.1% by
FY2016 and with increasing share of value added products we expect this to touch
22.7% by FY2019.
Exhibit 19: ROE% has been improving
20.0
18.5
17.8
17.2
18.0
16.0
14.4
14.0
12.0
9.6
10.0
8.9
8.0
6.0
4.0
2.0
0.0
FY14
FY15
FY16
FY17E
FY18E
FY19E
Source: Company, Angel Research
Exhibit 20: See further improvement in ROCE %
25.0
22.7
21.3
19.3
20.0
14.1
15.0
10.0
7.0
6.4
5.0
0.0
FY14
FY15
FY16
FY17E
FY18E
FY19E
Source: Company, Angel Research
March 27, 2017
12
Initiating coverage | Navin Fluroine
Exhibit 21: Key Assumptions
Segmental Revenues (` Cr)
FY13
FY14
FY15
FY16
FY17E
FY18E
FY19E
Specialty Chemicals
177
156
215
239
292
350
420
Refrigerant Gases
177
154
194
215
237
248
261
Inorganic Fluoride
98
113
105
94
99
104
109
CRAMS
14
27
31
87
162
243
365
Total
467
450
545
635
789
945
1,154
Overall Growth % YoY
-
(4)
21
17
24
20
22
Segmental Growth % YoY
Specialty Chemicals
-
(12)
38
11
22
20
20
Refrigerant Gases
-
(13)
26
11
10
5
5
Inorganic Fluoride
-
15
(7)
(10)
5
5
5
CRAMS
-
93
15
181
100
50
50
Revenue Contribution %
Specialty Chemicals
38
35
39
38
37
37
36
Refrigerant Gases
38
34
36
34
30
26
23
Inorganic Fluoride
21
25
19
15
13
11
9
CRAMS
3
6
6
14
21
26
32
Source: Company, Angel Research
Exhibit 22: Favourable Change in Business Mix
Business Segment
Refrigerant
Sp -Chemicals
In- Fluorides CRAMs
Revenue Contribution ( FY11)
55%
27%
18%
0%
Revenue Contribution ( FY16)
34%
38%
14%
14%
Revenue Contribution (FY19E)
25%
32%
13%
30%
Geographic Distribution ( 9MFY17)
Domestic
70%
57%
93%
Exports
30%
43%
7%
100%
CAGR
FY13-16
6%
10%
(1.4%)
84%
FY16-19E
10%
14%
5%
61%
Source: Company, Angel Research
March 27, 2017
13
Initiating coverage | Navin Fluroine
Outlook and Valuation
NFIL’s presence in the high margin, scalable business with strong entry barriers
makes it a unique player in the Indian specialty chemical industry. While other
players like SRF Ltd and Gujarat Fluorochemicals Ltd are also present in the
Fluorine based specialty chemicals, they also do have many other divisions of
operations and this makes NFIL the only company to focus solely on Fluorine
based business. Thus, we believe NFIL will continue to attract premium valuations
due to the long term growth visibility and focused business model. At the CMP, the
stock is trading at 17x its FY2019E EPS and 10.1x EV/EBITDA. We have valued the
stock at 21x its FY2019E EPS and recommend BUY on the stock with 12 months
target price of `3,650.
Key Risks & Concerns
NFIL still derives ~33% of its total revenues from the refrigerant business. The
phase out of R-22 Refrigerant gas for developing countries had started in
2015 and is likely to be phased out completely by 2030. Earlier than expected
and aggressive phase out of the same could impact the business of NFIL.
CRAMs is a high margin business, but the company has to go through multiple
audits and approvals before it gets sizeable business. And any delay in off
take from the customer’s end can result in slow down in business growth.
Growth of the specialty chemicals division depends on growth of the user
industry like Pharma & Agrochemicals. The global Agrochemicals industry is
going through a phase of slow down due to drought in multiple geographies.
Longer than expected delay in recovery could impact the volumes and in turn
margins of NFIL
The company imports nearly 2/3rd of its raw materials from overseas markets
and any adverse movement in raw material prices could hit the profitability.
March 27, 2017
14
Initiating coverage | Navin Fluroine
Consolidated Profit & Loss Account
Y/E March (` cr)
Mar-15
Mar-16
Mar-17E
Mar-18E
Mar-19E
Total Net Sales
546
636
789
945
1,154
% Change
21.6
16.5
24.0
19.8
22.1
Total Raw materials
272
292
333
404
515
Staff costs
61
66
73
81
87
Other Expenditure
150
162
213
246
288
Total Expenditure
483
520
619
730
890
EBITDA
63
116
170
215
264
% Change
4.3
83.4
46.3
26.5
22.6
EBITDA Margin %
11.6
18.3
21.5
22.7
22.8
Depreciation
19
21
26
34
41
EBIT
45
95
144
181
223
% Change
11.2
113.1
50.9
25.9
23.1
EBIT Margin %
8.2
15.0
18.2
19.1
19.3
Interest
3
3
3
3
3
Other Income
27
25
25
20
20
( as % of PBT)
39
21
15
10
8
PBT
68
117
166
198
240
Tax
19
30
48
57
69
Tax Rate %
27
26
29
29
29
APAT
49
86
118
140
170
% Change
(2.5)
75.1
35.9
19.4
21.2
March 27, 2017
15
Initiating coverage | Navin Fluroine
Balance Sheet ( Consolidated)
Y/E March (` cr)
Mar-15
Mar-16
Mar-17E
Mar-18E
Mar-19E
Share Capital
10
10
10
10
10
Reserves & Surplus
561
624
721
838
983
Net Worth
571
634
731
848
993
Total Loan funds
45
30
27
24
22
Deferred Tax Liability
32
36
36
36
36
Capital Employed
648
699
793
908
1,050
Gross Block
422
430
445
460
475
Less: Depreciation
152
163
189
223
264
Net Block
270
267
256
237
211
Investments
234
266
295
328
364
Sundry Debtors
110
138
166
199
239
Cash & Bank Bal
14
15
82
155
253
Loans & Advances
95
81
88
95
103
Inventory
66
63
73
84
98
Other Current Assets
3
3
3
4
5
Total Current Assets
287
300
412
537
697
Current Liabilities
124
125
144
165
190
Sundry Creditors
88
92
106
122
140
Other Creditors
36
33
37
43
50
Provision
20
24
27
29
32
Curr Liab & Prov
144
149
170
194
222
Net Current Assets
143
151
242
343
475
Total Assets
648
699
793
908
1,050
March 27, 2017
16
Initiating coverage | Navin Fluroine
Cash Flow Statement ( Consolidated)
Y/E March (` cr)
Mar-15
Mar-16
Mar-17E Mar-18E Mar-19E
PBT
68
117
166
198
240
Depreciation & Amortization
19
11
26
34
41
Provision for Taxes
(19)
(30)
(48)
(57)
(69)
Chg in Deferred tax
(1)
4
-
-
-
Chg in Working cap
(17)
(7)
(24)
(28)
(34)
Cash flow from operations
50
95
120
146
177
Chg in Gross Block
(58)
(9)
(14)
(15)
(15)
Chg in Investments
28
(32)
(29)
(32)
(36)
Chg in WIP
-
(14)
14
-
-
Cash flow from investing
(29)
(54)
(30)
(47)
(51)
Chg in debt
(12)
(15)
(3)
(3)
(2)
Chg in Net Worth
(2)
(4)
(0)
0
(0)
Dividend
(18)
(20)
(21)
(23)
(25)
Cash flow from financing
Chg in cash
(11)
1
67
73
98
Cash at start
25
14
15
82
155
Cash at end
14
15
82
155
253
March 27, 2017
17
Initiating coverage | Navin Fluroine
Key Ratios
Financial Ratios
2015
2016
2017E
2018E
2019E
Growth (%)
Net Sales
21.6
16.5
24.0
19.8
22.1
EBITDA
4.3
83.4
46.3
26.5
22.6
APAT
(2.5)
75.1
35.9
19.4
21.2
Profitability (%)
EBITDA Margin
11.0
17.8
21.1
22.4
22.6
Adj. PAT Margin
9.0
13.6
14.9
14.9
14.7
ROCE
7.0
14.1
19.3
21.3
22.7
ROE
8.9
14.4
17.2
17.8
18.5
Angel (ROIC)
7.4
14.7
21.3
25.2
29.2
Per Share Data (`)
Adj. EPS
51
88
120
143
174
Adj. CEPS
70
113
147
178
215
BVPS
585
647
747
867
1015
Valuations (X)
PER
58.4
33.5
24.6
20.6
17.0
P/BV
5.1
4.6
4.0
3.4
2.9
EV / EBITDA
46.1
25.0
16.7
12.9
10.1
EV / Net sales
5.3
4.6
3.6
2.9
2.3
Dividend Yield (%)
0.5
0.6
0.6
0.7
0.7
Turnover Days
Asset Turnover ( Gross Block)
1.3
1.5
1.8
2.1
2.4
Inventory days
88
78
80
76
69
Debtors days
74
79
77
77
76
Creditors days
119
115
116
110
100
Working Capital Days
43
42
40
43
45
Gearing Ratio
Total Debt to Equity
0
0
0
0
0
March 27, 2017
18
Initiating coverage | Navin Fluroine
Research Team Tel: 022 - 39357800
DISCLAIMER
Angel Broking Private Limited (hereinafter referred to as “Angel”) is a registered Member of National Stock Exchange of India Limited,
Bombay Stock Exchange Limited and Metropolitan Stock Exchange Limited. It is also registered as a Depository Participant with CDSL
and Portfolio Manager with SEBI. It also has registration with AMFI as a Mutual Fund Distributor. Angel Broking Private Limited is a
registered entity with SEBI for Research Analyst in terms of SEBI (Research Analyst) Regulations, 2014 vide registration number
INH000000164. Angel or its associates has not been debarred/ suspended by SEBI or any other regulatory authority for accessing
/dealing in securities Market. Angel or its associates/analyst has not received any compensation / managed or co-managed public
offering of securities of the company covered by Analyst during the past twelve months.
This document is solely for the personal information of the recipient, and must not be singularly used as the basis of any investment
decision. Nothing in this document should be construed as investment or financial advice. Each recipient of this document should
make such investigations as they deem necessary to arrive at an independent evaluation of an investment in the securities of the
companies referred to in this document (including the merits and risks involved), and should consult their own advisors to determine
the merits and risks of such an investment.
Reports based on technical and derivative analysis center on studying charts of a stock's price movement, outstanding positions and
trading volume, as opposed to focusing on a company's fundamentals and, as such, may not match with a report on a company's
fundamentals. Investors are advised to refer the Fundamental and Technical Research Reports available on our website to evaluate the
contrary view, if any.
The information in this document has been printed on the basis of publicly available information, internal data and other reliable
sources believed to be true, but we do not represent that it is accurate or complete and it should not be relied on as such, as this
document is for general guidance only. Angel Broking Pvt. Limited or any of its affiliates/ group companies shall not be in any way
responsible for any loss or damage that may arise to any person from any inadvertent error in the information contained in this report.
Angel Broking Pvt. Limited has not independently verified all the information contained within this document. Accordingly, we cannot
testify, nor make any representation or warranty, express or implied, to the accuracy, contents or data contained within this document.
While Angel Broking Pvt. Limited endeavors to update on a reasonable basis the information discussed in this material, there may be
regulatory, compliance, or other reasons that prevent us from doing so.
This document is being supplied to you solely for your information, and its contents, information or data may not be reproduced,
redistributed or passed on, directly or indirectly.
Neither Angel Broking Pvt. Limited, nor its directors, employees or affiliates shall be liable for any loss or damage that may arise from
or in connection with the use of this information.
Disclosure of Interest Statement
Navin Fluroine
1. Financial interest of research analyst or Angel or his Associate or his relative
No
2. Ownership of 1% or more of the stock by research analyst or Angel or associates or relatives
No
3. Served as an officer, director or employee of the company covered under Research
No
4. Broking relationship with company covered under Research
No
Ratings (Based on expected returns
Buy (> 15%)
Accumulate (5% to 15%)
Neutral (-5 to 5%)
over 12 months investment period):
Reduce (-5% to -15%)
Sell (< -15)
March 27, 2017
19