4QFY2017 Result Update | Pharma
June 5, 2017
Natco Pharma
ACCUMULATE
CMP
`968
Performance Highlights
Target Price
`1,060
Y/E March (` cr)
4QFY17 4QFY16 % chg (yoy) FY17
FY16
% chg (yoy)
Investment Period
12 Months
Net Sales
578
394
46.5
2,065
1,080
91.2
EBITDA
241
93
158.7
683
266
157.3
Stock Info
EBITDA Margin (%)
41.7
23.6
1809 bp
33.1
24.6
850 bp
Sector
Pharma
Adj. PAT
176
63
178.6
486
155
213.8
Market Cap (` cr)
16,865
Source: Company, Angel Research
Net Debt (` cr)
187
Tamiflu lifts 4Q numbers: Natco reported strong earnings in 4QFY17 owing to
Beta
0.6
strong sales of generic Tamiflu during the quarter. Company reported 47% yoy
52 Week High / Low
1,015/480
growth in its top line to `578cr. EBITDA in the quarter came in at `241cr, vs.
Avg. Daily Volume
46,541
`93cr in 4QFY16 and `195cr in 3QFY7. EBITDA margin was at 41.7%, up by
Face Value (`)
2
more than 1800bss on yoy basis due to the higher sales and profit sharing of
BSE Sensex
31,309
gTamiflu. Company during the quarter reported yoy 2.8x jump in the PAT from
Nifty
9,675
`63cr to 176cr. Employee cost increased 49% during the quarter mainly due to
Reuters Code
NATP NS
the ESOP and bonus to employees. From the conference call, we understand that
Bloomberg Code
NTCPH IN
the company is almost launch ready for gCopaxone however the final decision to
launch the drug lies with Mylan. gCopaxone launch is expected to significantly
Shareholding Pattern (%)
boost its top line and bottom line due to the limited competition and complex
Promoters
51.2
nature of the drug. Besides, company is also expected to benefit from
MF / Banks / Indian Fls
20.5
observations on facility of Momenta, the existing generic manufacturer in 20mg.
FII / NRIs / OCBs
6.3
Outlook and valuation: The bumper earnings in 4QFY17 were mostly expected
Indian Public / Others
22.1
and there was no surprise element. We however believe that company is almost
launch ready for gCopaxone in June-2017. We gain significant confidence that
Mylan/Natco are most likely to launch the drug soon which is the most important
Abs. (%)
3m 1yr 3yr
trigger for the Natco at the moment. Company has responded all the queries on
Sensex
8.6
16.6
26.0
gCopaxone and from the commentary in the conference call, it’s just a matter of
Natco Pharma
26.1
102.5
544.0
time before the company launches this gCopaxone 20mg and 40mg. We value
Natco’s base business at 24x of its FY19E EPS to 587 per share and add NPV of
3-year price chart
R&D pipeline of `471 to derive new price target of `1,060. Our target indicates
1,200
10% upside from the CMP of `968.
1,000
Key financials (Consolidated)
800
Y/E March (` cr)
FY15
FY16
FY17
FY18E
FY19E
600
Net Sales
825
1,080
2,065
1,988
2,131
400
200
% chg
11.7
30.9
91.2
(3.7)
7.2
0
Net Profit
213
266
683
670
653
% chg
19.0
24.5
157.3
(2.0)
(2.5)
OPM (%)
25.9
24.6
33.1
33.7
30.7
Source: Company, Angel Research
EPS (`)
8.1
8.9
27.9
25.7
24.5
P/E (x)
119.4
108.8
34.7
37.6
39.5
P/BV (x)
19.0
13.0
10.1
8.6
7.5
RoE (%)
15.9
11.9
29.2
22.9
19.1
RoCE (%)
14.3
15.2
33.1
27.5
23.3
Shrikant Akolkar
EV/Sales (x)
20.8
15.7
8.3
8.3
7.8
022-3935 7800 Ext: 6846
EV/EBITDA (x)
80.4
63.8
25.0
24.7
25.3
Source: Company, Angel Research; Note: CMP as of June 05, 2017
Please refer to important disclosures at the end of this report
1
Natco Pharma |4QFY2017 Result Update
Exhibit 1: Quarterly financial performance
Y/E March (` cr)
4QFY17
4QFY16
% chg (yoy)
3QFY17
% chg (qoq)
FY17
FY16
% chg (yoy)
Net sales
578
394
46.5
679
(14.9)
2,065
1,080
91.2
Consumption of RM
117
100
17.4
206
(43.0)
599
271
121.4
(% of Sales)
20.3
25.3
30.3
29.0
25.1
Staff costs
80
53
49.3
61
31.1
243
180
35.3
(% of Sales)
13.8
13.5
8.9
11.8
16.6
Other expenses
140
148
(5.5)
153
(8.4)
539
364
48.1
(% of Sales)
24.2
37.6
22.5
26.1
33.7
Total Expenditure
337
301
11.8
419
(19.6)
1,382
815
69.6
Operating Profit
241
93
158.7
260
(7.3)
683
266
157.3
OPM
41.73
23.63
1809 bp
38.3
342 bp
33.1
24.6
850 bp
Depreciation
14
12
9.8
14
(1.5)
54
51
7.1
Other income
(1)
0
(250.0)
6
(109.8)
14
10
44.8
Finance cost
6
4
77.8
5
39.1
19
23
(19.2)
PBT (excl. Extr. Items)
221
78
183.9
248
(11.0)
624
202
209.9
Extr. Income/(Expense)
0
0
0
0
0
PBT (incl. Extr. Items)
221
78
183.9
248
(11.0)
624
202
209.9
(% of Sales)
38.2
19.7
1847 bp
36.5
166 bp
30.2
18.7
1158 bp
Tax
44
14
213.5
53
(16.8)
140
48
191.2
(% of PBT)
20.0
18.1
21.4
22.3
23.8
Reported PAT
176
64
177.4
195
(9.4)
485
154
215.7
Minority interest and Associate Company
(0)
(0)
(25.0)
(0)
50.0
(1)
(1)
(15.4)
Adj PAT
176
63
178.6
195
(9.5)
486
155
213.8
Adj. PATM
30.5
16.0
28.7
23.5
14.3
Equity capital (cr)
35
35
35
35
35
Adjusted EPS (`)
10
4
177.1
11
(9.4)
28
9
213.8
Source: Company, Angel Research
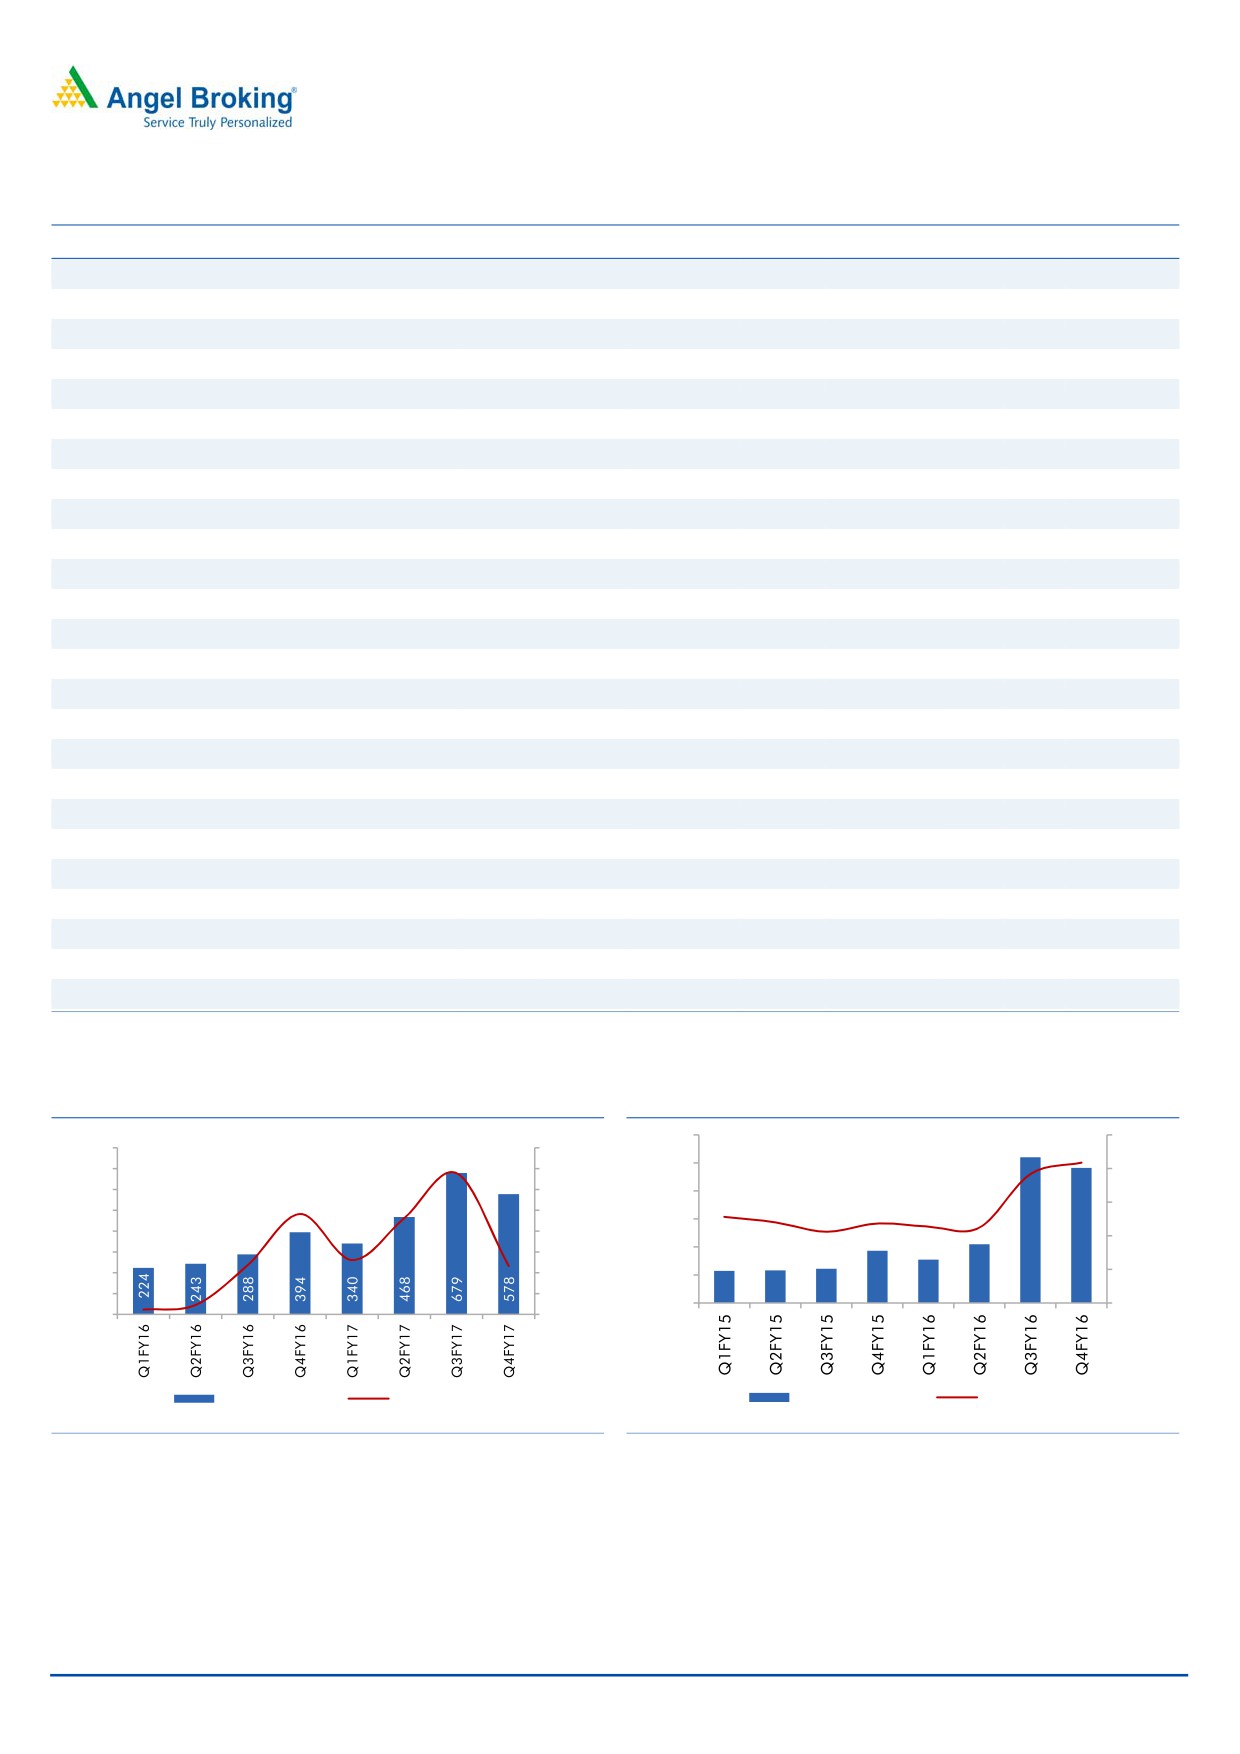
Exhibit 2: Tamiflu inspires strong Topline growth
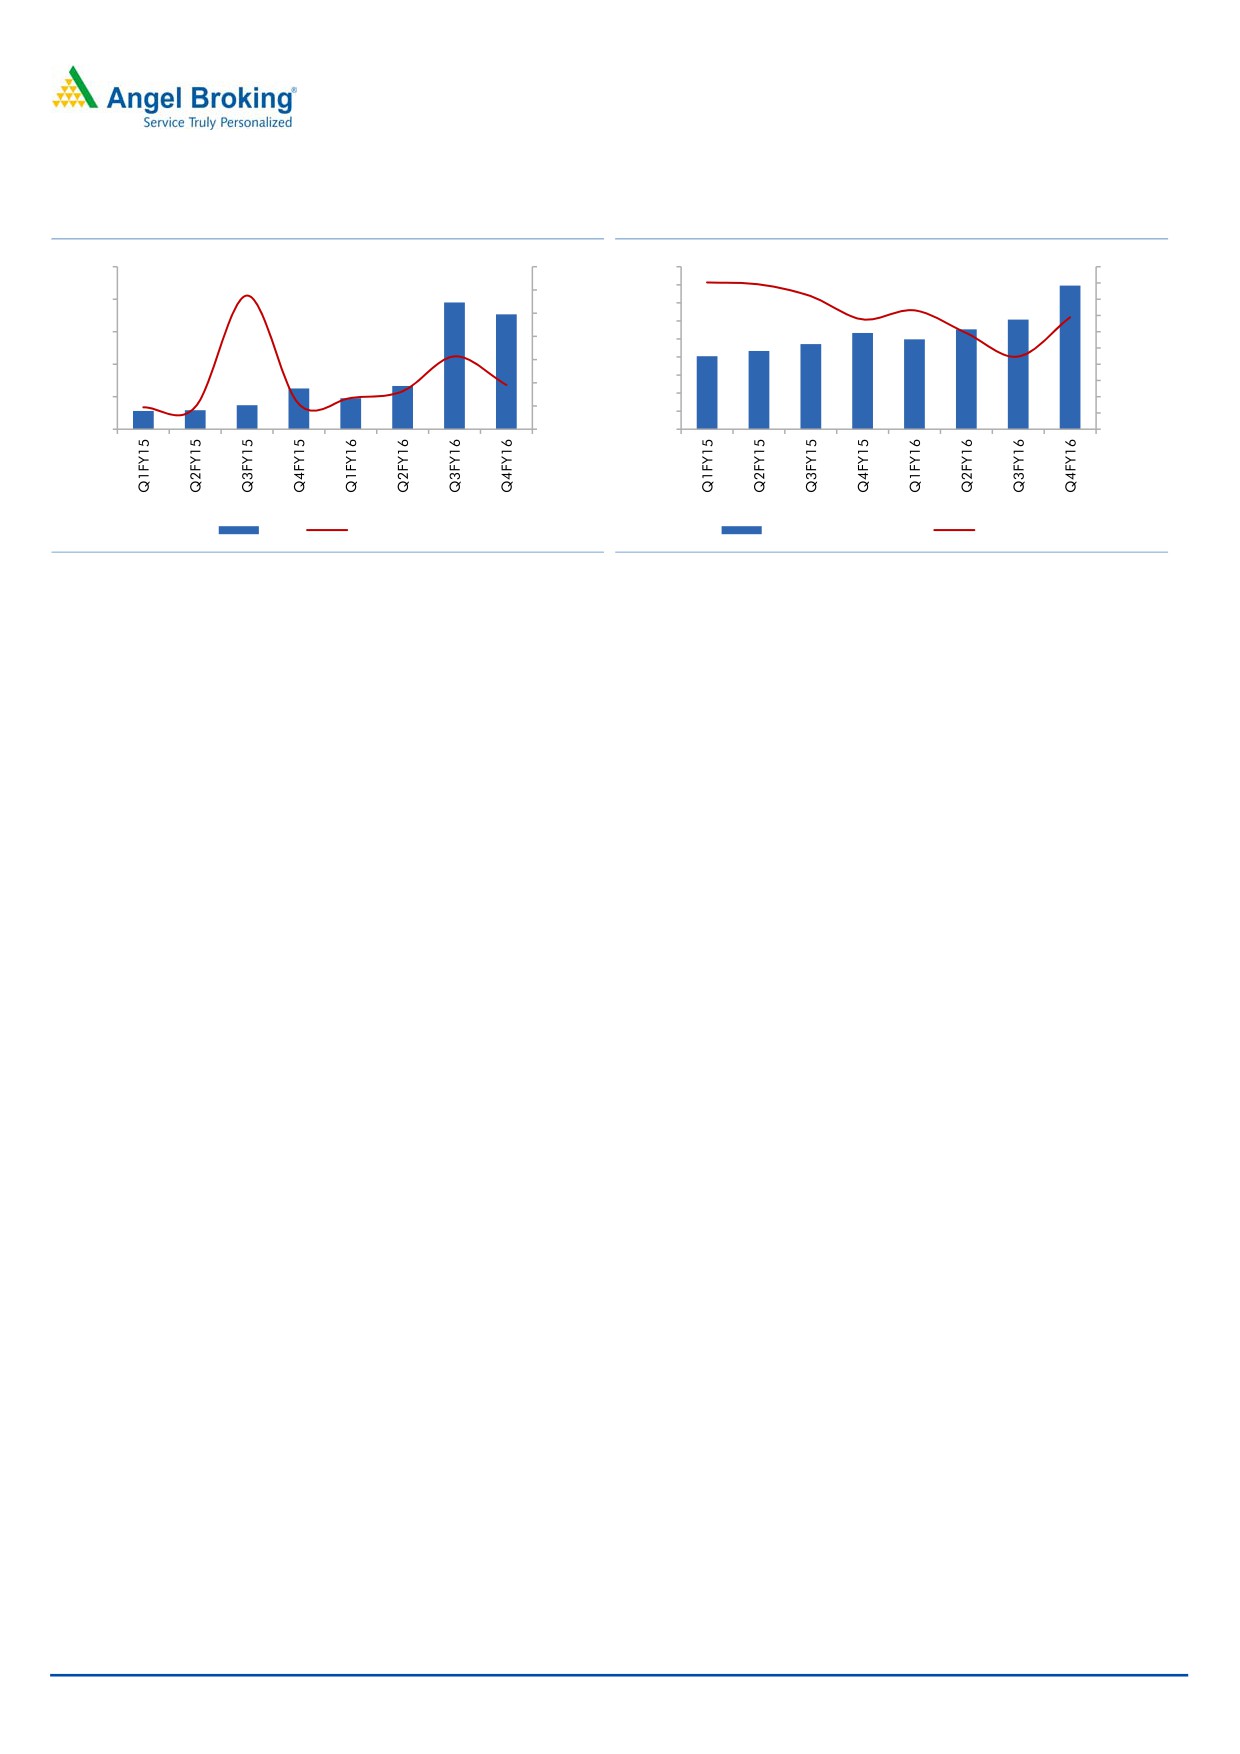
Exhibit 3: Operating margins improve significantly
300
50
800
136
160
250
700
140
40
600
96
120
200
93
30
500
100
52
47
150
400
9
80
5
20
47
300
60
100
200
40
50
10
100
20
0
0
0
0
Net sales (`cr)
yoy growth (%)
Operating profit
Margin (%)
Source: Company, Angel Research
Source: Company, Angel Research
February 14, 2017
2
Natco Pharma |4QFY2017 Result Update
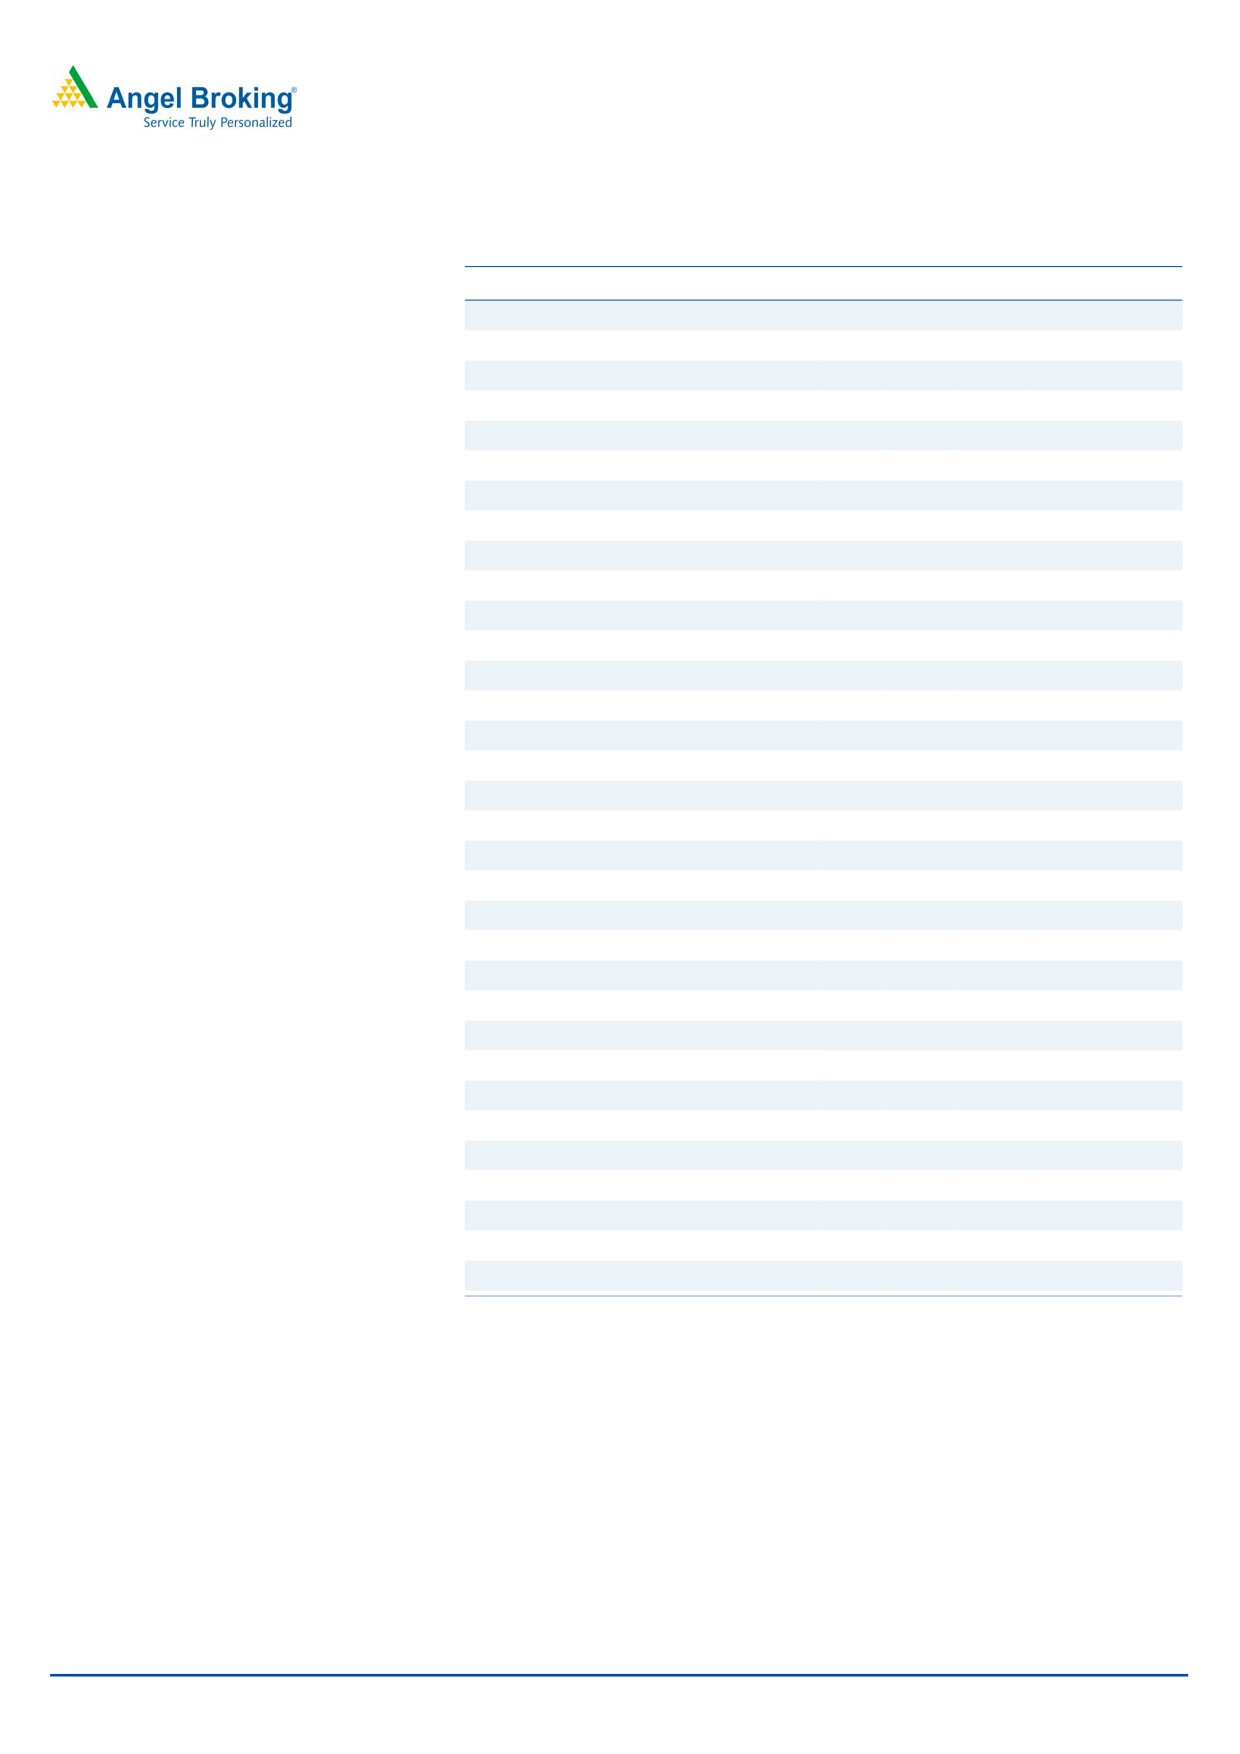
Exhibit 4: ~2.8x yoy growth in PAT
Exhibit 5: Employee costs soars on one off payments
250
1,200
90
20.0
80
18.0
1,000
200
70
16.0
800
14.0
60
150
12.0
600
50
10.0
400
40
100
8.0
200
30
6.0
50
20
4.0
0
10
2.0
0
-200
0
0.0
PAT
yoy growth (%)
Employee cost
as % of sales
Source: Company, Angel Research
Source: Company, Angel Research
Conference call - Key highlights
Company has indicated of tough business environment due to the pricing
pressure in the US.
Natco will focus more on the domestic business and will be selective of low
competition products in the US. The higher free cash flow earned this year will
be used for debt repayment.
gCopaxone launch is almost certain in FY18. Company has said that there is
not much price erosion expected at the moment in gCopaxone franchisee.
gTamiflu sales in FY17 were `705cr which included `404 in profit sharing.
HepC business during the quarter done well and company expects 20-25%
growth in FY18. Onco revenue during FY17 was `322cr.
1QFY18 revenue will also see some positive effect of gTamiflu sales.
Company has filed for suspension of gTamiflu.
Company expects a conservative `1,700cr revenue in FY18 (ex-Copaxone)
with `420cr in PAT. This estimate includes new product launches in India.
Capex for FY18E would be `350cr.
Company is planning to add another line in Guwahati and invest in API
capacity.
Vizag capacity will be ready soon and has not filling from there as of now.
Rest all plants of Natco are current with USFDA.
Company has said that the domestic drug regulator has increased scrutiny of
manufacturing plants and has made plant inspection mandatory for new drug
approvals.
Total debt at the end of the quarter was `80cr and cash position is `230cr.
February 14, 2017
3
Natco Pharma |4QFY2017 Result Update
Investment arguments
Niche therapeutic player in domestic formulations: Natco is a niche
therapeutic segment player in the domestic formulations business (57% of
revenues). It mainly focuses on oncology and Hepatitis C segments. The
oncology segment continues to grow as market dynamics favor while Hepatitis
C franchisee is expected to grow by 20-25% rate over next couple of years due
to huge cost advantage and limited competition. Owing to this, we expect 25%
CAGR in domestic formulations over FY16-FY19E.
Copaxone approval remains a near term trigger: Natco and its marketing
partner Mylan believe that they are the FTF filers on multiple sclerosis drug
Copaxone 40mg. The US District Court has already invalidated several
patents on this drug and Natco/Mylan have successfully addressed all queries
on this drug to the regulator. Additionally the generic manufacturer of 20mg
version, Momenta, has received form 483 on its manufacturing facility which
will delay Teva/Momenta’s gCompaxone 40mg copy. With the June-17 as
mostly likely launch month of gCopaxone 40mg and 20mg, Natco/Mylan are
expected to emerge as the biggest beneficiary from this.
Revlimid opportunity significantly big: Natco has several low competition drugs
in its pipeline which includes gVidara, gDoxil, gForsenol, etc. We believe that
Natco has a significant large opportunity in another limited competition
multiple myeloma drug gRevlimid. Natco has settled litigation regarding
Revlimid (US sales of $4.4bn) with its innovator Celgene and will be able to
launch this drug in 2022E. This will be a very large opportunity considering
the size and growth rate of this drug.
Proven track record in execution and regulatory compliance: Natco has been
able to keep its facilities USFDA compliant since beginning, this is especially
good when several India drug makers have seen adverse regulatory action on
their manufacturing sites. Natco is also going through a period of
extraordinary growth and USFDA compliance is paramount at this stage. We
believe that Natco is a big league player with ability to manufacture limited
competition niche drugs and partner with big companies to sell them.
Outlook and valuation
The bumper earnings in 4QFY17 were mostly expected and there was no surprise
element. We however believe that company is almost launch ready for gCopaxone
in June-2017. We gain significant confidence that Mylan/Natco are most likely to
launch the drug soon which is the most important trigger for the Natco at the
moment. Company has responded all the queries on gCopaxone and from the
commentary in the conference call, it’s just a matter of time before the company
launches this gCopaxone 20mg and 40mg. We value Natco’s base business at
24x of its FY19E EPS to 587 per share and add NPV of R&D pipeline of `471 to
derive new price target of `1,060. Our target indicates 10% upside from the CMP
of `968.
February 14, 2017
4
Natco Pharma |4QFY2017 Result Update
Company background
Natco pharma is a Hyderabad based R&D driven organization. The company has
presence in domestic and global markets and has two main business segments i.e.
API and Formulations. It has seven manufacturing facilities which are approved by
various medical regulatory authorities and prominent ones include US FDA, WHO
GMP, ANVISA. The company mainly operates in the niche therapeutic segments
I.e. Oncology and Hepatitis-C. Natco was earlier pure oncology play in the
domestic market however in 2015; company forayed in the Hepatitis C segment,
diversifying its domestic operations. Further in 2017, company has forayed in
Diabetology and cardiology. In the overseas markets, company is present in US,
Canada, Europe, Australia, Brazil etc. The company mainly focuses on limited
competition products with high margin. In the domestic markets, company is
ranked as #1 in oncology segment while in Hepatitis-C; it has been able to grow
faster than the competition due to early mover’s advantage. IN the US, company
focuses on limited competition products and has partnered with several Indian as
well as overseas partners which helps it mitigate risk and launch products. Natco’s
logistics network in India is well-knit with about 150 marketing personnel and
distributors at strategic points to ensure product availability pan-India.
February 14, 2017
5
Natco Pharma |4QFY2017 Result Update
Profit and loss statement
Y/E March (` cr)
FY15
FY16
FY17
FY18E
FY19E
Total operating income
825
1,080
2,065
1,988
2,131
% chg
11.7
30.9
91.2
(3.7)
7.2
Total Expenditure
612
815
1,382
1,318
1,478
Cost of Materials
242
271
599
537
586
Personnel
137
180
243
304
380
Others Expenses
233
364
539
477
511
EBITDA
213
266
683
670
653
% chg
19.0
24.5
157.3
(2.0)
(2.5)
(% of Net Sales)
25.9
24.6
33.1
33.7
30.7
Depreciation& Amortisation
47
51
54
67
78
EBIT
166
215
629
603
576
% chg
11.6
29.3
192.8
(4.1)
(4.6)
(% of Net Sales)
20.1
19.9
30.5
30.3
27.0
Interest & other Charges
32
23
19
24
24
Other Income
15
10
14
24
24
(% of PBT)
10.0
4.8
2.2
4.0
4.2
Share in profit of Ass.
-
-
-
-
-
Recurring PBT
149
202
624
604
576
% chg
4.1
50.1
209.9
(3.3)
(4.6)
Prior Period & Extra. Exp.
15
-
-
-
-
PBT (reported)
134
202
624
604
576
Tax
4
48
140
157
150
(% of PBT)
2.9
23.8
22.3
26.0
26.0
PAT (reported)
130
154
485
447
426
Add: Share of earnings of ass.
Less: Minority interest (MI)
(4)
(1)
(1)
(1)
(1)
PAT after MI (reported)
135
155
486
448
427
ADJ. PAT
150
155
486
448
427
% chg
45.8
3.4
213.8
(7.8)
(4.6)
(% of Net Sales)
18.1
14.3
23.5
22.5
20.1
Basic EPS (`)
8.1
8.9
27.9
25.7
24.5
Fully Diluted EPS (`)
8.1
8.9
27.9
25.7
24.5
% chg
45.8
3.4
213.8
(7.8)
(4.6)
February 14, 2017
6
Natco Pharma |4QFY2017 Result Update
Balance Sheet Statement
Y/E March (` cr)
FY15
FY16
FY17E
FY18E
FY19E
SOURCES OF FUNDS
Equity Share Capital
33
35
35
35
35
Reserves& Surplus
813
1,263
1,632
1,923
2,201
Shareholders’ Funds
846
1,298
1,667
1,958
2,236
Minority Interest
5
5
4
4
4
Total Loans
312
113
236
236
236
Deferred Tax Liability
12
14
15
15
15
Other long term liabilities
1
1
1
1
1
Long-term provisions
9
12
12
12
12
Total Liabilities
1,185
1,443
1,935
2,226
2,504
APPLICATION OF FUNDS
Gross Block
886
972
1,149
1,228
1,548
Less: Acc. Depreciation
222
268
322
389
466
Net Block
664
705
827
839
1,081
Intangible assets
46
9
6
6
6
Capital work-in-progress
129
212
363
313
263
Non-current investments
2
0
0
0
0
Long-term loans and advances
57
62
62
62
62
Other non-current assets
4
4
4
4
4
Current Assets
483
832
1,063
1,527
1,650
Inventories
220
357
351
381
409
Sundry Debtors
192
262
475
436
467
Cash
13
45
47
524
579
Loans & Advances
55
104
134
129
139
Other Assets
2
64
56
56
56
Current liabilities
199
380
391
525
563
Net Current Assets
284
452
672
1,001
1,087
Deferred Tax Asset
-
-
-
-
-
Mis. Exp. not written off
-
-
-
-
-
Total Assets
1,185
1,443
1,935
2,226
2,504
Note: Cash includes cash with scheduled banks on dividend current accounts
February 14, 2017
7
Natco Pharma |4QFY2017 Result Update
Cash flow statement
Y/E March (`cr)
FY15
FY16
FY17E
FY18E
FY19E
Profit before tax
134
207
624
604
576
Depreciation
47
51
54
67
78
Change in Working Capital
(86)
(150)
(219)
149
(31)
Interest / Dividend (Net)
30
21
19
24
24
Direct taxes paid
(24)
(46)
(139)
(157)
(150)
Others
(9)
20
-
-
-
Cash Flow from Operations
93
102
340
685
497
(Inc.)/ Dec. in Fixed Assets
(117)
(157)
(328)
(29)
(270)
(Inc.)/ Dec. in Investments
2
2
3
-
-
Cash Flow from Investing
(115)
(155)
(325)
(29)
(270)
Issue of Equity
-
334
0
-
-
Inc./(Dec.) in loans
71
(199)
123
-
-
Interest paid
(30)
(25)
(19)
(24)
(24)
Dividend Paid (Incl. Tax)
(12)
(25)
(117)
(156)
(148)
Effect of currency translation adjustment
(5)
(1)
0
0
0
Cash Flow from Financing
24
85
(13)
(179)
(172)
Inc./(Dec.) in Cash
2
32
1
478
55
Opening Cash balances
11
13
45
47
524
Closing Cash balances
13
45
47
524
579
February 14, 2017
8
Natco Pharma |4QFY2017 Result Update
Key ratios
Y/E March
FY15
FY16
FY17E
FY18E
FY19E
Valuation Ratio (x)
P/E (on FDEPS)
119.4
108.8
34.7
37.6
39.5
P/CEPS
88.4
81.9
31.2
32.8
33.4
P/BV
19.0
13.0
10.1
8.6
7.5
Dividend yield (%)
0.1
0.2
0.7
0.9
0.9
EV/Sales
20.8
15.7
8.3
8.3
7.8
EV/EBITDA
80.4
63.8
25.0
24.7
25.3
EV / Total Assets
14.5
11.7
8.8
7.4
6.6
Per Share Data (`)
EPS (Basic)
8.1
8.9
27.9
25.7
24.5
EPS (fully diluted)
8.1
8.9
27.9
25.7
24.5
Cash EPS
10.9
11.8
31.0
29.5
29.0
DPS
1.2
1.5
6.8
9.0
8.6
Book Value
50.9
74.5
95.7
112.4
128.3
Dupont Analysis
EBIT margin
20.1
19.9
30.5
30.3
27.0
Tax retention ratio
1.0
0.8
0.8
0.7
0.7
Asset turnover (x)
0.7
0.8
1.1
1.2
1.1
ROIC (Post-tax)
14.1
12.0
26.3
26.8
22.5
Cost of Debt (Post Tax)
0.10
0.16
0.06
0.07
0.07
Leverage (x)
0.4
0.1
0.1
(0.1)
(0.2)
Operating ROE
19.0
12.6
29.3
22.8
19.1
Returns (%)
ROCE
14.3
15.2
33.1
27.5
23.3
Angel ROIC (Pre-tax)
14.5
15.7
33.9
36.2
30.4
ROE
15.9
11.9
29.2
22.9
19.1
Turnover ratios (x)
Asset Turnover (Gross Block)
0.9
1.1
1.8
1.6
1.4
Inventory / Sales (days)
97
121
62
70
70
Receivables (days)
85
88
84
80
80
Payables (days)
55
93
46
70
70
WC cycle (ex-cash) (days)
127
116
100
80
80
Solvency ratios (x)
Net debt to equity
0.4
0.1
0.1
(0.1)
(0.2)
Net debt to EBITDA
1.4
0.3
0.3
(0.4)
(0.5)
Interest Coverage (EBIT / Interest)
5.2
9.4
34.0
25.6
24.4
February 14, 2017
9
Natco Pharma |4QFY2017 Result Update
Research Team Tel: 022 - 39357800
DISCLAIMER
Angel Broking Private Limited (hereinafter referred to as “Angel”) is a registered Member of National Stock Exchange of India Limited,
Bombay Stock Exchange Limited and Metropolitan Stock Exchange Limited. It is also registered as a Depository Participant with CDSL
and Portfolio Manager with SEBI. It also has registration with AMFI as a Mutual Fund Distributor. Angel Broking Private Limited is a
registered entity with SEBI for Research Analyst in terms of SEBI (Research Analyst) Regulations, 2014 vide registration number
INH000000164. Angel or its associates has not been debarred/ suspended by SEBI or any other regulatory authority for accessing
/dealing in securities Market. Angel or its associates/analyst has not received any compensation / managed or co-managed public
offering of securities of the company covered by Analyst during the past twelve months.
This document is solely for the personal information of the recipient, and must not be singularly used as the basis of any investment
decision. Nothing in this document should be construed as investment or financial advice. Each recipient of this document should
make such investigations as they deem necessary to arrive at an independent evaluation of an investment in the securities of the
companies referred to in this document (including the merits and risks involved), and should consult their own advisors to determine
the merits and risks of such an investment.
Reports based on technical and derivative analysis center on studying charts of a stock's price movement, outstanding positions and
trading volume, as opposed to focusing on a company's fundamentals and, as such, may not match with a report on a company's
fundamentals. Investors are advised to refer the Fundamental and Technical Research Reports available on our website to evaluate the
contrary view, if any.
The information in this document has been printed on the basis of publicly available information, internal data and other reliable
sources believed to be true, but we do not represent that it is accurate or complete and it should not be relied on as such, as this
document is for general guidance only. Angel Broking Pvt. Limited or any of its affiliates/ group companies shall not be in any way
responsible for any loss or damage that may arise to any person from any inadvertent error in the information contained in this report.
Angel Broking Pvt. Limited has not independently verified all the information contained within this document. Accordingly, we cannot
testify, nor make any representation or warranty, express or implied, to the accuracy, contents or data contained within this document.
While Angel Broking Pvt. Limited endeavors to update on a reasonable basis the information discussed in this material, there may be
regulatory, compliance, or other reasons that prevent us from doing so.
This document is being supplied to you solely for your information, and its contents, information or data may not be reproduced,
redistributed or passed on, directly or indirectly.
Neither Angel Broking Pvt. Limited, nor its directors, employees or affiliates shall be liable for any loss or damage that may arise from
or in connection with the use of this information.
Disclosure of Interest Statement
Natco Pharma
1. Financial interest of research analyst or Angel or his Associate or his relative
No
2. Ownership of 1% or more of the stock by research analyst or Angel or associates or relatives
No
3. Served as an officer, director or employee of the company covered under Research
No
4. Broking relationship with company covered under Research
No
Ratings (Based on expected returns
Buy (> 15%)
Accumulate (5% to 15%)
Neutral (-5 to 5%)
over 12 months investment period):
Reduce (-5% to -15%)
Sell (< -15)
February 14, 2017
10