Initiating Coverage | Auto Ancillary
July 21, 2015
Minda Industries
BUY
CMP
` 525
Outpacing industry on product & customer consolidation
Target Price
` 652
Minda Industries Ltd (MIL) is a diversified auto ancillary supplier, manufacturing
Investment Period
12 Months
products such as switches, horns, lights, fuel caps, and cylinder valves. It is the
market leader in the switch segment with a market share of 67%, and also the
horn segment where it has a market share of 47%.
Stock Info
Sector
Auto Ancillary
New product introductions and increased sourcing from clients
to enable company outpace the automotive industry
Market Cap (` cr)
833
MIL has historically outpaced the automotive industry growth by consistently
Net Debt (` cr)
180
introducing new high value products which enhance the kit value per vehicle. The
Beta
0.9
company has forged alliances with global technology players and has also taken
52 Week High / Low
655 / 283
the acquisition route to introduce high value products. Given its focus on
innovation and its varied product range, the company has gained access to new
Avg. Daily Volume
1,176
platforms of clients, thus enabling it to gain market share. Over the next two
Face Value (`)
10
years, MIL aims to introduce alloy wheels in JV with Kosei, launch electronic
BSE Sensex
28,182
horns, and manufacture batteries with Panasonic as its technology partner, in the
domestic market. This will enable it to further move up the value chain and
Nifty
8,529
enhance the content per vehicle to the customers. Also, MIL aims to enhance
Reuters Code
MINDA.BO
supplies to its existing clientele such as Hero Motocorp, Honda Motorcycles and
Bloomberg Code
MINDA@IN
Scooters India (HMSI) and Hyundai India by securing supply contracts for their
new platforms. We believe MIL is well poised to outgrow the automotive industry
and expect it to post a CAGR of 14% in revenue over FY2015-17.
Shareholding Pattern (%)
Subsidiaries’ turnaround and better capacity utilization to
Promoters
70.9
augment margins
MF / Banks / Indian Fls
11.0
MIL is aiming to enhance its subsidiaries’ profitability, which account for about
35% of the consolidated turnover. FY2015 marked a turnaround in its
FII / NRIs / OCBs
8.6
subsidiaries’ performance, with them reporting a profit of `5cr as against a loss
Indian Public / Others
9.5
of `19cr in FY2014. Going ahead, better capacity utilization coupled with
increased sourcing from low cost domestic units will help its key subsidiaries -
Clarton Horns and Minda Kyoraku - to post an improvement in margins. Similarly,
operating leverage on back of double digit top-line growth would also enhance overall
Abs. (%)
3m 1yr 3yr
margins. We estimate MIL’s margins to improve by 140bp over the next two years.
Sensex
1.8
9.6
64.2
Outlook and valuation: MIL has evolved from being a switch player to an
Minda
(5.1)
52.2
224.1
ancillary supplier having a diverse product range viz switches, horns, lightings,
fuel caps, and cylinder valves. The company is aiming to further enhance the
product range and move up the value chain by introducing new products like
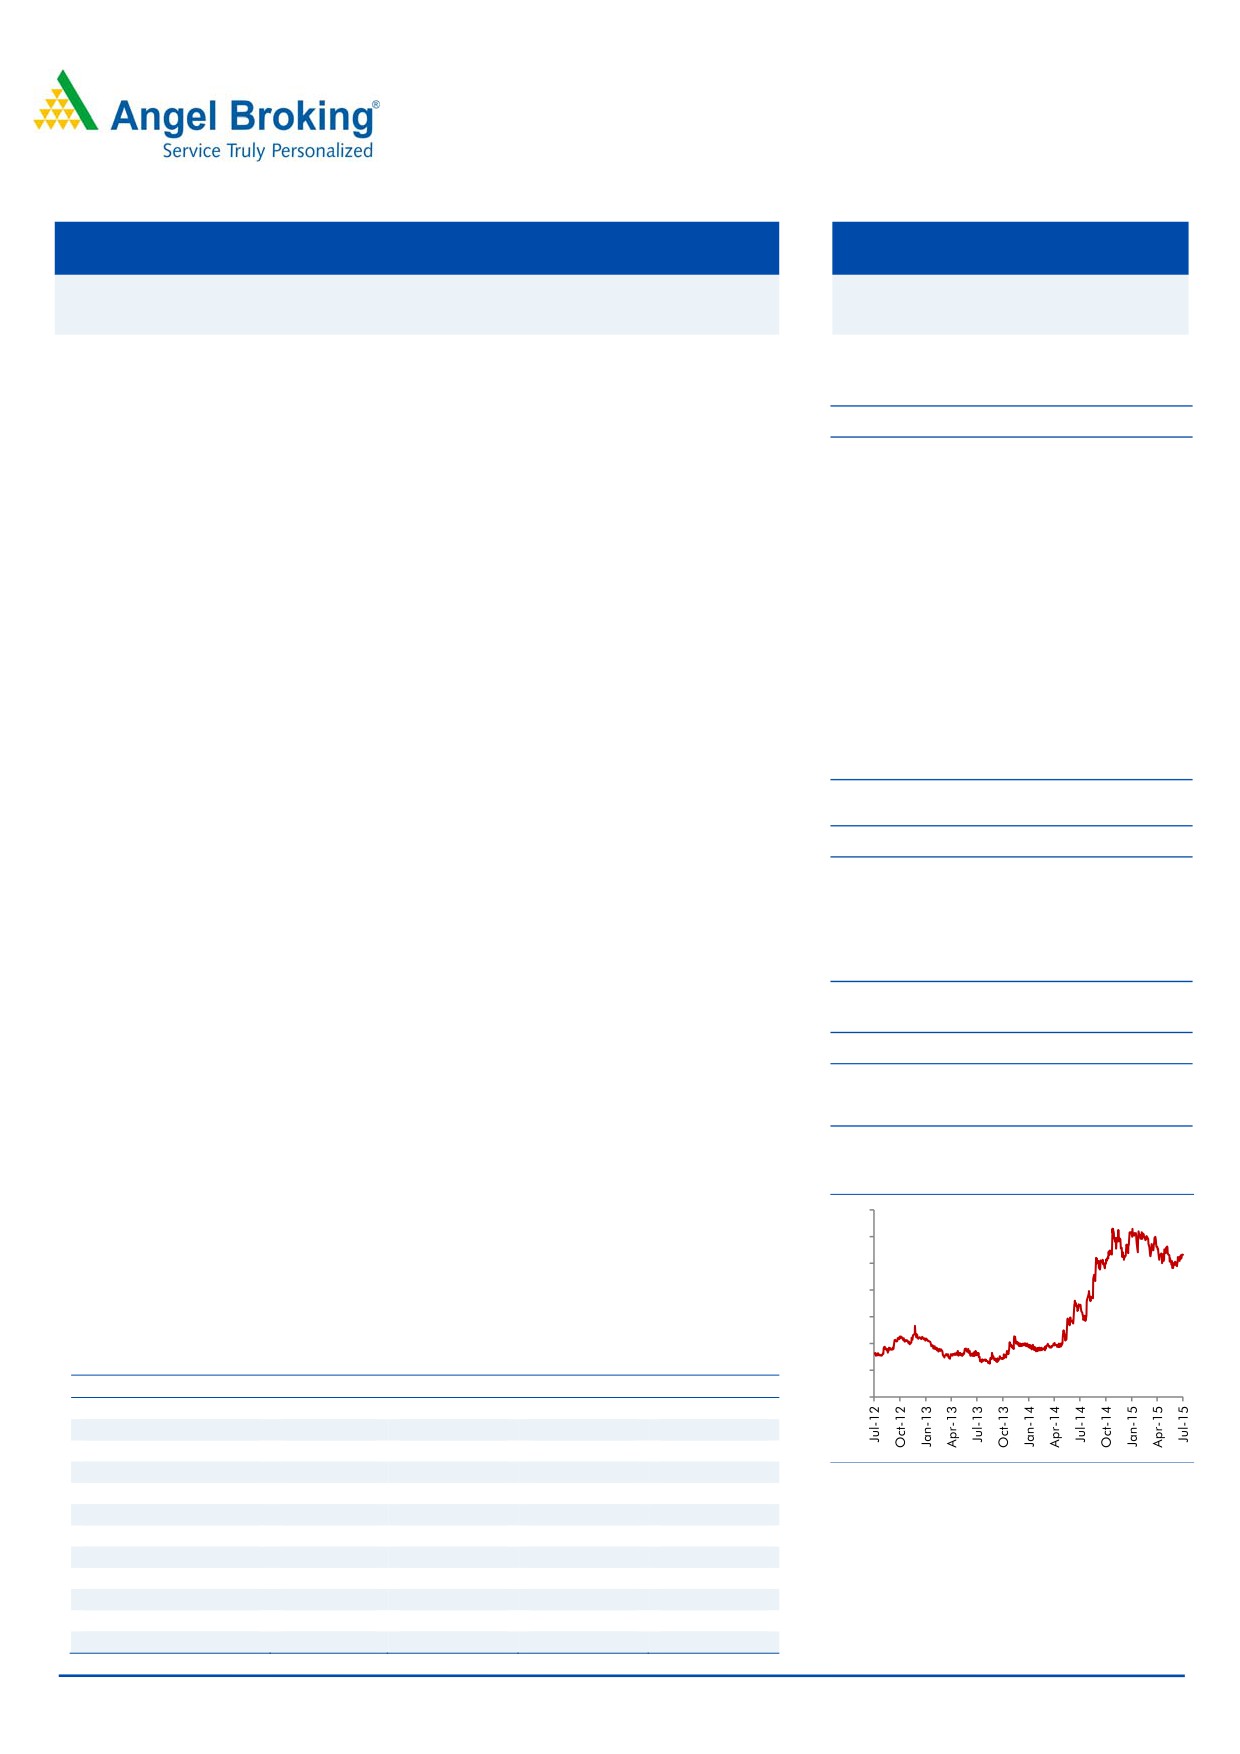
3-Year Daily price chart
alloy wheels and electronic horns. We expect MIL to clock a robust 14% top-line
700
growth over the next two years. Further, operating leverage and improvement
600
in margin of subsidiaries would lead to a CAGR of 25% in earnings over
500
FY2015-17. MIL is a well diversified Tier 1 ancillary player, available at an
400
attractive valuation. We initiate coverage on the stock with a Buy recommendation
300
and target price of `652 (based on 12x FY2017 earnings).
200
Key financials
100
Y/E March (` cr)
FY2014
FY2015E
FY2016E
FY2017E
0
Net sales
1,706
2,227
2,500
2,889
% chg
27.3
30.5
12.3
15.5
Net profit (Adj.)
6
56
62
86
% chg
(77.0)
762.9
12.5
38.0
Source: Company, Angel Research
EBITDA margin (%)
4.6
6.9
7.6
8.3
EPS (`)
4.1
35.0
39.4
54.3
P/E (x)
129.4
15.0
13.3
9.7
P/BV (x)
2.7
2.2
1.9
1.6
RoE (%)
2.1
14.6
14.1
16.3
RoCE (%)
5.7
14.7
15.0
18.4
Bharat Gianani
EV/Sales (x)
0.6
0.5
0.4
0.4
022-39357800 Ext: 6817
EV/EBITDA (x)
13.9
6.6
5.7
4.3
Source: Company, Angel Research
Please refer to important disclosures at the end of this report
1
Minda Industries | Initiating Coverage
Investment Arguments
Diversified product profile with leadership position in switches
and horns
Over the years, MIL has successfully evolved from being a switch player to an auto
ancillary supplier dealing in multiple products. Today, MIL manufactures a broad
array of products viz switches, horns, lighting equipments and a host of other
products viz blow moulds, die casts, fuel caps and alternative fuel kits. The
company has forged technical agreements with global majors and has also made
acquisitions in order to enhance its product offerings.
MIL is the market leader in the switch segment, commanding a share of 67%.
Further, with the acquisition of Clarton Horns, MIL has emerged as the second
largest horn player globally and leader in the domestic market with a share of
47%. MIL’s revenue mix is pretty diversified with switch and horn segments
contributing 40% and 27%, respectively, to overall revenues. The lighting segment
and others segments (comprising of blow moulds, die casts and fuel caps) account
for 19% and 14% of revenues, respectively. MIL has successfully leveraged its
strong OEM relationship to continuously broaden its product profile, thereby
enabling it to improve the kit value per vehicle. Further, MIL has manufacturing
presence in all the major automotive hubs across Northern, Western and Southern
regions of the country, which facilitates close proximity to the customers.
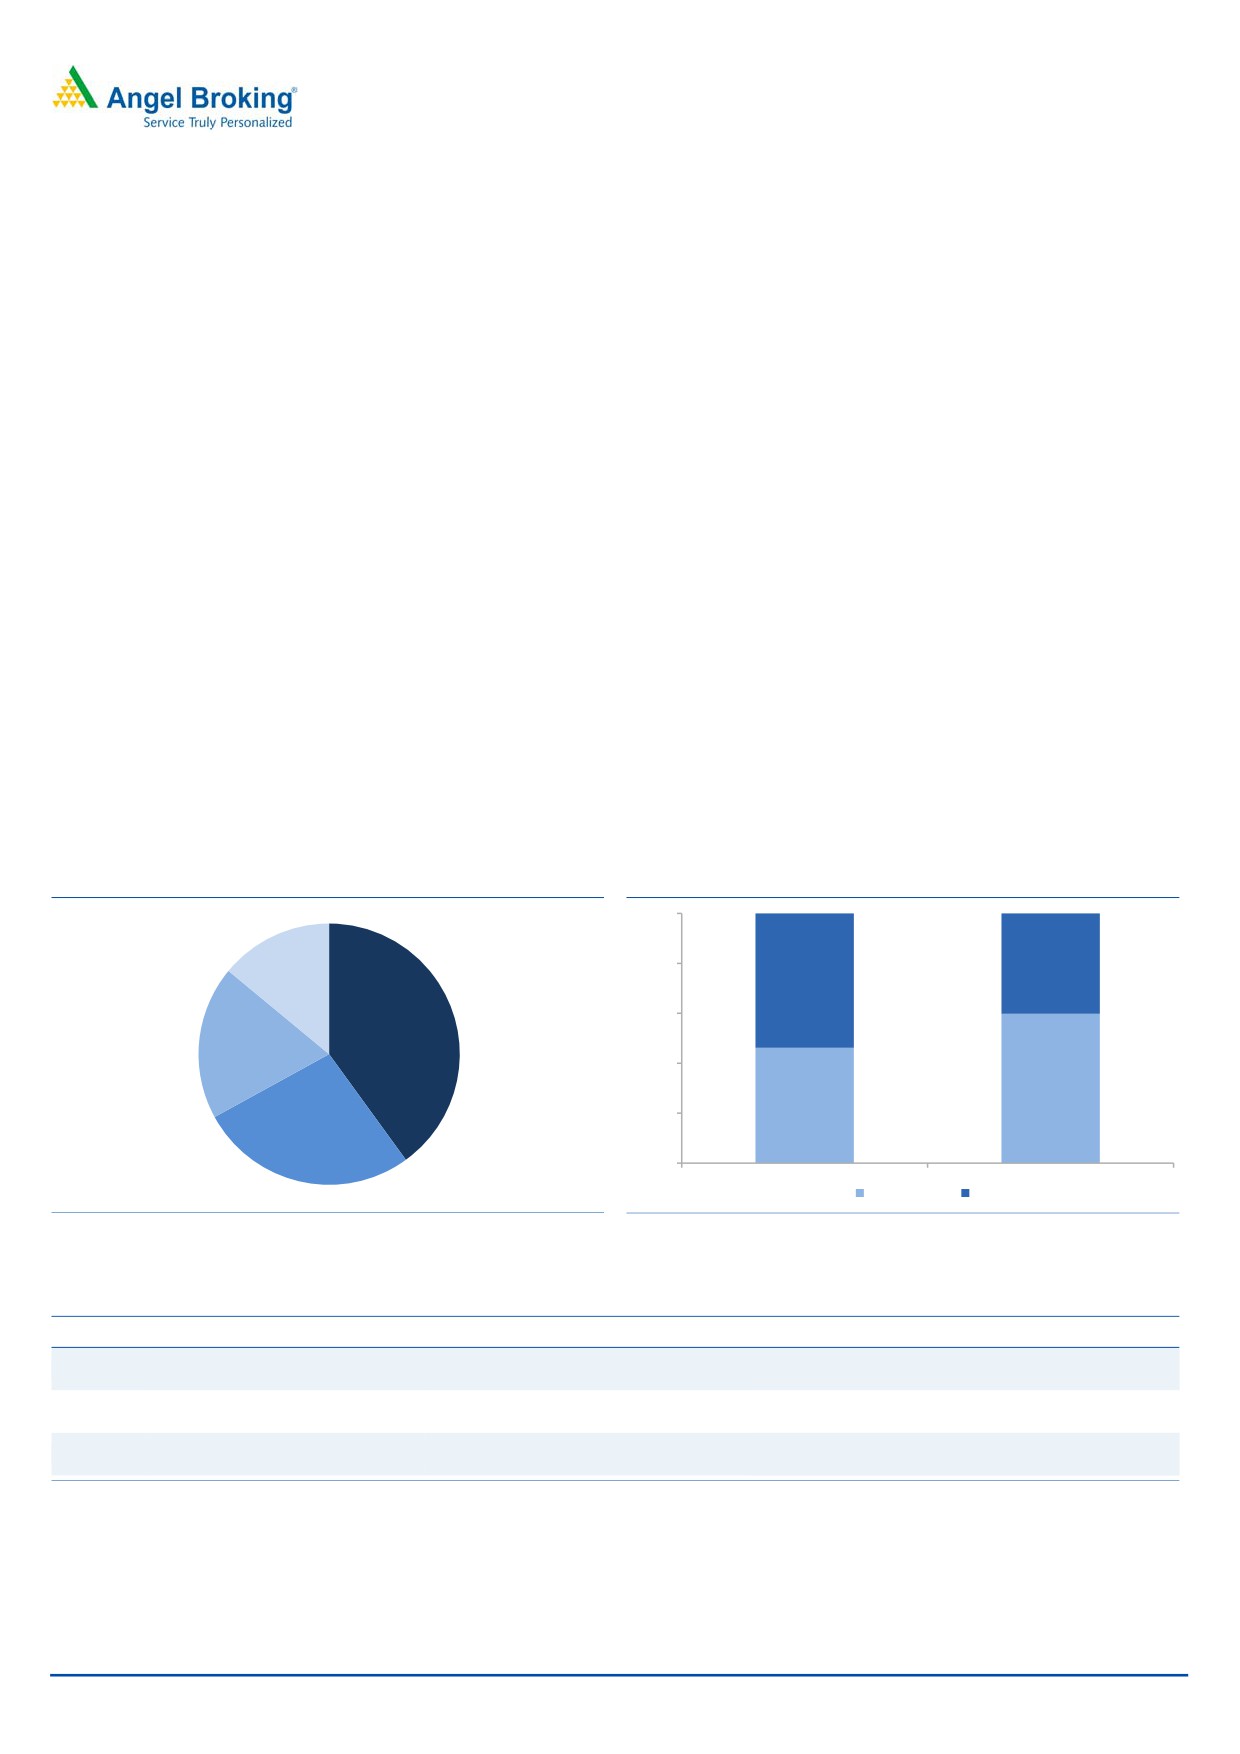
Exhibit 1: Segmentwise breakup (Consolidated)
Exhibit 2: Categorywise breakup
100%
40%
80%
Others, 14%
54%
60%
Switches, 40%
Lighting, 19%
40%
60%
46%
20%
Horns, 27%
0%
FY11
FY15
Non switch
Switch
Source: Company, Angel Research
Source: Company, Angel Research
Exhibit 3: Manufacturing footprint
Zone
Location
2W client
4W client
Haridwar, Pantnagar, Manesar,
Hero Motocorp, Honda Motorcycles
Maruti Suzuki, M&M, Tata Motors, Honda India,
Northern
Sonepat, Bawal
& Scooters India , Yamaha India
Eicher, Swaraj Mazda, Escorts, Swaraj Mazda
Volkswagen India, Tata Motors, M&M,
Western
Pune, Aurangabad
Bajaj Auto
General Motors, Fiat
Nissan, Renault, Hyundai India, Ford, Tata Motors,
Southern
Bangalore, Hosur, Chennai
TVS Motors, Royal Enfield
Toyota, Tata Motors, Ashok Leyland
Source: Company, Angel Research
July 21, 2015
2
Minda Industries | Initiating Coverage
Exhibit 4: MIL milestones
Foundation of UNO MINDA, NK
Blow Molding Manufacturing Starts in
1958
Minda Group
2008
Bangalore
Started with Ammeter Manufacturing
Design & Development of Alt Fuel Kits
Manufacturing of Automotive Switches
2009
1960
Die Casting Mfg
Manufacturing of Automotive Lighting
2010
1980
Products
Blow Molding Manufacturing starts in
2011
Bawal
Started Horn Manufacturing
Started production of Wheel Cover
1993
Manufacturing of Automotive 4 W
Started production of Fuel Cap
1995
Switches and Heater Control Panels
2012
Acquisition of Clarton Horns, Spain
Switch Manufacturing in Pune
2013
Incorporation of Trading Company in
2001
Kit Integration of CNG/LPG Kits
Brazil
Set Up of Manufacturing facility in
Entered into JV with Panasonic for
2005
Indonesia
2014
battery division
Started Battery Manufacturing
Entered into JV with Kosei Group for
2007
2015
Alloy Wheel
1958-2007
2008-2015
Source: Company, Angel Research
New product introductions help company to outpace industry
New product introductions have enabled MIL to consistently outgrow the
automotive industry. During FY2007-FY2015, the automotive industry has grown
at a CAGR of 10% while MIL’s revenues have grown at a CAGR of 25% over the
same period. MIL has focused on moving up the value chain and has evolved from
being a switch supplier. Over the last few years, it has introduced high value and
high margin products such as head lamps, tail lamps and brake lights within the
lighting division. With the acquisition of Clarton Horns, MIL has acquired the
business of high value electronic horning systems (Clarton Horns supplies to luxury
car makers - Mercedes, BMW, Porsche, Bentley). Also, MIL introduced fuel caps
and cylinder valves in its product portfolio, which further enrich its profile.
Technology and innovation are at the forefront of the company’s strategy. MIL
currently has 95 patented products which has led to it emerging as a leading
diversified ancillary player. MIL has successfully leveraged its strong OEM
relationship to supply new products and enhance the kit per vehicle. In order to
maintain the outperformance, MIL would be venturing into manufacturing alloy
wheels in joint venture with Kosei; it has already secured orders from Maruti and
M&M. The production is expected to commence in 2HFY2017 and is expected to
boost the top-line. Further, MIL has also entered into a technological agreement
July 21, 2015
3
Minda Industries | Initiating Coverage
with Panasonic, Japan for manufacture of automotive batteries. Batteries would be
sold to the existing clients and the production is likely to commence in 2QFY2016.
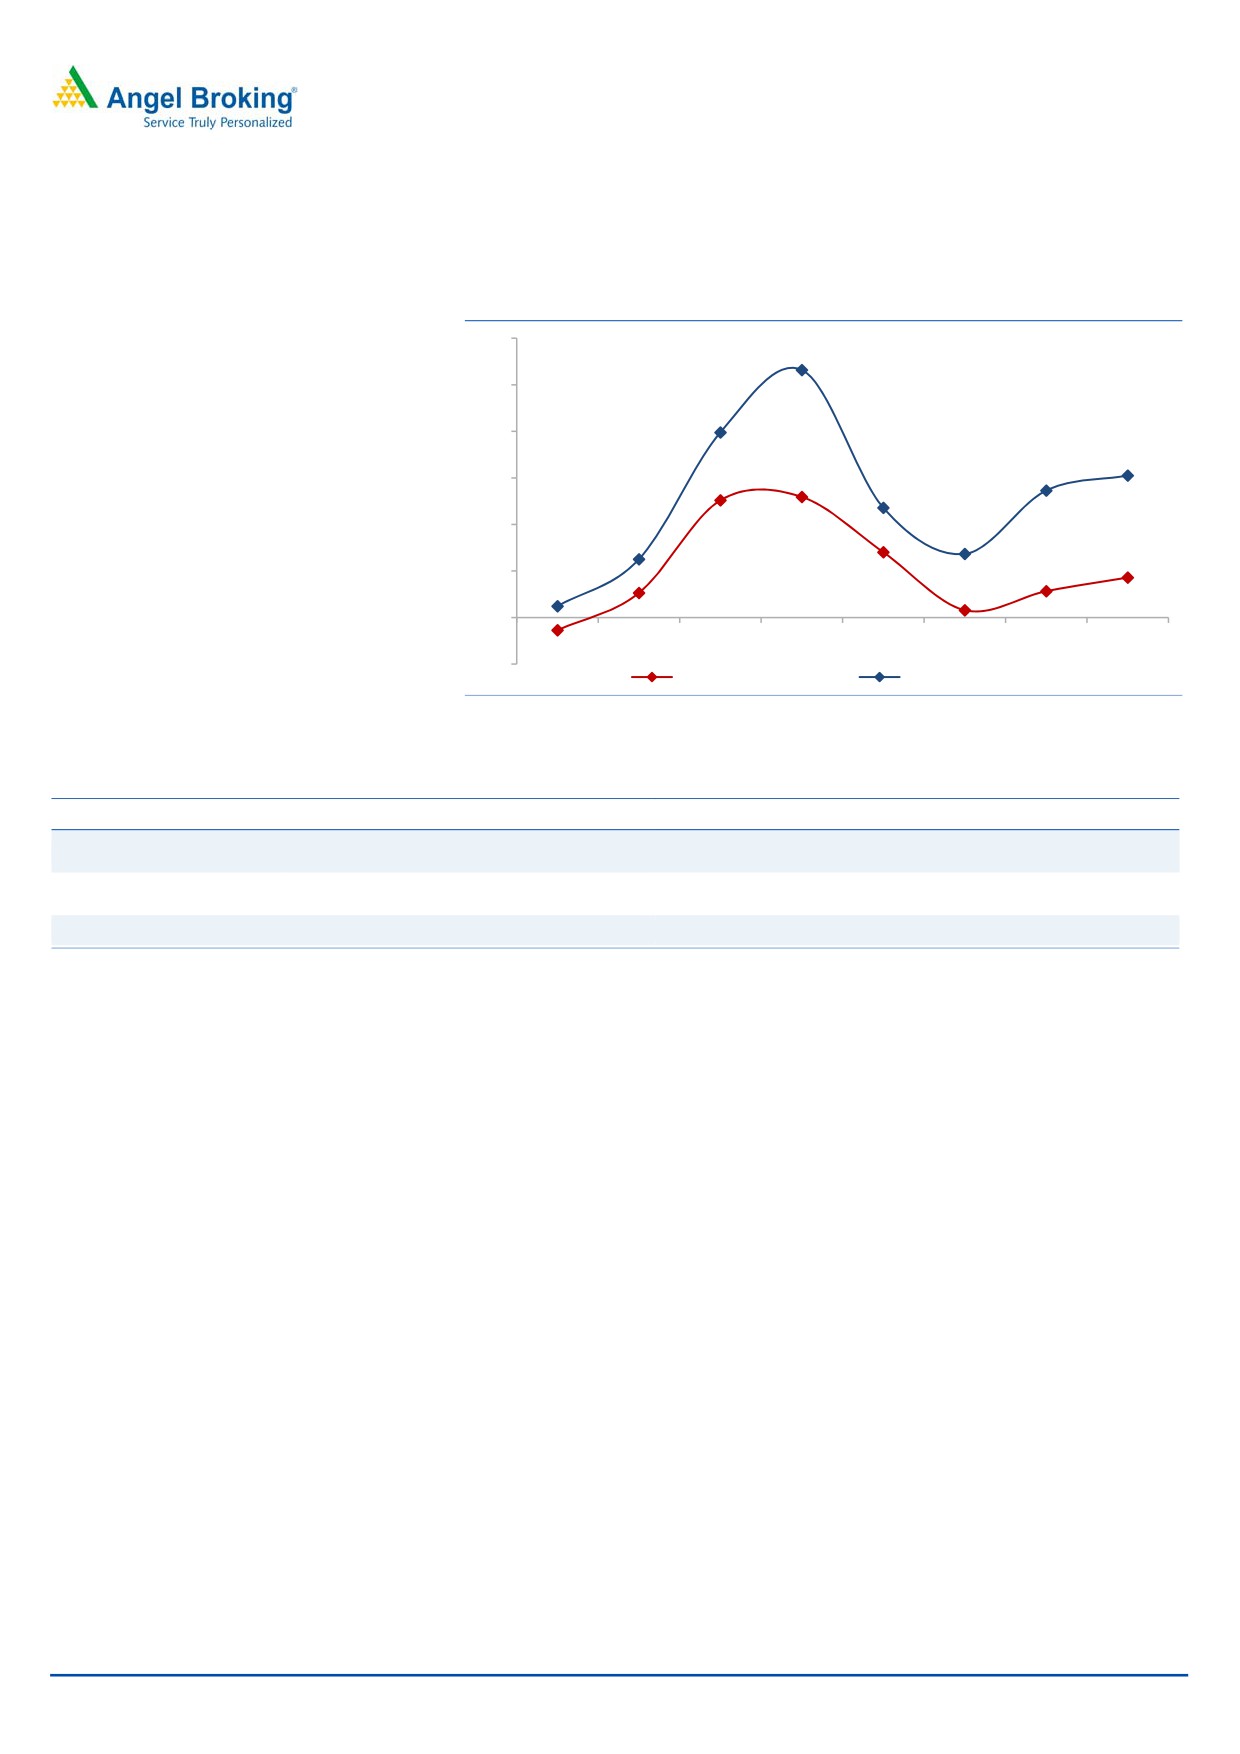
Exhibit 5: MIL has historically outpaced automotive industry
60
50
40
30
20
10
0
FY08
FY09
FY10
FY11
FY12
FY13
FY14
FY15
(10)
Auto industry growth
Minda Industries growth
Source: Company, Angel Research
Exhibit 6: New products planned
Product
Technology Partner
Prospective clientele
All 4W customers. Has already received confirmed orders
Alloy wheels
Kosei, Japan
from Maruti Suzuki and M&M
All 4W customers. Has already commenced supplies
Electronic Horns
Acquired post Clarton acquisition
to Hyundai India
Battery
Panasonic, Japan
All 2W and 4W customers
Source: Company, Angel Research
July 21, 2015
4
Minda Industries | Initiating Coverage
Increased supplies to customers and new customer acquisitions
drive growth
MIL has been successful in penetrating new platforms of its customers. Product
innovation coupled with broader product offerings has enabled MIL to increase its
share of supplies. OEM players are looking for vendor consolidation which bodes
well for suppliers like MIL who are constantly adding new high value products to
their portfolios. Further, MIL also follows the acquisition route in order to gain
access to new customers.
Post the split of Hero Honda, MIL has increased supplies to both Hero Motocorp as
well as Honda Motorcycles and Scooters India. Hero as well as HMSI currently
contribute about 4% of MIL’s standalone revenues as compared to less than 1% in
FY2010. Further, post the acquisition of Clarton Horns, MIL has now gained
access to new premium OEMs such as Mercedes, BMW, Porsche and Bentley. MIL
has also commenced horn supplies to Hyundai India post the Clarton Horns
acquisition. Also the proposed merger of Indonesia based PT Minda Asean
Automotive and Vietnam based SAM Global PTE would enable MIL to tap new
platforms of premium Japanese two-wheeler customers namely Yamaha, Suzuki
and Kawasaki.
Exhibit 7: Customer contribution
Customers
% of stdl rev FY11
% of stdl rev FY15
Honda Motorcycles & Scooters India
less than 1%
10%
Hero Motocorp
less than 1%
4%
M&M
2%
4%
Royal Enfield
less than 1%
4%
Source: Company, Angel Research
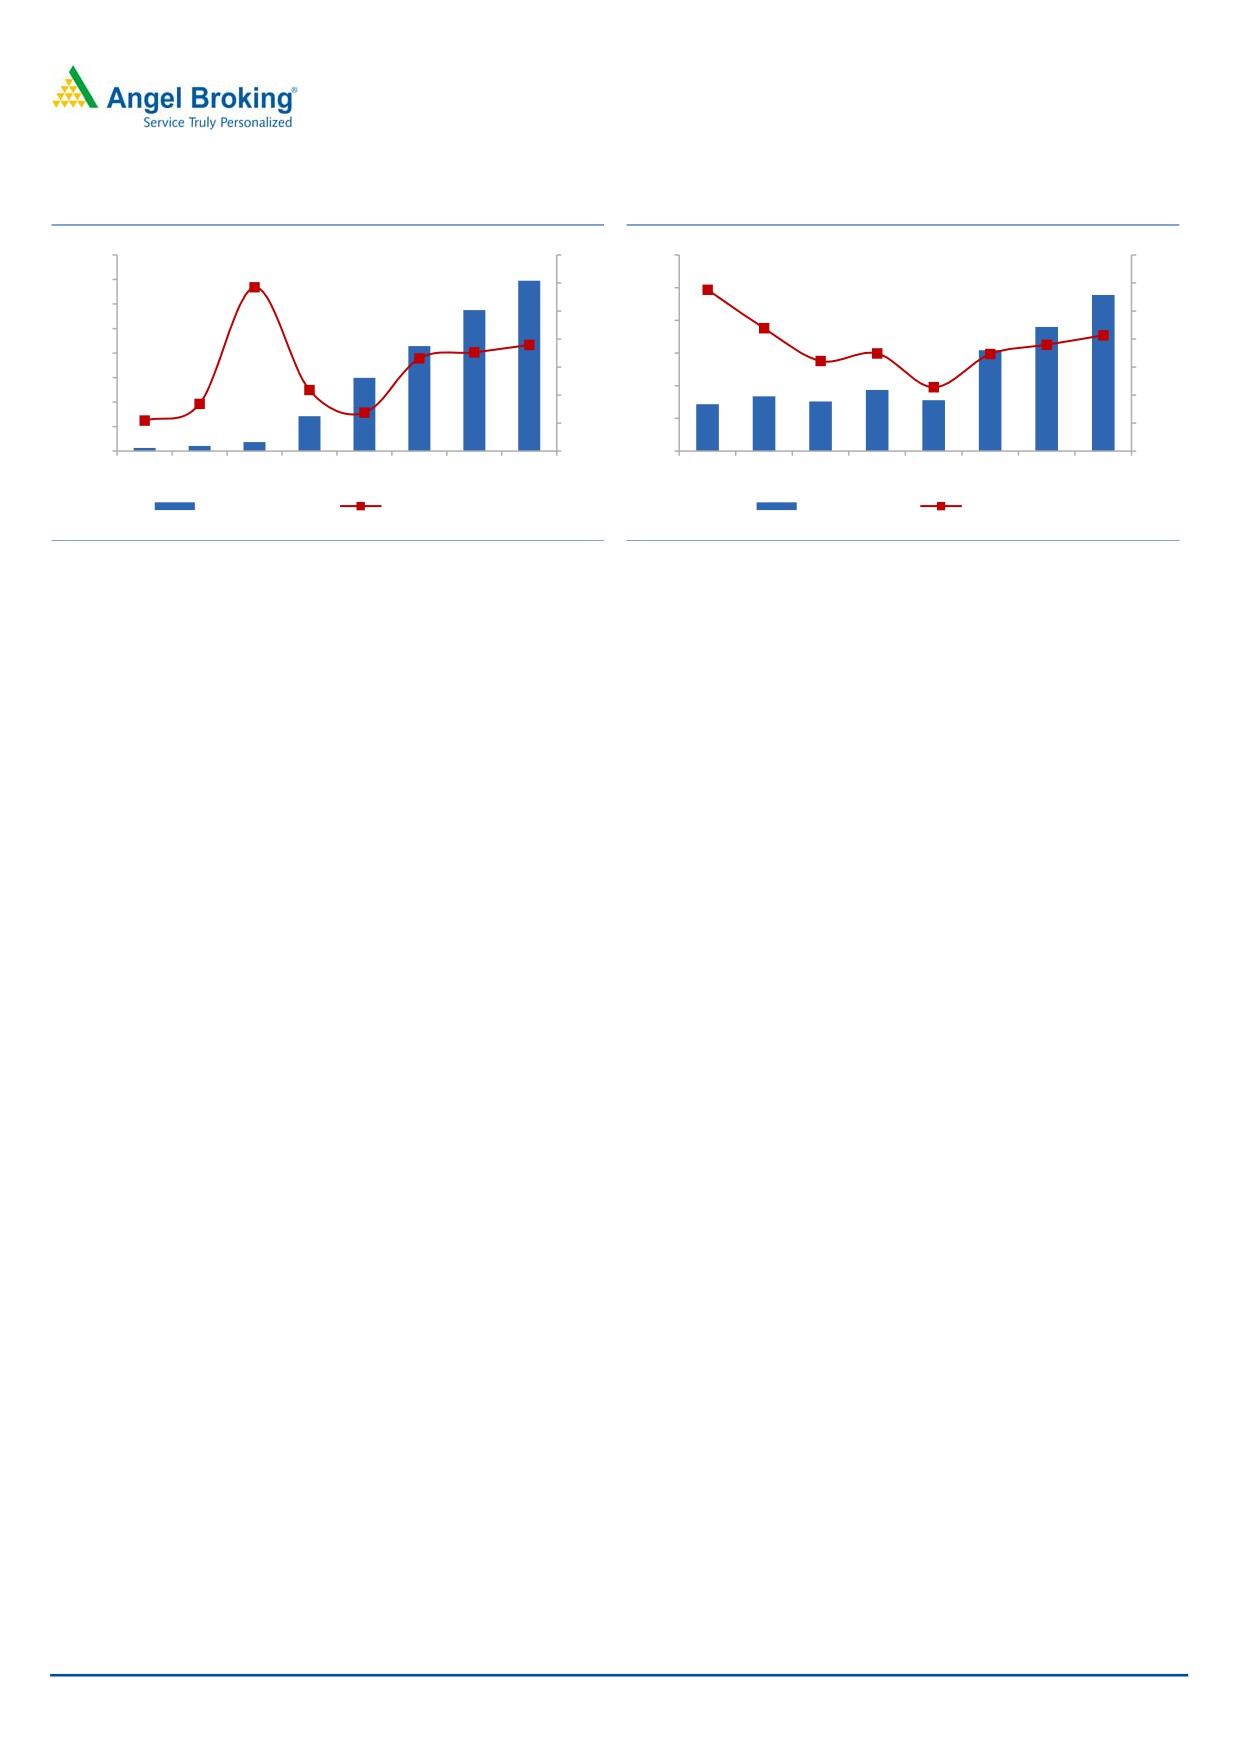
Subsidiaries’ margin improvement coupled with better capacity
utilization to improve margins
MIL’s subsidiaries witnessed a marked improvement in their profitability in FY2015.
After posting cumulative losses of `19.6cr in FY2014, the subsidiaries contributed
`5cr to profits in FY2015. The subsidiaries contribute by about 35% to the
consolidated revenues of MIL. The company’s Spain based subsidiary turned
around in FY2015, reporting a PBT of `1.8cr as compared to a loss of `11.4cr in
the previous year. Similarly other subsidiaries, MJ Casting (die casting
manufacturer) and Minda Kyoraku (makes blow mould products) reported reduced
losses during the year.
MIL is focusing on further improvement in margins of its subsidiaries. MIL
subsidiary Clarton aims to source parts from the Indian plants. Low cost domestic
manufacturing would reduce the costs for Clarton Horns, resulting in margin
improvement. Also, its other subsidiaries Minda Kyoraku and MJ Casting, are
estimated to turnaround in FY2016 on account of operating leverage and cost
control initiatives. Improving capacity utilization in new facilities at Hosur (for switch
segment) and Manesar (for lighting segment) would further enhance the
profitability of MIL. On back of better capacity utilization due to recovery in the
automotive segment, and operating leverage, MIL is targeting double-digit margin
over the next two to three years as against current margins of 7%. We estimate
MIL’s margins to improve from 6.9% in FY2015 to 8.3% in FY2017.
July 21, 2015
5
Minda Industries | Initiating Coverage
Exhibit 8: Subsidiaries financial performance
Exhibit 9: EBIDTA Margin trend
1,600
8
300
14
1,400
6
12
250
1,200
4
10
200
1,000
2
8
800
150
0
6
600
100
(2)
4
400
50
200
(4)
2
0
(6)
0
0
FY10
FY11
FY12
FY13
FY14
FY15
FY16E FY17E
FY10
FY11
FY12
FY13
FY14
FY15
FY16E FY17E
Revenues (` cr)
PAT Margins (%)
EBIDTA (` cr)
Margins (%)
Source: Company, Angel Research
Source: Company, Angel Research
July 21, 2015
6
Minda Industries | Initiating Coverage
Outlook and Valuation
MIL has evolved from being a switch player to an ancillary supplier having a
diverse product range viz switches, horns, lightings, fuel caps, and cylinder valves.
The company is aiming to further enhance the product range and move up the
value chain by introducing new products like alloy wheels and electronic horns. We
expect MIL to clock a robust 14% top-line growth over the next two years.
Further, operating leverage and improvement in margin of subsidiaries would lead
to a CAGR of 25% in earnings over FY2015-17. MIL is a well diversified Tier 1
ancillary player, available at an attractive valuation. We initiate coverage on the
stock with a Buy recommendation and target price of `652 (based on 12x FY2017
earnings).
Exhibit 10: One-year forward P/E band
1,000
800
600
400
200
0
Price (`)
4x
8x
12x
16x
20x
Source: Company, Angel Research
Company Background
Minda Industries Ltd (MIL) is the flagship company of the Uno Minda Group. Uno
Minda is a leading Tier 1 supplier of Proprietary Automotive Solutions to OEMs
having 37 manufacturing plants spread across India, Indonesia, Vietnam & Spain.
Further it has design centers in Taiwan and Japan, and sales offices in USA,
Europe and Vietnam. The Uno Minda Group has a diversified product portfolio
which includes switches, handle bar assemblies, electronics & sensors, automotive
lamps, automotive horns, alternate fuel systems and CNG-LPG kits, automotive
batteries, blow molding components, seat belts, alloy wheels, wheel covers, air
filtration systems, die casting components, src, cylinders, fuel caps, body sealing,
car infotainment systems, air brakes, clutch actuation systems and automatic gear
shifters. Innovation is the key thrust area for the group and it currently holds 95
registered patents and 127 design registrations.
MIL has a well diversified portfolio with 40% of the revenues accruing from the
switch division. The horn segment is the second largest contributor accounting for
27% of the revenues. The lighting segment constitutes about 19% of the revenues
while the other segment (consisting of fuel caps, CNG kits and batteries) forms
about 14% of the top-line.
July 21, 2015
7
Minda Industries | Initiating Coverage
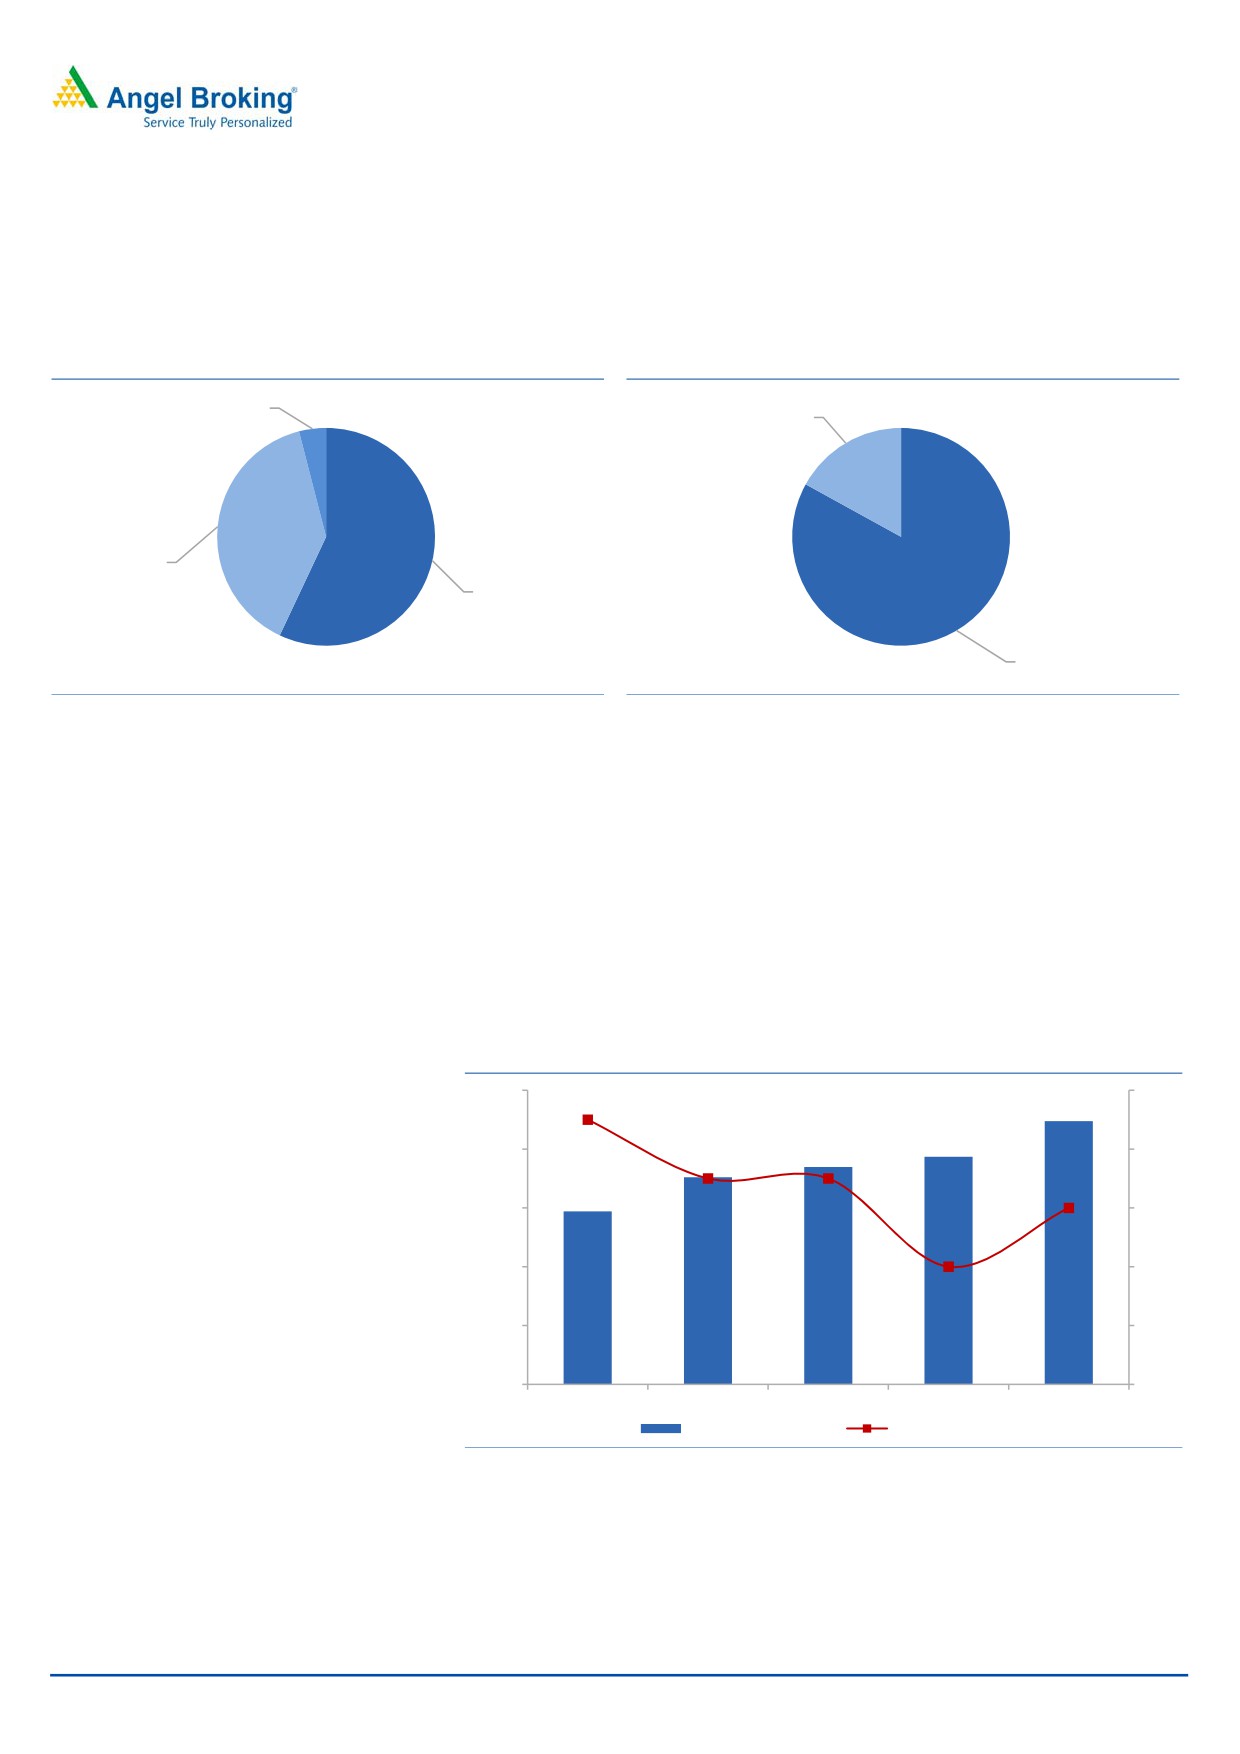
The two-wheeler segment contributes the bulk of the revenues (approximately 57%)
for MIL. Passenger car is the next big segment constituting 39% of the top-line.
MIL’s supplies are largely OEM driven, which form 83% of sales, while the rest is
contributed by the replacement segment.
Exhibit 11: Segmentwise breakup
Exhibit 12: Categorywise breakup
Others, 4%
Aftermarket,
17%
Passenger
cars, 39%
Two wheelers,
57%
OEM , 83%
Source: Company, Angel Research
Source: Company, Angel Research
Business segment information
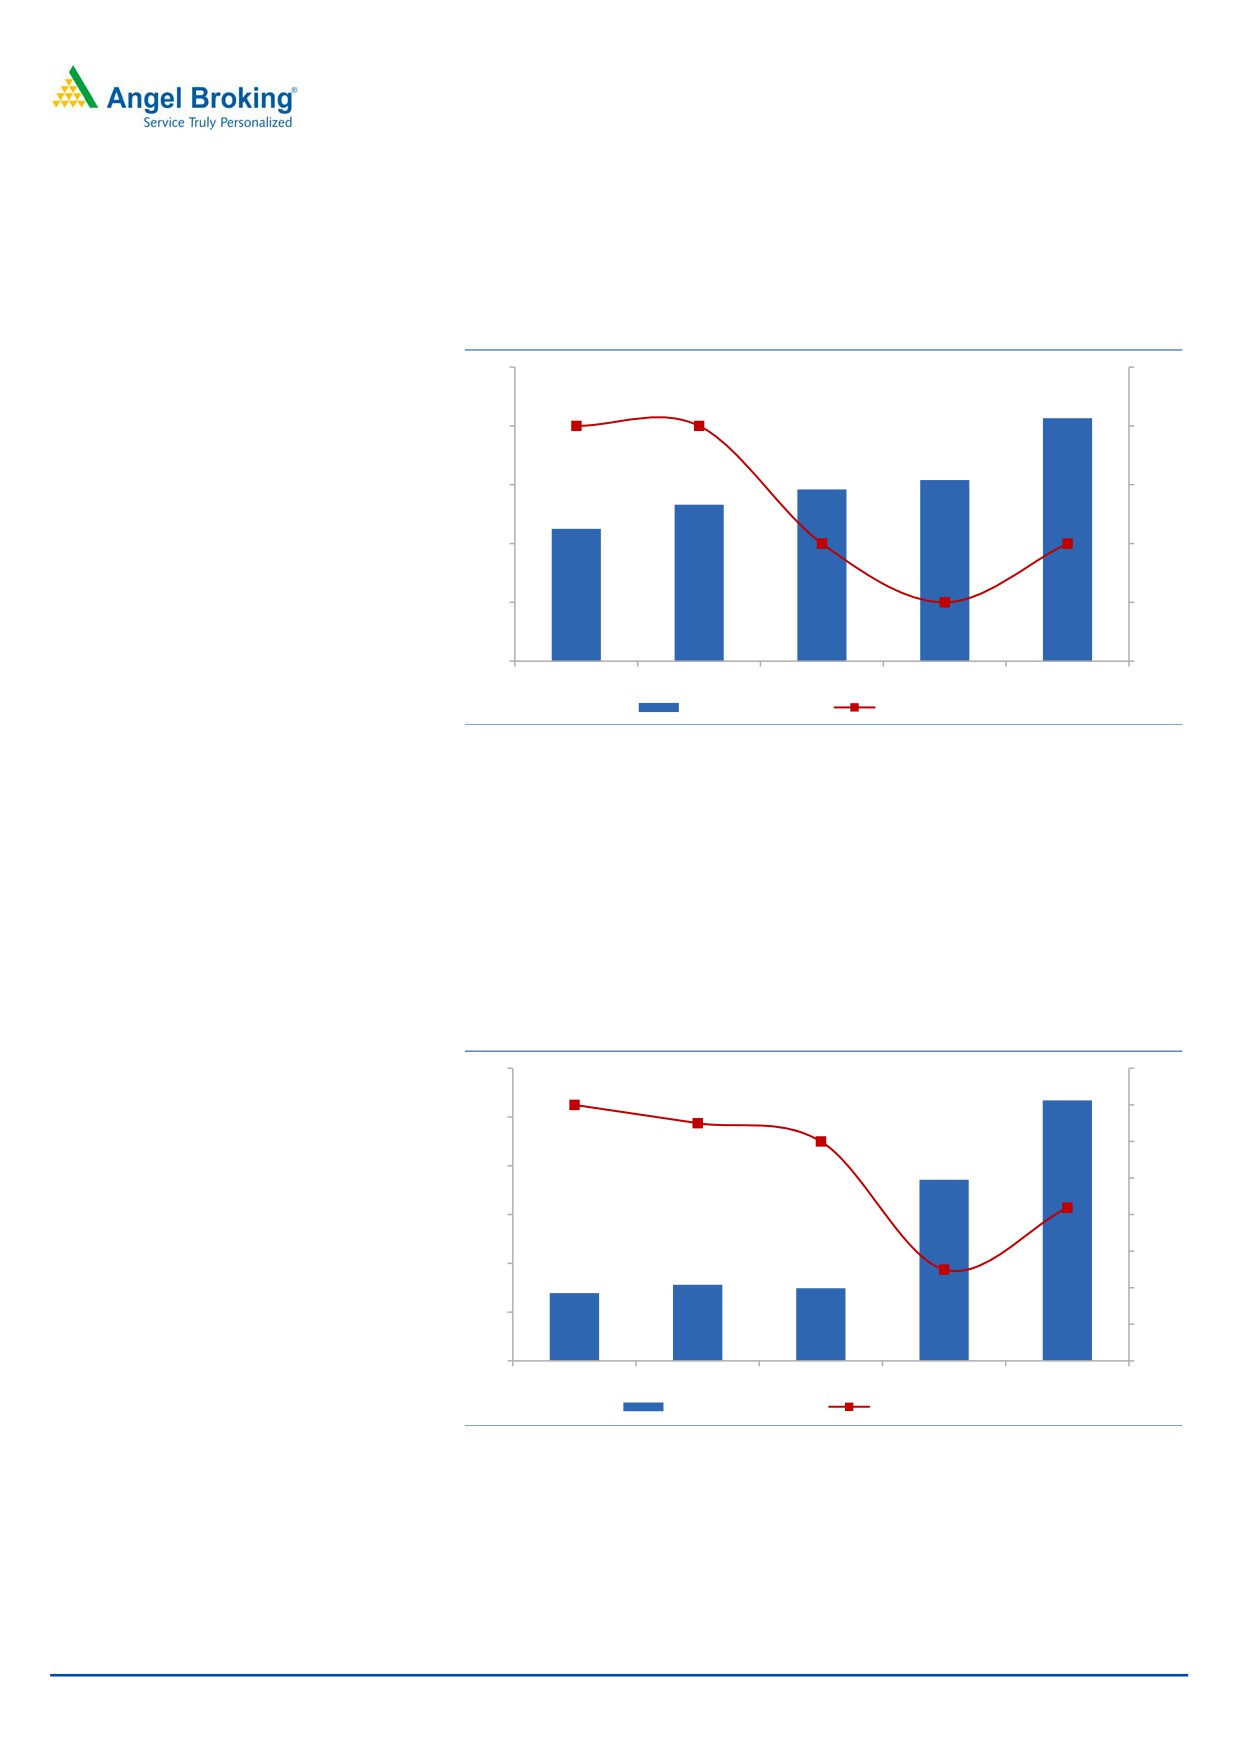
Switch segment
Switch is the oldest and the largest segment for MIL. MIL is the market leader in
switches commanding a market share of 67%. The segment reported a CAGR of
11% over FY2011-FY2015. Switches are supplied to two-wheeler customers.
Within the switch segment, Bajaj Auto is the largest client contributing about 46%
of revenues. HMSI, TVS Motor and Hero Motocorp contribute 11%, 10% and 6% of
revenues, respectively.
Exhibit 13: Switch division revenue and margin trend
1,000
14%
800
12%
600
10%
400
8%
200
6%
0
4%
FY11
FY12
FY13
FY14
FY15
Revenues (` cr)
EBIDTA Margin (%)
Source: Company, Angel Research
Lighting segment
Lighting division forms 19% of MIL’s top-line. The segment reported a CAGR of
16% over FY2011-FY2015. The 4W segment is the biggest customer for lighting
(contributes 85% of revenues). Within the lighting divison, Maruti Suzuki is the
July 21, 2015
8
Minda Industries | Initiating Coverage
largest client contributing about 37% of sales. M&M and Volkswagen India form
about 12% and 9% of sales, respectively. HMSI and Royal Enfield form 6% and 5%
of sales, respectively.
Exhibit 14: Lighting division revenue and margin trend
500
14%
400
12%
300
10%
200
8%
100
6%
0
4%
FY11
FY12
FY13
FY14
FY15
Revenues (` cr)
EBIDTA Margin (%)
Source: Company, Angel Research
Horns segment
The division currently contributes about 27% of the revenues of MIL. MIL is the
largest Indian horn manufacturing company with a 47% market share. Horn
segment revenues have leapfrogged post the acquisition of Clarton Horns, Spain.
Top-line has grown from `140cr in FY2011 to about `534cr in FY2015. 4W
customers contribute bulk of the revenues (83%) of the division.
Exhibit 15: Horn divison revenue and margin trend
600
16%
14%
500
12%
400
10%
300
8%
6%
200
4%
100
2%
0
0%
FY11
FY12
FY13
FY14
FY15
Revenues (` cr)
EBIDTA Margin (%)
Source: Company, Angel Research
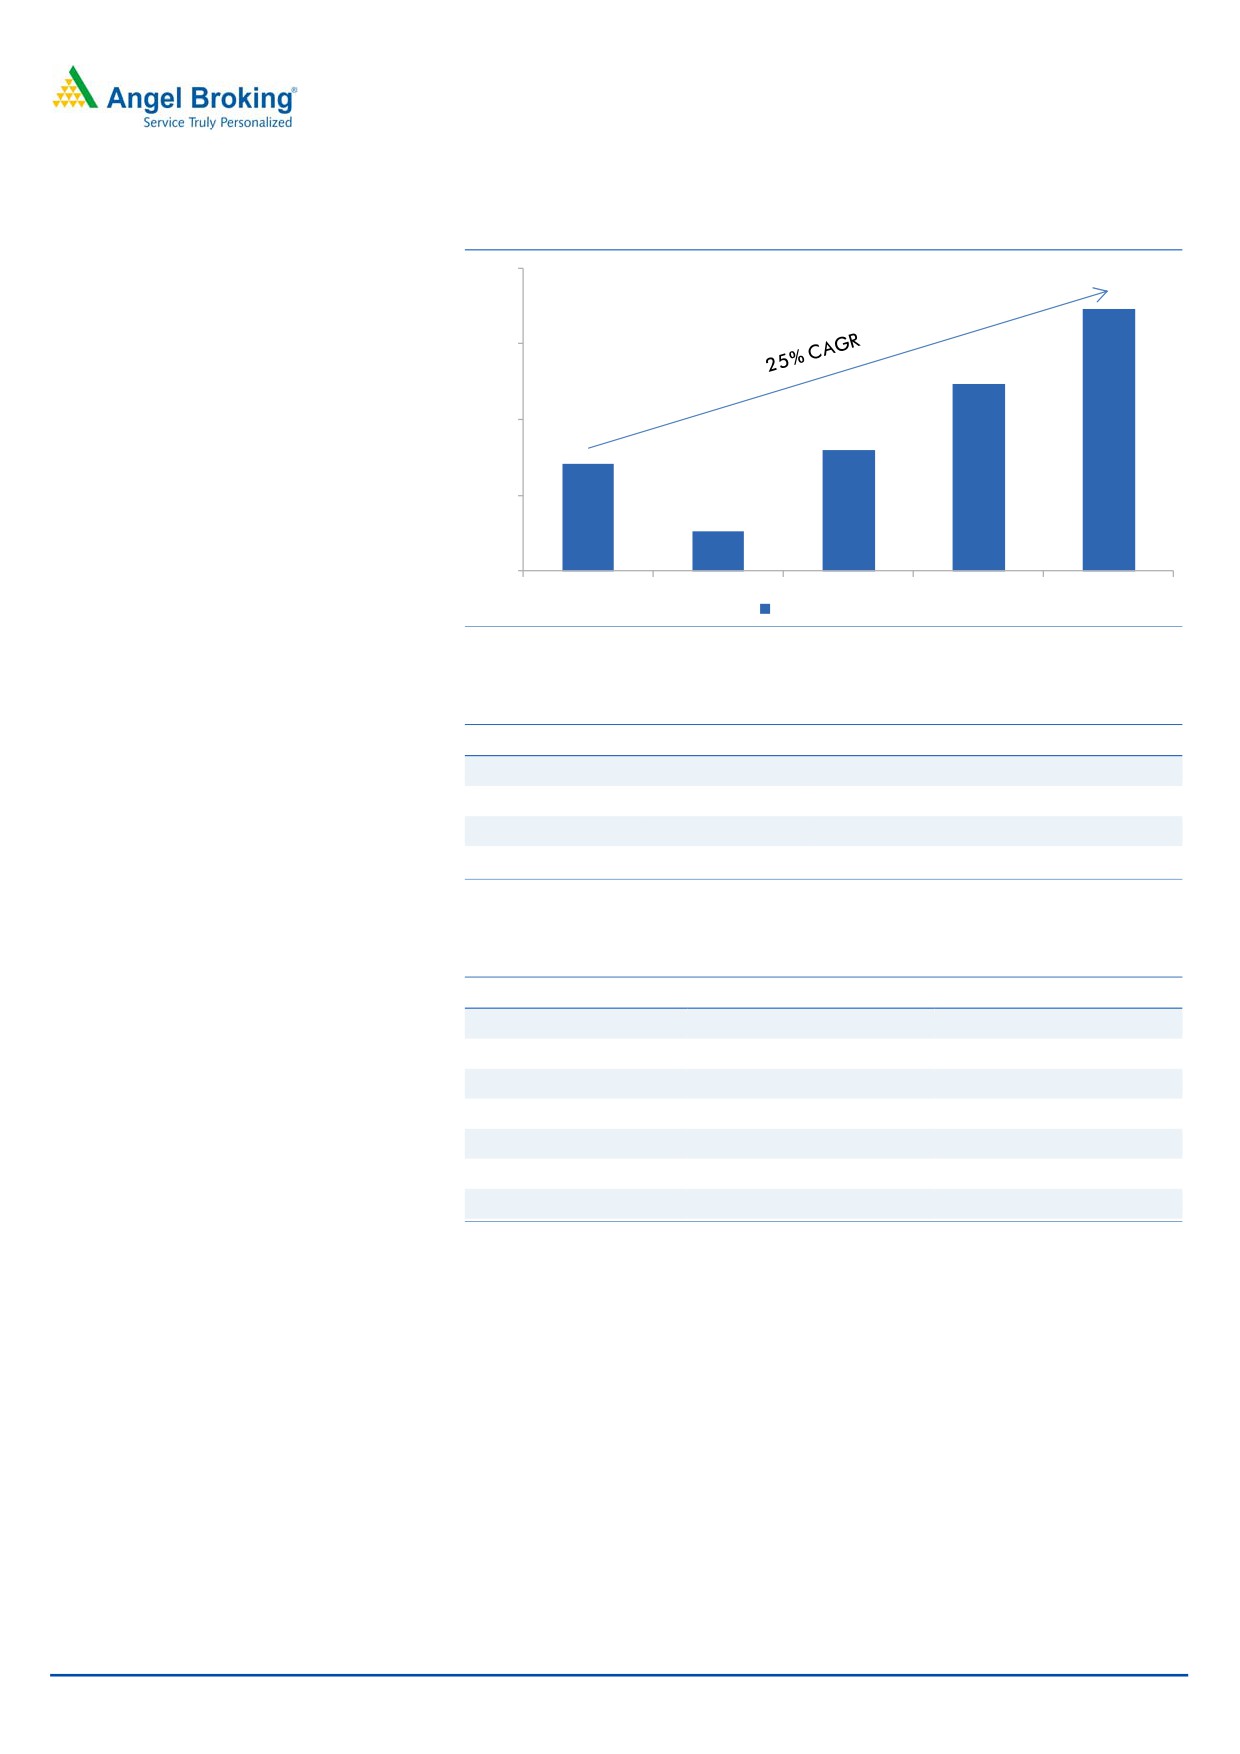
Others
Other products of MIL include fuel caps, blow moulds, die casting, CNG/LPG kits
and automotive batteries. The division has clocked robust CAGR of 25% over the
last four years. 4W and 2W players contribute equally to the division’s revenues.
July 21, 2015
9
Minda Industries | Initiating Coverage
Exhibit 16: Other segment growth trend
400
300
200
100
0
FY11
FY12
FY13
FY14
FY15
Revenues (` cr)
Source: Company, Angel Research
Exhibit 17: Divisionwise break-up
Segment
% of consol rev
Key clientile
Switch
40%
Bajaj Auto, HMSI, TVS Motors
Lighting
19%
Maruti Suzuki, M&M, Volkswagen India
Horns
27%
Bajaj Auto, FIAMM, HMSI
Others
14%
Source: Company, Angel Research
Exhibit 18: Clientwise break-up
OEM mix
% of cons rev FY11
% of cons rev FY15
Bajaj Auto
35%
20%
Maruti Suzuki
12%
6%
TVS Motors
7%
5%
M&M
2%
2%
HMSI
less than1%
6%
Royal Enfield
less than1%
2%
Hero Motocorp
less than1%
2%
Source: Company, Angel Research
July 21, 2015
10
Minda Industries | Initiating Coverage
Profit & Loss Statement
Y/E March (` cr)
FY2012
FY2013
FY2014
FY2015
FY2016E
FY2017E
Total operating income
1,179
1,340
1,706
2,227
2,500
2,889
% chg
23.6
13.7
27.3
30.5
12.3
15.5
Total Expenditure
1,103
1,247
1,628
2,072
2,311
2,650
Net Raw Materials
813
941
1,171
1,478
1,648
1,903
Personnel
134
144
225
288
322
366
Other
156
162
232
307
341
381
EBITDA
76
93
78
154
190
239
% chg
(9.4)
23.2
(16.7)
98.3
23.0
25.8
(% of Net Sales)
6.4
7.0
4.6
6.9
7.6
8.3
Depreciation & Amort.
40
46
59
83
97
104
EBIT
52
58
36
94
115
157
% chg
(18.9)
11.8
(38.8)
163.3
22.6
36.9
(% of Net Sales)
4.4
4.3
2.1
4.2
4.6
5.4
Interest & other Charges
20
19
24
25
31
29
Other Income
16
11
17
23
22
23
PBT (recurring)
32
39
11
69
84
128
% chg
(32.5)
21.3
(70.8)
501.5
22.6
52.1
Extraordinary Exp./(Inc.)
(8)
0
1
16
-
-
PBT (reported)
25
39
13
85
84
128
Tax
0
11
8
19
20
38
(% of PBT)
1.3
28.0
58.7
22.9
24.0
30.0
Minority interest
0
(1)
(1)
(0)
4
7
Associate cos share
4
(1)
1
2
3
4
Pref dividend
0
0
0
0
0
0
PAT (reported)
28
28
7
68
62
86
ADJ. PAT
36
28
6
56
62
86
% chg
5.9
(21.7)
(77.0)
762.9
12.5
38.0
(% of Net Sales)
3.0
2.1
0.4
2.5
2.5
3.0
Basic EPS (`)
22.5
17.6
4.1
35.0
39.4
54.3
Fully Diluted EPS (`)
22.5
17.6
4.1
35.0
39.4
54.3
% chg
5.9
(21.7)
(77.0)
762.9
12.5
38.0
July 21, 2015
11
Minda Industries | Initiating Coverage
Balance sheet statement
Y/E March (` cr)
FY2012 FY2013 FY2014 FY2015E FY2016E FY2017E
SOURCES OF FUNDS
Equity Share Capital
19
19
19
19
19
19
Reserves& Surplus
267
289
292
360
422
508
Shareholders Funds
286
309
311
379
442
528
Total Loans
160
170
278
210
262
250
Deferred Tax Liability
1
-
-
-
-
-
Other long term liab.
1
7
2
2
3
3
Long term provisions
16
18
24
31
35
40
Total Liabilities
474
516
629
639
765
856
APPLICATION OF FUNDS
Gross Block
518
606
1,073
1,165
1,390
1,470
Less: Acc. Dep.
243
288
673
756
854
958
Net Block
275
319
401
409
536
512
Capital WIP
5
42
22
20
20
20
Investments
23
22
47
29
27
35
Loans and adv.
22
22
21
29
33
38
Current Assets
391
395
481
592
639
813
Cash
67
39
28
30
8
56
Other
324
356
453
562
631
757
Current liabilities
242
290
352
451
503
577
Net Current Assets
149
105
129
141
136
236
Total Assets
474
516
629
639
765
856
July 21, 2015
12
Minda Industries | Initiating Coverage
Cash flow statement
Y/E March (` cr)
FY2012
FY2013
FY2014
FY2015E FY2016E FY2017E
Profit before tax
25
39
13
85
84
128
Depreciation
91
44
385
83
97
104
Change in Working Capital
(29)
16
(35)
(10)
(17)
(52)
Others
(1)
4
(3)
6
2
4
Direct taxes paid
(0)
(11)
(8)
(19)
(20)
(38)
Cash Flow from Operations
84
92
353
145
146
146
(Inc.)/ Dec. in Fixed Assets
(113)
(125)
(447)
(90)
(225)
(80)
(Inc.)/ Dec. in Investments
(4)
1
(26)
18
2
(8)
(Inc.)/ Dec. in Loans & Adv
(8)
(1)
2
(8)
(4)
(5)
Cash Flow from Investing
(125)
(125)
(471)
(80)
(227)
(93)
Issue of Equity
(37)
0
0
0
0
0
Inc./(Dec.) in loans
10
10
108
(68)
52
(12)
Dividend Paid (Incl. Tax)
(7)
(6)
(6)
(6)
(6)
(6)
Others
119
1
4
10
12
13
Cash Flow from Financing
85
5
107
(63)
58
(5)
Inc./(Dec.) in Cash
44
(28)
(11)
2
(22)
48
Opening Cash balances
23
67
39
28
30
8
Closing Cash balances
67
39
28
30
8
56
July 21, 2015
13
Minda Industries | Initiating Coverage
Key ratios
Y/E March
FY2012
FY2013
FY2014
FY2015E
FY2016E
FY2017E
Valuation Ratio (x)
P/E (on FDEPS)
23.3
29.8
129.4
15.0
13.3
9.7
P/CEPS
11.0
11.2
12.7
6.0
5.2
4.4
P/BV
2.9
2.7
2.7
2.2
1.9
1.6
Dividend yield (%)
0.6
0.6
0.6
0.7
0.7
0.8
EV/Sales
0.8
0.7
0.6
0.5
0.4
0.4
EV/EBITDA
12.2
10.3
13.9
6.6
5.7
4.3
EV / Total Assets
2.0
1.9
1.7
1.6
1.4
1.2
Per Share Data (`)
EPS (Basic)
22.5
17.6
4.1
35.0
39.4
54.3
EPS (fully diluted)
22.5
17.6
4.1
35.0
39.4
54.3
Cash EPS
47.8
46.8
41.3
87.6
100.7
120.1
DPS
3.0
3.0
3.0
3.5
3.5
4.0
Book Value
180.4
194.6
196.2
239.0
278.4
332.7
Dupont Analysis
EBIT margin
4.4
4.3
2.1
4.2
4.6
5.4
Tax retention ratio
1.0
0.7
0.4
0.8
0.8
0.7
Asset turnover (x)
2.9
2.8
2.8
3.7
3.3
3.6
ROIC (Post-tax)
12.6
8.8
2.4
11.9
11.5
13.8
Cost of Debt (Post Tax)
12.2
8.1
3.6
9.2
8.9
8.2
Leverage (x)
0.3
0.4
0.8
0.5
0.6
0.4
Operating ROE
12.7
9.1
1.5
13.2
13.1
15.8
Returns (%)
ROCE (Pre-tax)
11.0
11.3
5.7
14.7
15.0
18.4
Angel ROIC (Pre-tax)
12.8
12.2
5.9
15.4
15.2
19.7
ROE
12.5
9.1
2.1
14.6
14.1
16.3
Turnover ratios (x)
Asset Turnover (Gross Block)
2.3
2.2
1.6
1.9
1.8
2.0
Inventory / Sales (days)
25.0
24.4
26.7
26.0
26.0
26.0
Receivables (days)
60.7
59.2
55.8
52.0
52.0
55.0
Payables (days)
75.0
78.9
75.3
74.0
73.5
72.9
WC cycle (ex-cash) (days)
25.4
18.1
21.6
18.2
18.7
22.7
Solvency ratios (x)
Net debt to equity
0.3
0.4
0.8
0.5
0.6
0.4
Net debt to EBITDA
1.2
1.4
3.2
1.2
1.3
0.8
Interest Coverage (EBIT / Int.)
2.6
3.1
1.5
3.7
3.7
5.4
July 21, 2015
14
Minda Industries | Initiating Coverage
Research Team Tel: 022 - 39357800
DISCLAIMER
Angel Broking Private Limited (hereinafter referred to as “Angel”) is a registered Member of National Stock Exchange of India Limited,
Bombay Stock Exchange Limited and MCX Stock Exchange Limited. It is also registered as a Depository Participant with CDSL and
Portfolio Manager with SEBI. It also has registration with AMFI as a Mutual Fund Distributor. Angel Broking Private Limited is a
registered entity with SEBI for Research Analyst in terms of SEBI (Research Analyst) Regulations, 2014 vide registration number
INH000000164. Angel or its associates has not been debarred/ suspended by SEBI or any other regulatory authority for accessing
/dealing in securities Market. Angel or its associates including its relatives/analyst do not hold any financial interest/beneficial
ownership of more than 1% in the company covered by Analyst. Angel or its associates/analyst has not received any compensation /
managed or co-managed public offering of securities of the company covered by Analyst during the past twelve months. Angel/analyst
has not served as an officer, director or employee of company covered by Analyst and has not been engaged in market making activity
of the company covered by Analyst.
This document is solely for the personal information of the recipient, and must not be singularly used as the basis of any investment
decision. Nothing in this document should be construed as investment or financial advice. Each recipient of this document should
make such investigations as they deem necessary to arrive at an independent evaluation of an investment in the securities of the
companies referred to in this document (including the merits and risks involved), and should consult their own advisors to determine
the merits and risks of such an investment.
Reports based on technical and derivative analysis center on studying charts of a stock's price movement, outstanding positions and
trading volume, as opposed to focusing on a company's fundamentals and, as such, may not match with a report on a company's
fundamentals.
The information in this document has been printed on the basis of publicly available information, internal data and other reliable
sources believed to be true, but we do not represent that it is accurate or complete and it should not be relied on as such, as this
document is for general guidance only. Angel Broking Pvt. Limited or any of its affiliates/ group companies shall not be in any way
responsible for any loss or damage that may arise to any person from any inadvertent error in the information contained in this report.
Angel Broking Pvt. Limited has not independently verified all the information contained within this document. Accordingly, we cannot
testify, nor make any representation or warranty, express or implied, to the accuracy, contents or data contained within this document.
While Angel Broking Pvt. Limited endeavors to update on a reasonable basis the information discussed in this material, there may be
regulatory, compliance, or other reasons that prevent us from doing so.
This document is being supplied to you solely for your information, and its contents, information or data may not be reproduced,
redistributed or passed on, directly or indirectly.
Neither Angel Broking Pvt. Limited, nor its directors, employees or affiliates shall be liable for any loss or damage that may arise from
or in connection with the use of this information.
Note: Please refer to the important ‘Stock Holding Disclosure' report on the Angel website (Research Section). Also, please refer to the
latest update on respective stocks for the disclosure status in respect of those stocks. Angel Broking Pvt. Limited and its affiliates may
have investment positions in the stocks recommended in this report.
Disclosure of Interest Statement
Minda Industries
1. Analyst ownership of the stock
No
2. Angel and its Group companies ownership of the stock
No
3. Angel and its Group companies' Directors ownership of the stock
No
4. Broking relationship with company covered
No
Note: We have not considered any Exposure below ` 1 lakh for Angel, its Group companies and Directors
Ratings (Based on expected returns
Buy (> 15%)
Accumulate (5% to 15%)
Neutral (-5 to 5%)
over 12 months investment period):
Reduce (-5% to -15%)
Sell (< -15)
July 21, 2015
15