Initiating coverage | Auto Ancillary
December 18, 2017
Menon Bearings Limited
BUY
CMP
`91.5
To benefit from CV recovery
Target Price
`114.3
Menon Bearings Limited (MBL) is a 4-decades old company operating in the
Investment Period
12 Months
business of engine bearings, Bushes, thrust washers, and aluminum die-castings.
Its 70% revenue comes from bearings segment while rest 30% comes from aluminum die-
Stock Info
castings. Exports contribute ~35% of revenue.
Sector
Auto Ancillary
Recovery in the CV volumes positive for MBL: MBL makes engine bearings, bushes
Market Cap (` cr)
515
and thrust washers for commercial vehicles (CV). Bearings business represents
Net Debt (` cr)
5
55% of its total sales, where it caters only to CVs. On that backdrop, the recovery
Beta
1.3
in the CV sales is going to be positive for MBL. Company claims that the bearings
52 Week High / Low
102/60
business has certain entry barriers, hence its customer base is sticky in nature.
Avg. Daily Volume
12,488
Capacity augmentation to cater incremental demand: With the revival in the CVs
Face Value (`)
1
and tractors, MBL is expecting a strong traction in its revenue and is in process of
BSE Sensex
33,463
increasing its bearings capacity by 30-35% over next one year. Moreover,
Nifty
10,333
company is targeting increase in its wallet share with most of its customers.
Reuters Code
MEN IN
Aluminum die-casting and exports business de-risking operations: We like MBL’s
Bloomberg Code
MENO NS
de-risking strategy by diversifying business in Aluminum die casting and exports.
The die casting business has strong clientele like Honeywell, whereas in exports its
Shareholding Pattern (%)
clients are Cummins, John Deere, etc. The aluminum die casting business is
expected to grow at a faster rate (~2x over next two years) due to the new
Promoters
74.7
contracts, particularly Honeywell. The growing exports are expected to boost the
MF / Banks / Indian Fls
0.0
margins from current 27% to ~28-29% over next three years.
FII / NRIs / OCBs
0.0
Outlook and valuation: We expect MBL to report net revenue/PAT CAGR of
Indian Public / Others
25.3
15.0%/17.8% respectively over FY2017-20E due to recovery in CV volumes,
addition of clients, increasing wallet share and rising aluminum die casting and
Abs. (%)
3m 1yr
3yr
exports business. We expect MBL to continue report EBITDA margins between 28-
29% and ROE of 27-29% during this period. We also expect company to pay
Sensex
4.0
26.2
22.3
dividend at 30-40% payouts. At the CMP of `92, the stock trades at a P/E of 16x
Menon Bearings
5.2
29.4
238.8
its FY2020E EPS of
`5.7. We initiate coverage on the stock with a Buy
recommendation and Target Price of `114 based on 20x FY20E EPS, indicating
Price Chart
an upside of 25% from the current levels.
120
Key Financials (Consolidated)
90
Y/E March (`cr)
FY16
FY17
FY18E
FY19E
FY20E
60
Net Sales
111
124
139
162
188
% chg
7.9
11.0
12.0
17.0
16.0
30
Net Profit
15
19
23
27
32
0
% chg
28.8
29.2
18.6
19.2
17.7
OPM (%)
26.0
27.0
28.0
29.0
29.0
EPS (Rs)
2.7
3.4
4.1
4.9
5.7
P/E (x)
34.5
26.7
22.5
18.9
16.0
Source: Company, Angel Research
P/BV (x)
9.9
8.0
6.5
5.4
4.4
RoE (%)
28.6
30.0
29.0
28.4
27.6
RoCE (%)
38.0
33.0
34.4
35.1
35.1
EV/Sales (x)
4.7
4.2
3.7
3.1
2.6
Shrikant Akolkar
EV/EBITDA (x)
17.9
15.5
13.2
10.7
9.0
022 - 3935 7800 Ext: 6846
Source: Company, Angel Research; Note: as CMP of Dec 15, 2017
Please refer to important disclosures at the end of this report
1
Initiating coverage | Menon Bearings
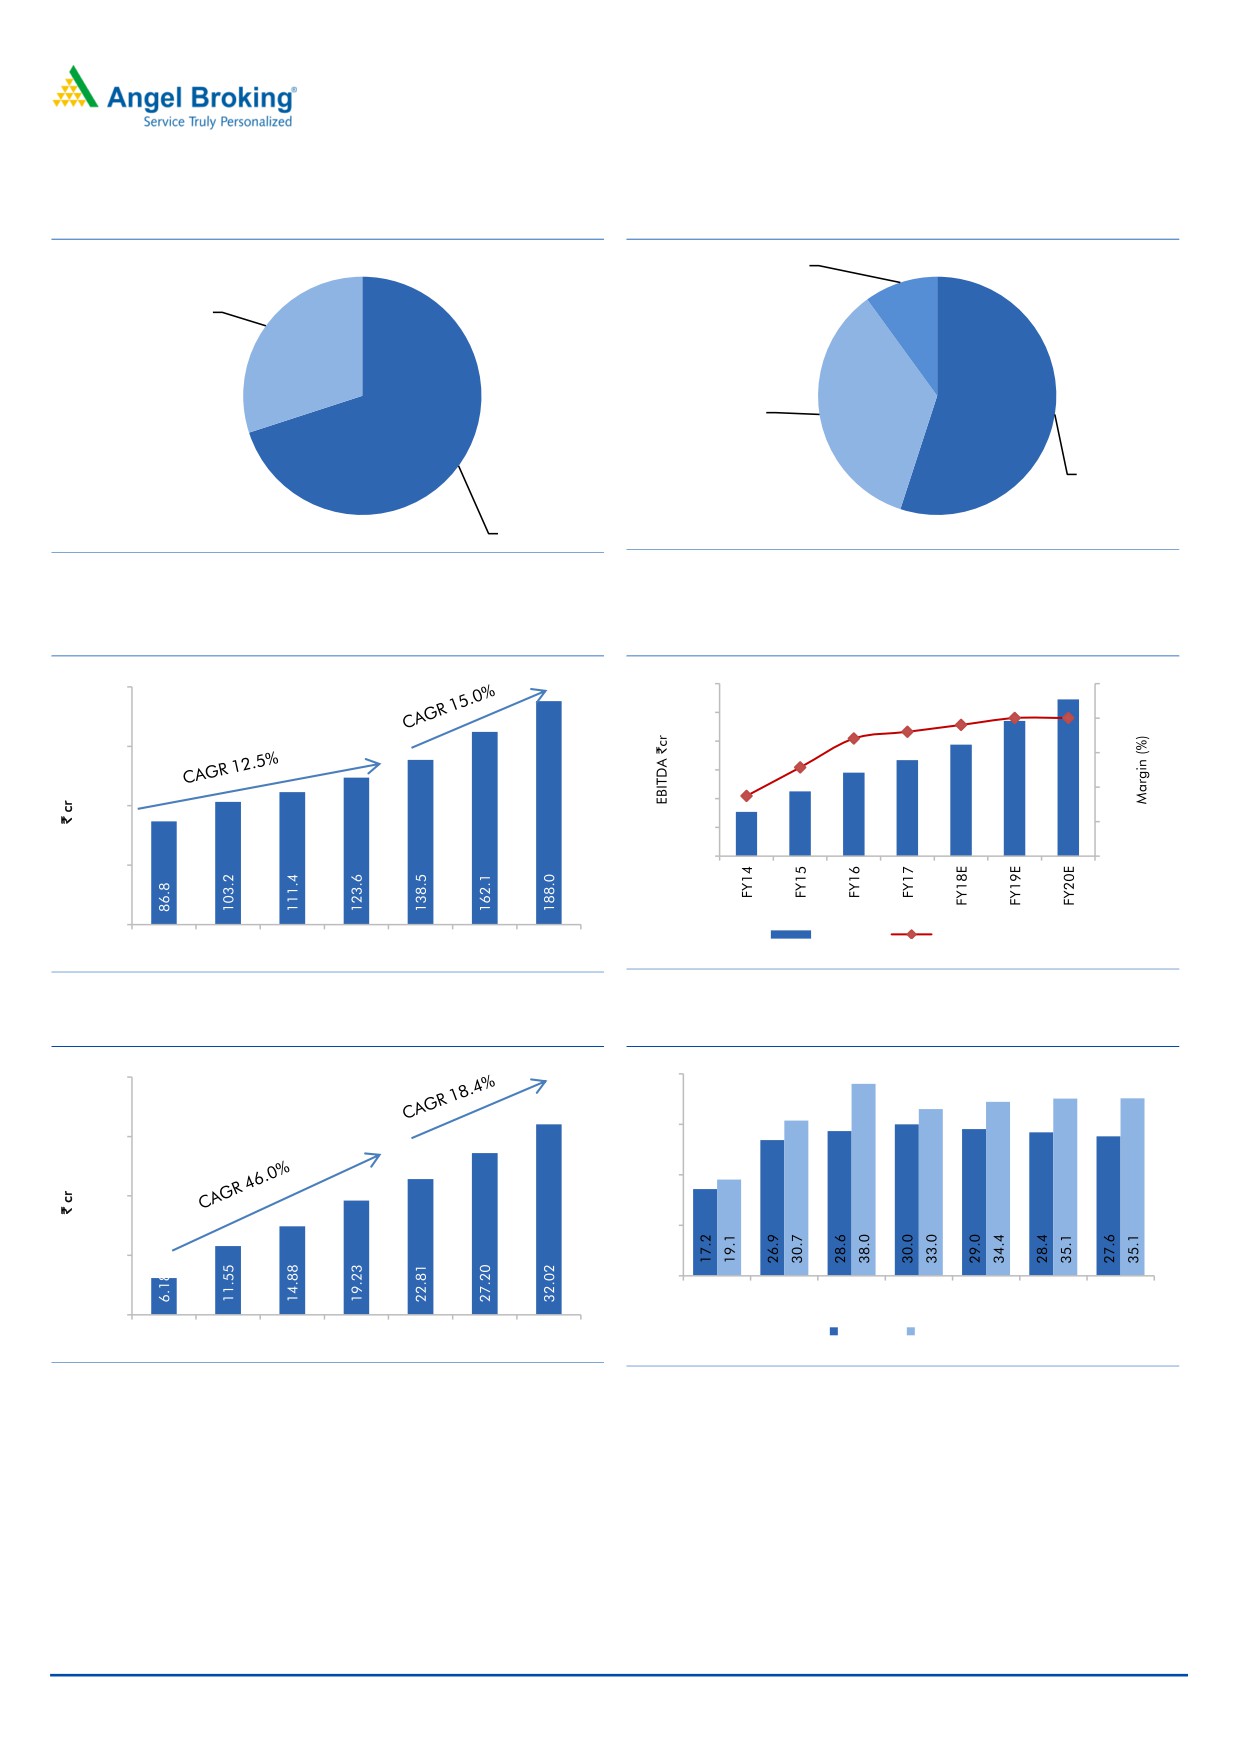
Menon Bearings at a glance
Exhibit 1: Bearings is the largest segment
Exhibit 2: OEMs contribute 55% of the revenue
Aftermarket,
Aftermarket,
10.0%.0%
Aluminum die
castings, 30%
Exports, 35.0%
OEMs, 55.0%
Bearings, 70%
Source: Company, Angel Research
Source: Company, Angel Research
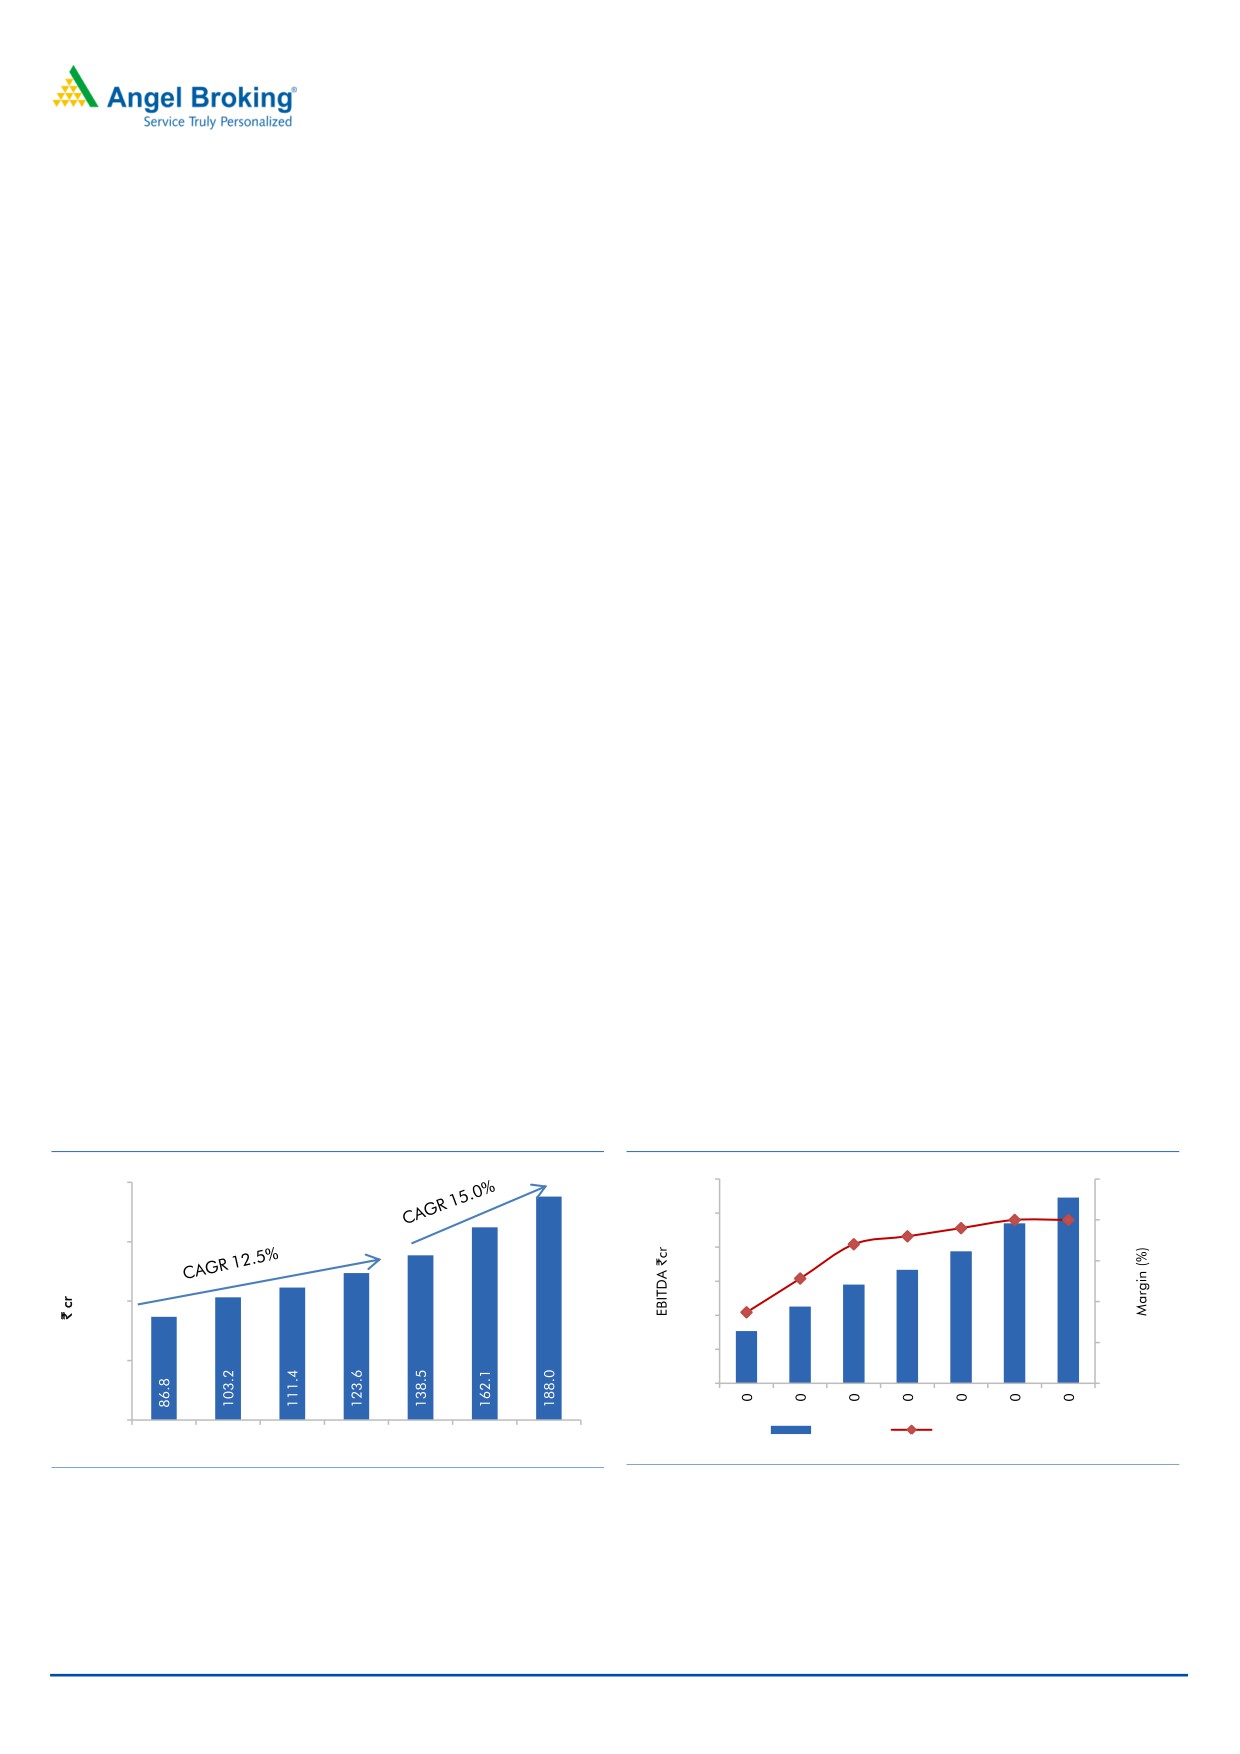
Exhibit 3: 15% revenue CAGR over next three years
Exhibit 4: Margin profile sustainable
200.0
60.0
29.0
34
29.0
28.0
50.0
27.0
29
26.0
150.0
40.0
21.8
24
30.0
17.7
19
20.0
100.0
14
10.0
0.0
9
50.0
0.0
EBITDA
EBITDA margins
FY14
FY15
FY16
FY17 FY18E FY19E FY20E
Source: Company, Angel Research
Source: Company, Angel Research
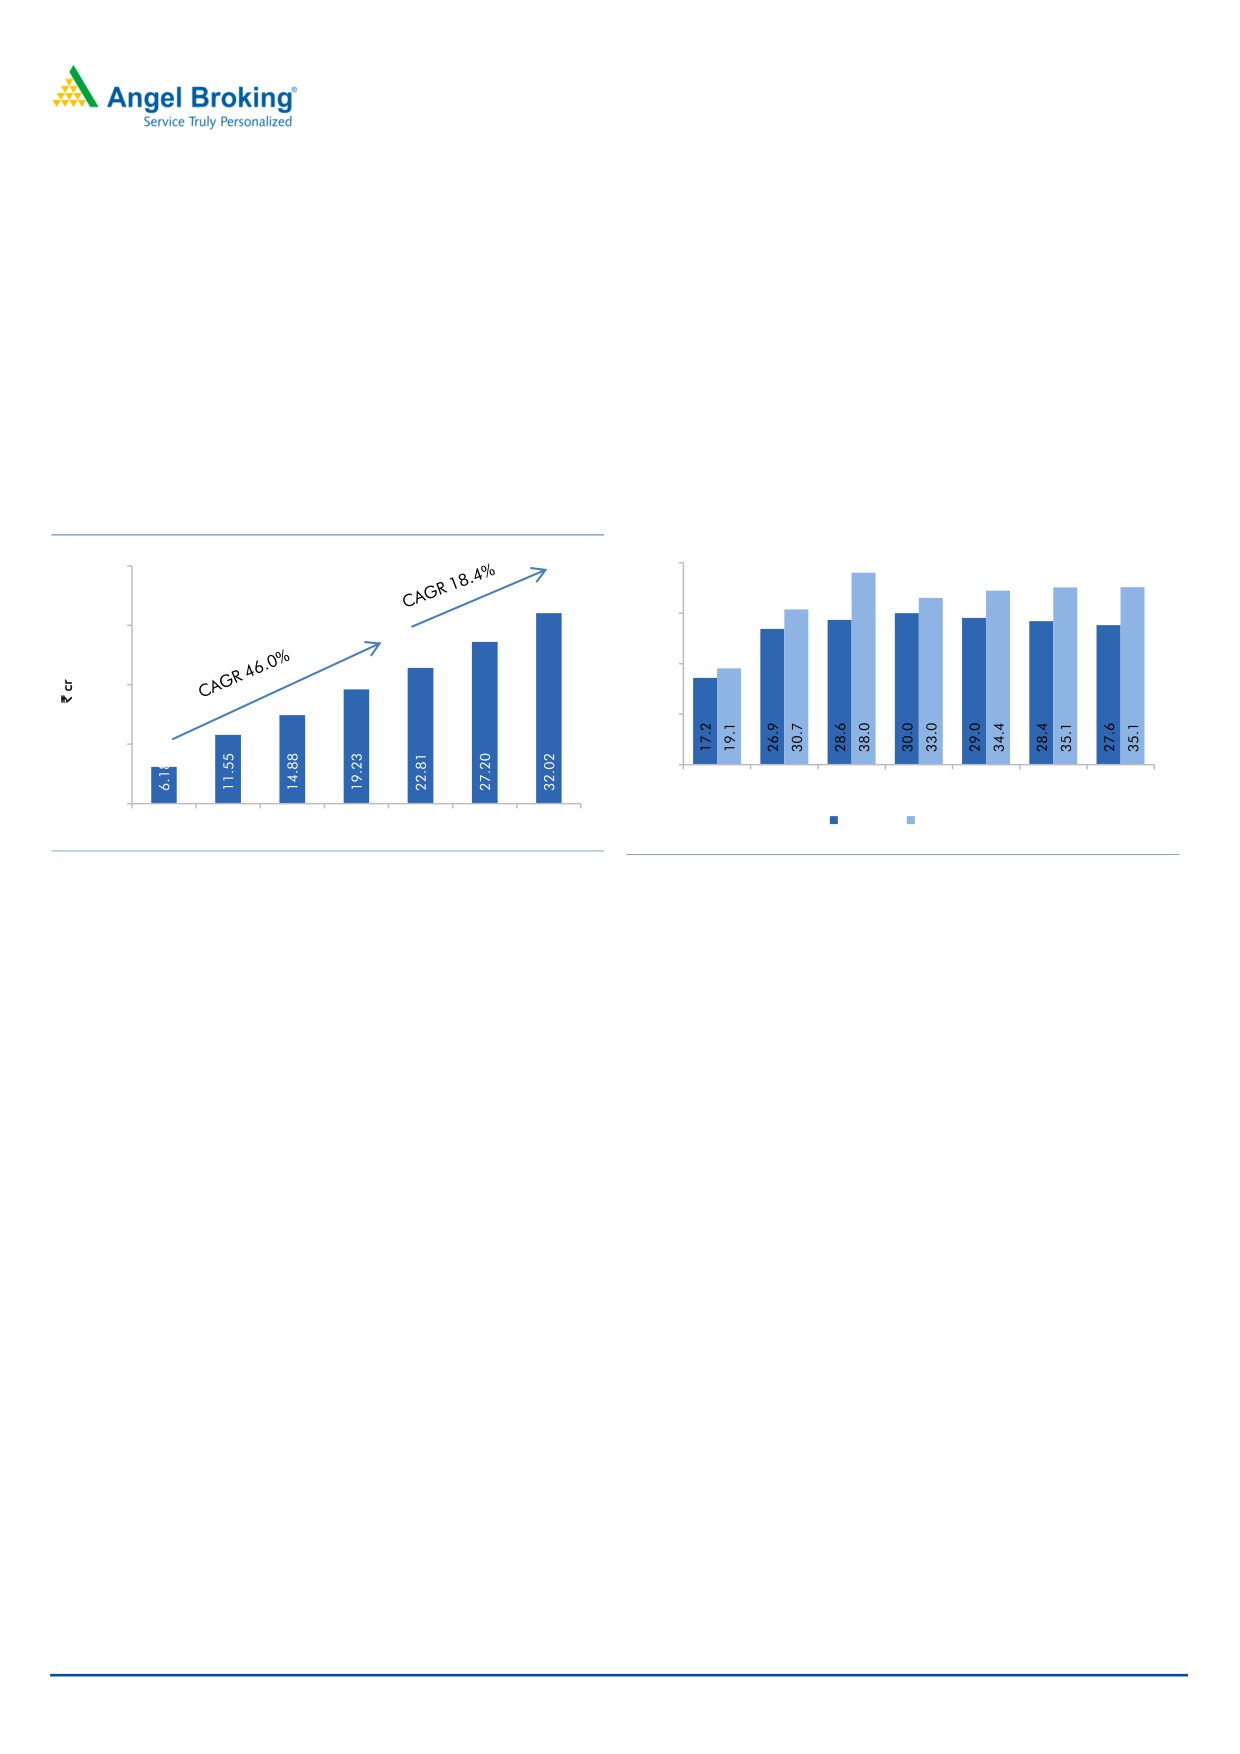
Exhibit 5: 18.4% PAT CAGR over next three years
Exhibit 6: Sticky model allows ROE/ROCE expansion
40.00
40.0
30.0
30.00
20.0
20.00
10.0
10.00
0.0
FY14
FY15
FY16
FY17
FY18E FY19E FY20E
0.00
FY14
FY15
FY16
FY17 FY18E FY19E FY20E
ROE (%) ROCE (%)
Source: Company, Angel Research
Source: Company, Angel Research
December 18, 2017
2
Initiating coverage | Endurance Technologies
About company
Menon Bearings Limited (MBL) is engaged in the manufacturing of bi-metal engine
bearings; bushes and thrust washers for light and heavy automobile engines; two
wheeler engines, and compressors for refrigerators, air conditioners and others. It
also offers aluminum die casting components. Company exports its products to the
United States, the United Kingdom, Italy, France, China, Mexico and Brazil, among
others
Its product portfolio includes following
Bearing products - bearings for connecting rods, bearings for crank shafts,
flanged bearings and tri-metal bearings.
Bushes - truncated bushes for connecting rods; ball indented bushes; bushes
for connecting rods; cam shafts; rock shafts, and rocker arms.
Thrust washers - washers with thrust face contours and ring type thrust
washers.
Aluminum products - engine components, gear case covers, clutch assembly,
cylinder heads for automobile engines, break parts, engine parts, portable
tools and fuel pump parts.
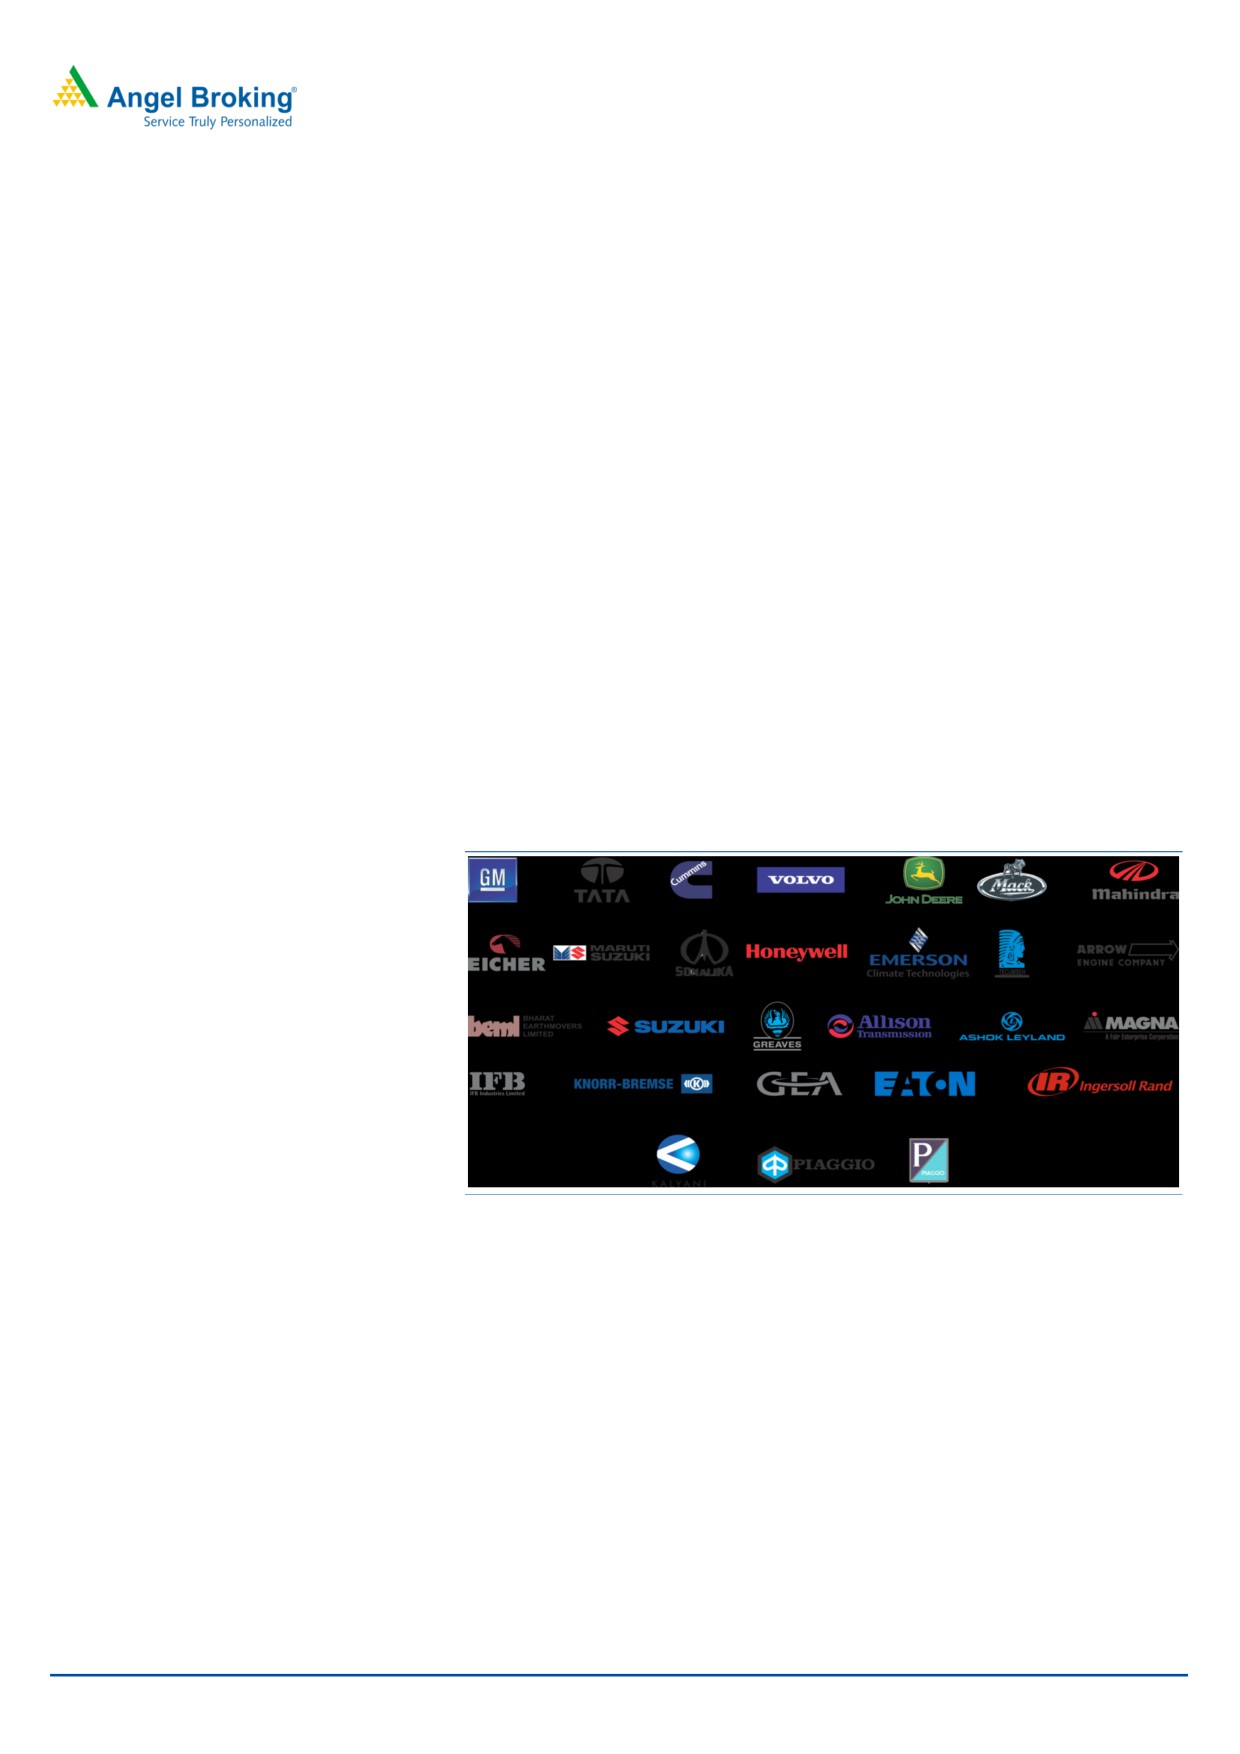
Exhibit 7: Marquee customers in the portfolio
Source: Company, Angel Research
Key Management Personnel
Mr. R D Dixit - Chairman and Managing Director
Mr. Dixit is associated with Menon Group for more than 50 years. He is currently
CMD of Menon bearings and also holds directorship in Menon Pistons Limited. He
is a Bachelor of Mechanical Engineering and has been with MBL since 1992.
Mr. Nitin Menon - Vice chairman and Joint Managing Director
He is a promoter of the company associated with the MBL since 1995. He has
experience in running businesses in automobile, agriculture and allied sectors. He
has a degree in Commerce.
December 18, 2017
3
Initiating coverage | Endurance Technologies
Investment Rationale
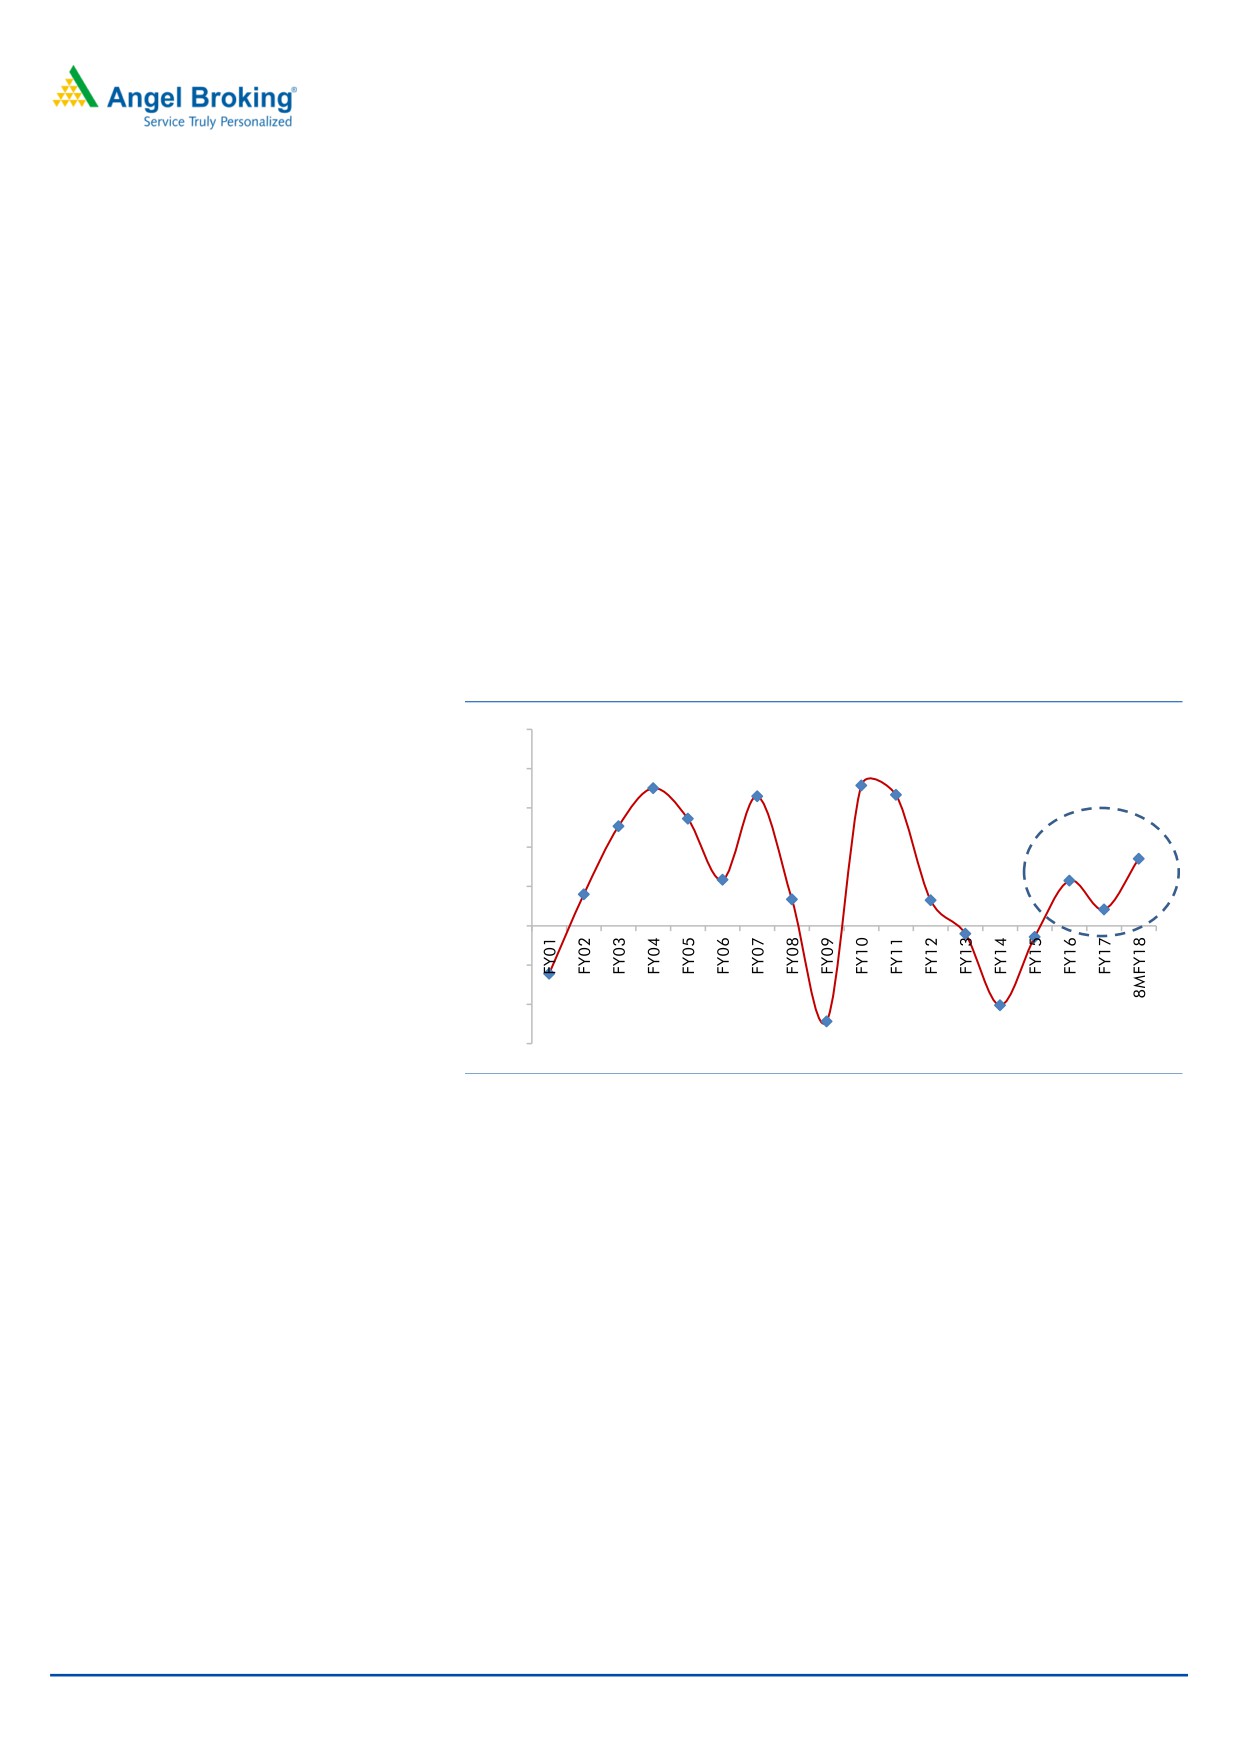
CV market recovery to be positive for Menon Bearings: After the slump of three
years (FY13 to FY15), the domestic CV volumes have been recovering since FY16.
While the demonetisation in Nov-16 and BSIII to BSIV transition in April-17
affected the CV sales in FY17, the growth has come back in FY18, reflected in the
double-digit growth in 2QFY18. We continue to see strong CV volumes going
ahead due to Government’s thrust to create road infrastructure and build ~1.2cr
affordable houses by FY2022E.
On the back of strengthening of the rural economy and two nearly normal seasons
of monsoon, the demand for tractors has also come back on track. While this
remains a seasonal phenomenon, it should be noted that it has come back after
two seasons of draught prior two years. With the rising food grain production and
MSP hikes this year, we believe rural economy is expected to remain strong which
is expected to keep the tractor demand on the growth trajectory.
Exhibit 8: Recovery in the CV volumes
50%
35%
36%
40%
33%
33%
27%
25%
30%
17%
20%
12%
12%
8%
7%
7%
10%
4%
-2%
-3%
0%
-10%
-20%
-12%
-20%
-30%
-24%
Source: SIAM, Angel Research
Menon Bearings - Diversified business with marquee clients: Menon bearings is a
diversified auto ancillary, making engine bearings for the CVs/tractors and high
pressure aluminum die casting for non auto clients. The company earlier had only
bearings business which it diversified by moving in the high pressure die casting
business and exports.
In the bearings business company has customers like Tata Motors, Cummins, John
Deere, Greaves Cotton, M&M, Federal Mogul, while in the Die casting business its
customers are Honeywell, Gabriel, Royal Enfield, Mahindra and Mahindra, Tata
Motors, etc. The company has seen strong traction in the die casting business
which now contributes about 30% of the business. The exports business has been
doing well due to the strong order book from its overseas clients, contributing
~35% of the total revenue. The pie of exports has been increasing which also de-
risks its business from the volatility in the domestic CV business.
The customer concentration risk remains low for the company as no single OEM
contributes more than 7-8% of its revenue. Considering that CVs follow a
December 18, 2017
4
Initiating coverage | Endurance Technologies
particular business cycle, MBL is less dependent on a single OEM for revenue
generation.
Increasing wallet share with existing customers: While the company has diversified
customer base, its wallet share with its major customers is also increasing. For
example, share of business with Tata Motors is currently at 35-40% which is
expected to grow to ~55% going ahead. The share of business with John Deere is
also expected to grow going forward. Share with Honeywell is ~35-40% which is
also expected to rise going ahead, given that company is very bullish on its
business with Honeywell. MBL is also expecting to add more clients and in
anticipation of high growth in the bearings business, company is expanding its
manufacturing capacity.
Capacity augmentation to cater incremental demand: With the revival in the
commercial vehicles and tractors, MBL is expecting strong growth traction in its
revenue and is in process of increasing its bearings capacity by 30-35% over next
one year. The aluminum die casting business is expected to grow at a faster rate
(~2x over next two years) due to the new contracts, which includes business from
Honeywell on which MBL is extremely bullish. Similarly, company is targeting to
increase its wallet share with most of its customers.
Strong track record in growth and profitability: Owing to stickiness of clients and
diversified business model, MBL has achieved a topline CAGR of 12.5% between
FY14-FY17. Due to strict control, control, timely raw material sourcing, increasing
exports business and well integrated facilities, MBL has also seen improvement in
EBITDA margins from 22% in FY14 to 27% in FY17. We believe that MBL can
deliver top line CAGR of 15% due to improved outlook of CV business. We are
also positive on the margins as exports business is expected to grow further and
company is delivering economies of scale due to 1) entry barrier due to the long
time span required to validate the bearings and 2) strong expertise in the business.
We forecast average 29% EBITDA margins during our forecast period and
bottomline CAGR of 17.8% between FY18E-FY20E.
Exhibit 9: 15% revenue CAGR over next three years
Exhibit 10: Margin profile sustainable
200.0
60.0
34
29.0
29.0
28.0
50.0
27.0
26.0
29
150.0
40.0
21.8
24
30.0
17.7
100.0
19
20.0
14
10.0
50.0
0.0
9
0.0
EBITDA
EBITDA margins
FY14
FY15
FY16
FY17 FY18E FY19E FY20E
Source: Company, Angel Research
Source: Company, Angel Research
Strong balance sheet with healthy return ratios: The lower capex requirement has
led MBL to maintain a lean balance sheet with debt to equity ratio of 0.34x. It has
a cash of `17cr, while debt stands at `23.3cr. The balance sheet is expected to
December 18, 2017
5
Initiating coverage | Endurance Technologies
remain healthy as company does not plan to raise more debt, with additional
capex requirement of ~`20cr to be largely funded using internal accruals and
existing cash. Working capital cycle has been between 80-90 days, in line with
the industry peers (~90-100 days).
The strong balance sheet coupled with healthy business has led MBL put a strong
return profile. ROE has consistently improved from 17.2% in FY14 to 30.% in
FY17. Return on Invested Capital has improved from ~22.0% in FY14 to 43.4% in
FY17. We expect MBL to continue report EBITDA margins between 28-29% and
ROE of 27-29% over FY18E-FY20E.
Exhibit 11: 18.4% PAT CAGR over next three years
Exhibit 12: Further headroom for ROE/ROCE expansion
40.00
40.0
30.0
30.00
20.0
20.00
10.0
10.00
0.0
FY14
FY15
FY16
FY17
FY18E FY19E FY20E
0.00
FY14
FY15
FY16
FY17 FY18E FY19E FY20E
ROE (%) ROCE (%)
Source: Company, Angel Research
Source: Company, Angel Research
Outlook and valuation
We expect MBL to report net revenue/PAT CAGR of 15.0%/17.8% respectively over
FY2017-20E due to recovery in CV volumes, addition of clients, increasing wallet
share and rising aluminum die casting and exports business. We expect MBL to
continue report EBITDA margins between 28-29% and ROE of 27-29% during this
period. We also expect company to pay dividend at 30-40% payouts. At the CMP
of `92, the stock trades at a P/E of 16x its FY2020E EPS of `5.7. We initiate
coverage on the stock with a Buy recommendation and Target Price of `114 based
on 20x FY20E EPS, indicating an upside of 25% from the current levels.
December 18, 2017
6
Initiating coverage | Endurance Technologies
Income statement
Y/E March (` cr)
FY16
FY17
FY18E
FY19E
FY20E
Total operating income
111
124
139
162
188
% chg
7.9
11.0
12.0
17.0
16.0
Total Expenditure
82
90
100
115
133
Cost of Materials
38
42
48
53
62
Personnel
8
9
11
13
15
Others Expenses
36
39
41
49
56
EBITDA
29
33
39
47
55
% chg
28.6
15.1
16.2
21.2
16.0
(% of Net Sales)
26.0
27.0
28.0
29.0
29.0
Depreciation& Amort.
5
5
4
6
6
EBIT
24
28
34
41
48
% chg
33.3
15.7
21.9
19.3
17.5
(% of Net Sales)
21.9
22.9
24.9
25.3
25.7
Interest & other Charges
2
1
1
1
1
Other Income
1
1
1
1
1
(% of PBT)
2.3
2.1
3.0
2.5
2.1
Share in profit of Ass.
-
-
-
-
-
Recurring PBT
23
28
34
41
48
% chg
40.2
18.7
22.8
19.5
17.7
Prior Period & Extra. Exp.
-
-
-
-
-
PBT (reported)
23
28
34
41
48
Tax
8
8
11
13
16
(% of PBT)
36.2
30.5
32.9
33.0
33.0
PAT (reported)
15
19
23
27
32
Add: Share of earnings of ass.
-
-
-
-
-
Less: Minority interest (MI)
-
-
-
-
-
PAT after MI (reported)
15
19
23
27
32
ADJ. PAT
15
19
23
27
32
% chg
28.8
29.2
18.6
19.2
17.7
(% of Net Sales)
13.4
15.6
16.5
16.8
17.0
Basic EPS (`)
2.7
3.4
4.1
4.9
5.7
Fully Diluted EPS (`)
2.7
3.4
4.1
4.9
5.7
% chg
28.8
29.2
18.6
19.2
17.7
December 18, 2017
7
Initiating coverage | Endurance Technologies
Balance sheet
Y/E March (` cr)
FY16
FY17
FY18E
FY19E
FY20E
SOURCES OF FUNDS
Equity Share Capital
5
6
6
6
6
Reserves& Surplus
47
59
73
90
110
Shareholders Funds
52
64
79
96
116
Minority Interest
-
-
-
-
-
Total Loans
12
21
21
21
21
Deferred Tax Liability
4
4
4
4
4
Other long term liabilities
-
-
-
-
-
Long-term provisions
-
-
-
-
-
Total Liabilities
68
89
104
121
141
APPLICATION OF FUNDS
Gross Block
79
87
97
108
114
Less: Acc. Depreciation
44
49
54
60
66
Net Block
35
37
43
48
48
Intangible assets
-
-
-
-
-
Capital work-in-progress
1
4
4
4
4
Non-current investments
-
-
-
-
-
Long-term loans and advances
Other non-current assets
Current Assets
44
62
71
84
106
Inventories
11
12
13
15
18
Sundry Debtors
25
29
30
36
41
Cash
5
17
24
30
44
Loans & Advances
2
3
3
3
3
Other Assets
1
1
1
1
1
Current liabilities
12
13
14
15
16
Net Current Assets
33
48
57
69
90
Deferred Tax Asset
0
0
0
0
0
Mis. Exp. not written off
-
-
-
-
-
Total Assets
68
89
104
121
141
December 18, 2017
8
Initiating coverage | Endurance Technologies
Cash flow statement
Y/E March (` cr)
FY16
FY17
FY18E FY19E FY20E
Profit before tax
23
28
34
41
48
Depreciation
5
5
4
6
6
Change in Working Capital
(9)
(4)
(1)
(6)
(7)
Interest / Dividend (Net)
2
1
1
1
1
Direct taxes paid
(8)
(8)
(11)
(13)
(16)
Others
0
(0)
-
-
-
Cash Flow from Operations
12
21
27
28
33
(Inc.)/ Dec. in Fixed Assets
(4)
(10)
(10)
(11)
(6)
(Inc.)/ Dec. in Investments
0
(0)
-
-
-
Cash Flow from Investing
(4)
(10)
(10)
(11)
(6)
Issue of Equity
-
-
-
-
-
Inc./(Dec.) in loans
(4)
9
-
-
-
Interest paid
(2)
(1)
(1)
(1)
(1)
Dividend Paid (Incl. Tax)
(6)
(7)
(8)
(10)
(12)
Cash Flow from Financing
(12)
1
(10)
(12)
(13)
Inc./(Dec.) in Cash
(4)
12
7
6
14
Opening Cash balances
9
5
17
24
30
Closing Cash balances
5
17
24
30
44
December 18, 2017
9
Initiating coverage | Endurance Technologies
Key Ratios
Y/E March
FY16
FY17
FY18E
FY19E
FY20E
Valuation Ratio (x)
P/E (on FDEPS)
34.5
26.7
22.5
18.9
16.0
P/CEPS
26.4
21.1
18.9
15.5
13.4
P/BV
9.9
8.0
6.5
5.4
4.4
Dividend yield (%)
0.9
1.1
1.4
1.6
1.9
EV/Sales
4.7
4.2
3.7
3.1
2.6
EV/EBITDA
17.9
15.5
13.2
10.7
9.0
EV / Total Assets
8.1
6.0
5.1
4.3
3.6
Per Share Data (`)
EPS (Basic)
2.7
3.4
4.1
4.9
5.7
EPS (fully diluted)
2.7
3.4
4.1
4.9
5.7
Cash EPS
3.5
4.3
4.8
5.9
6.8
DPS
0.8
1.0
1.3
1.5
1.8
Book Value
9.3
11.4
14.0
17.1
20.7
Dupont Analysis
EBIT margin
21.9
22.9
24.9
25.3
25.7
Tax retention ratio
0.6
0.7
0.7
0.7
0.7
Asset turnover (x)
1.9
1.8
1.8
1.9
2.0
ROIC (Post-tax)
26.4
28.6
30.5
31.6
34.6
Cost of Debt (Post Tax)
0.08
0.04
0.05
0.05
0.05
Leverage (x)
0.1
0.1
(0.0)
(0.1)
(0.2)
Operating ROE
30.0
30.6
29.4
28.8
27.9
Returns (%)
ROCE
38.0
33.0
34.4
35.1
35.1
Angel ROIC (Pre-tax)
41.9
43.4
47.7
49.1
53.6
ROE
28.6
30.0
29.0
28.4
27.6
Turnover ratios (x)
Asset Turnover (Gross Block)
1.4
1.4
1.4
1.5
1.7
Inventory / Sales (days)
37
37
34
34
34
Receivables (days)
82
86
80
80
80
Payables (days)
22
24
22
21
21
WC cycle (ex-cash) (days)
98
99
92
93
93
Solvency ratios (x)
Net debt to equity
0.1
0.1
(0.0)
(0.1)
(0.2)
Net debt to EBITDA
0.2
0.1
(0.1)
(0.2)
(0.4)
Interest Coverage (EBIT / Interest)
15.0
24.1
23.3
27.8
32.6
December 18, 2017
10
Initiating coverage | Endurance Technologies
Research Team Tel: 022 - 39357800
DISCLAIMER
Angel Broking Private Limited (hereinafter referred to as “Angel”) is a registered Member of National Stock Exchange of India Limited,
Bombay Stock Exchange Limited and Metropolitan Stock Exchange Limited. It is also registered as a Depository Participant with CDSL
and Portfolio Manager and Investment Adviser with SEBI. It also has registration with AMFI as a Mutual Fund Distributor. Angel Broking
Private Limited is a registered entity with SEBI for Research Analyst in terms of SEBI (Research Analyst) Regulations, 2014 vide
registration number INH000000164. Angel or its associates has not been debarred/ suspended by SEBI or any other regulatory
authority for accessing /dealing in securities Market. Angel or its associates/analyst has not received any compensation / managed or
co-managed public offering of securities of the company covered by Analyst during the past twelve months.
This document is solely for the personal information of the recipient, and must not be singularly used as the basis of any investment
decision. Nothing in this document should be construed as investment or financial advice. Each recipient of this document should
make such investigations as they deem necessary to arrive at an independent evaluation of an investment in the securities of the
companies referred to in this document (including the merits and risks involved), and should consult their own advisors to determine
the merits and risks of such an investment.
Reports based on technical and derivative analysis center on studying charts of a stock's price movement, outstanding positions and
trading volume, as opposed to focusing on a company's fundamentals and, as such, may not match with a report on a company's
fundamentals. Investors are advised to refer the Fundamental and Technical Research Reports available on our website to evaluate the
contrary view, if any
The information in this document has been printed on the basis of publicly available information, internal data and other reliable
sources believed to be true, but we do not represent that it is accurate or complete and it should not be relied on as such, as this
document is for general guidance only. Angel Broking Pvt. Limited or any of its affiliates/ group companies shall not be in any way
responsible for any loss or damage that may arise to any person from any inadvertent error in the information contained in this report.
Angel Broking Pvt. Limited has not independently verified all the information contained within this document. Accordingly, we cannot
testify, nor make any representation or warranty, express or implied, to the accuracy, contents or data contained within this document.
While Angel Broking Pvt. Limited endeavors to update on a reasonable basis the information discussed in this material, there may be
regulatory, compliance, or other reasons that prevent us from doing so.
This document is being supplied to you solely for your information, and its contents, information or data may not be reproduced,
redistributed or passed on, directly or indirectly.
Neither Angel Broking Pvt. Limited, nor its directors, employees or affiliates shall be liable for any loss or damage that may arise from
or in connection with the use of this information.
Note: Please refer to the important ‘Stock Holding Disclosure' report on the Angel website (Research Section). Also, please refer to the
latest update on respective stocks for the disclosure status in respect of those stocks. Angel Broking Pvt. Limited and its affiliates may
have investment positions in the stocks recommended in this report.
Disclosure of Interest Statement
Menon Bearings Limited
1. Financial interest of research analyst or Angel or his Associate or his relative
No
2. Ownership of 1% or more of the stock by research analyst or Angel or associates or relatives
No
3. Served as an officer, director or employee of the company covered under Research
No
4. Broking relationship with company covered under Research
No
Ratings (Based on expected returns
Buy (> 15%)
Accumulate (5% to 15%)
Neutral (-5 to 5%)
over 12 months investment period):
Reduce (-5% to -15%)
Sell (< -15)
December 18, 2017
11