2QFY2016 Result Update | Automobile
November 10, 2015
Mahindra & Mahindra
ACCUMULATE
CMP
`1,254
Performance Highlights
Target Price
`1,410
Y/E March (` cr)
2QFY16
2QFY15
% chg (yoy) 1QFY16
% chg (qoq)
Investment Period
12 Months
Net Sales
8,794
9,045
(2.8)
9,437
(6.8)
EBITDA
1,163
1,100
5.6
1,353
(14.1)
Stock Info
EBITDA Margin (%)
13.2
12.2
100 bp
14.3
(110 bp)
Sector
Automobile
Adj. PAT
978
974
0.4
831
17.7
Market Cap (` cr)
77,894
Source: Company, Angel Research
Net Debt (` cr)
(11,246)
Results ahead of estimates: Mahindra & Mahindra (M&M)’s 2QFY2016 numbers
Beta
1.0
beat our estimates on account of better-than-anticipated operating performance.
52 Week High / Low
1,442/1,095
For MM+MVML (Mahindra Vehicle Manufacturers Ltd), revenues for the quarter
Avg. Daily Volume
80,018
dipped 3% yoy to `8,794cr, largely in line with our estimate of `8,490cr, owing to
Face Value (`)
5
a 10% volume decline in the quarter. Automotive volumes declined 2% yoy while
BSE Sensex
26,121
tractor volumes dipped 26% yoy. However, realization/vehicle grew 8% yoy on
Nifty
7,915
account of better mix and price hikes in both the automotive and tractor segment,
Reuters Code
MAHM.BO
thereby limiting the downslide in the top-line. The operating margin, at 13.2%,
Bloomberg Code
MM@IN
surprised positively, beating our estimate of 12%. Cost control initiatives, benign
commodity prices and price hikes boosted the margins. Given the robust
operating performance, the Adj PAT at `978cr came in better than our estimate of
Shareholding Pattern (%)
`907cr.
Promoters
25.6
Outlook and valuation: M&M is likely to witness volume recovery from 2HFY2016
MF / Banks / Indian Fls
24.6
in both the automotive and the tractor segment. In the automotive segment, M&M
FII / NRIs / OCBs
36.1
recently introduced TUV 3OO which has received encouraging response and
Indian Public / Others
13.7
plans to enter compact UV space in January 2016 which will likely enable it to
regain market share. Further, the recently launched small commercial vehicle
“Jeeto” and 1.2 tonner vehicle “Supro” would boost the company’s share in the
Abs. (%)
3m 1yr 3yr
light commercial vehicle (LCV) segment. We also believe that the tractor industry
Sensex
(7.5)
(6.3)
39.8
growth would revive from 2HFY2016 owing to the low base of the corresponding
MM
(9.6)
1.1
37.8
previous period and relatively limited impact of deficient rainfall on kharif crop
production. M&M’s PAT is likely to grow at a CAGR of 9% over FY2015-FY2017.
We have broadly retained our earnings assumptions and maintain our
3-Year Daily Price Chart
“Accumulate” recommendation on the stock with a revised SOTP based price
1,700
target of `1,410.
1,400
1,100
Key financials (MM+MVML)
Y/E March (` cr)
FY2014
FY2015 FY2016E
FY2017E
800
Net Sales
38,817
37,468
38,513
43,579
500
% chg
1.2
(3.5)
2.8
13.2
Net Profit
3,905
3,423
3,484
4042
% chg
10.2
(12.3)
1.8
16.0
EBITDA (%)
13.5
12.3
13.6
13.7
Source: Company, Angel Research
EPS (`)
63.4
55.1
56.1
65.1
P/E (x)
19.8
22.8
22.4
19.3
P/BV (x)
4.5
3.9
3.5
3.1
RoE (%)
22.6
17.3
15.7
16.2
RoCE (%)
20.8
17.1
17.0
17.6
Bharat Gianani
EV/Sales (x)
2.0
2.0
2.0
1.7
022-3935 7800 Ext: 6817
EV/EBITDA (x)
14.6
16.6
14.5
12.4
Source: Company, Angel Research; Note: P/E not adjusted for the value of subsidiaries; CMP as on 9th Nov
Please refer to important disclosures at the end of this report
1
Mahindra & Mahindra | 2QFY2016 Result Update
Exhibit 1: Quarterly financial performance (MM+MVML)
Y/E March (` cr)
2QFY16
2QFY15
% chg (yoy)
1QFY16
% chg (qoq)
1HFY16
1HFY15
% chg (yoy)
Net Sales
8,794
9,045
(2.8)
9,437
(6.8)
18,231
18,863
(3.4)
Consumption of RM
5,945
6,307
(5.8)
6,426
(7.5)
12,370
13,101
(5.6)
(% of Sales)
67.6
69.7
68.1
67.9
69.5
Staff Costs
642
609
5.3
657
(2.3)
1,299
1,233
5.3
(% of Sales)
7.3
6.7
7.0
7.1
6.5
Other Expenses
1,045
1,028
1.7
1,001
4.3
2,046
2,009
1.9
(% of Sales)
11.9
11.4
10.6
11.2
10.6
Total Expenditure
7,631
7,944
(3.9)
8,084
(5.6)
15,715
16,343
(3.8)
Operating Profit
1,163
1,100
5.6
1,353
(14.1)
2,516
2,520
(0.2)
OPM (%)
13.2
12.2
14.3
13.8
13.4
Interest
58
73
(20.6)
56
2.8
114
154
(26.3)
Depreciation
283
278
1.7
264
7.1
547
559
(2.0)
Other Income
488
491
(0.4)
116
320.8
605
635
(4.8)
PBT (excl. Extr. Items)
1,310
1,240
5.7
1,149
14.1
2,459
2,442
0.7
Extr. Income/(Expense)
-
-
-
-
-
PBT (incl. Extr. Items)
1,310
1,240
5.7
1,149
14.1
2,459
2,442
0.7
(% of Sales)
14.9
13.7
12.2
13.5
12.9
Provision for Taxation
332
266
24.9
318
4.6
650
572
13.7
(% of PBT)
25.4
21.5
27.7
26.4
23.4
Reported PAT
978
974
0.4
831
17.7
1,809
1,870
(3.3)
Adj PAT
978
974
0.4
831
17.7
1,809
1,870
(3.3)
Adj. PATM
11.1
10.8
8.8
9.9
9.9
Equity capital (cr)
295.7
295.2
295.7
295.7
295.2
Adjusted EPS (`)
15.7
15.7
0.4
13.4
17.7
29.1
30.2
(3.7)
Source: Company, Angel Research
Exhibit 2: 2QFY2016 - Actual vs Angel Estimates
Y/E March (` cr)
Actual
Estimates
Variation (%)
Net Sales
8,794
8,490
3.6
EBITDA
1,163
1,019
14.1
EBITDA margin (%)
13.2
12.0
120 bp
Adj. PAT
978
907
7.8
Source: Company, Angel Research
November 10, 2015
2
Mahindra & Mahindra | 2QFY2016 Result Update
Exhibit 3: Quarterly volume performance
Volume (units)
2QFY16 2QFY15
% chg (yoy)
1QFY16
% chg (qoq)
1HFY16
1HFY15
% chg (yoy)
Total volumes
158,380
176,809
(10.4)
171,925
(7.9)
330,305
363,987
(9.3)
Auto Sales - Domestic
102,902
108,604
(5.3)
101,118
1.8
204,020
214,662
(5.0)
Auto Sales - Exports
10,232
7,053
45.1
8,449
21.1
18,681
13,618
37.2
Total Auto Sales
113,134
115,657
(2.2)
109,567
3.3
222,701
228,280
(2.4)
Tractor Sales - Domestic
42,076
57,433
(26.7)
59,150
(28.9)
101,226
129,353
(21.7)
Tractor Sales - Exports
3,170
3,719
(14.8)
3,208
(1.2)
6,378
6,354
0.4
Total Tractor Sales
45,246
61,152
(26.0)
62,358
(27.4)
107,604
135,707
(20.7)
Source: Company, Angel Research
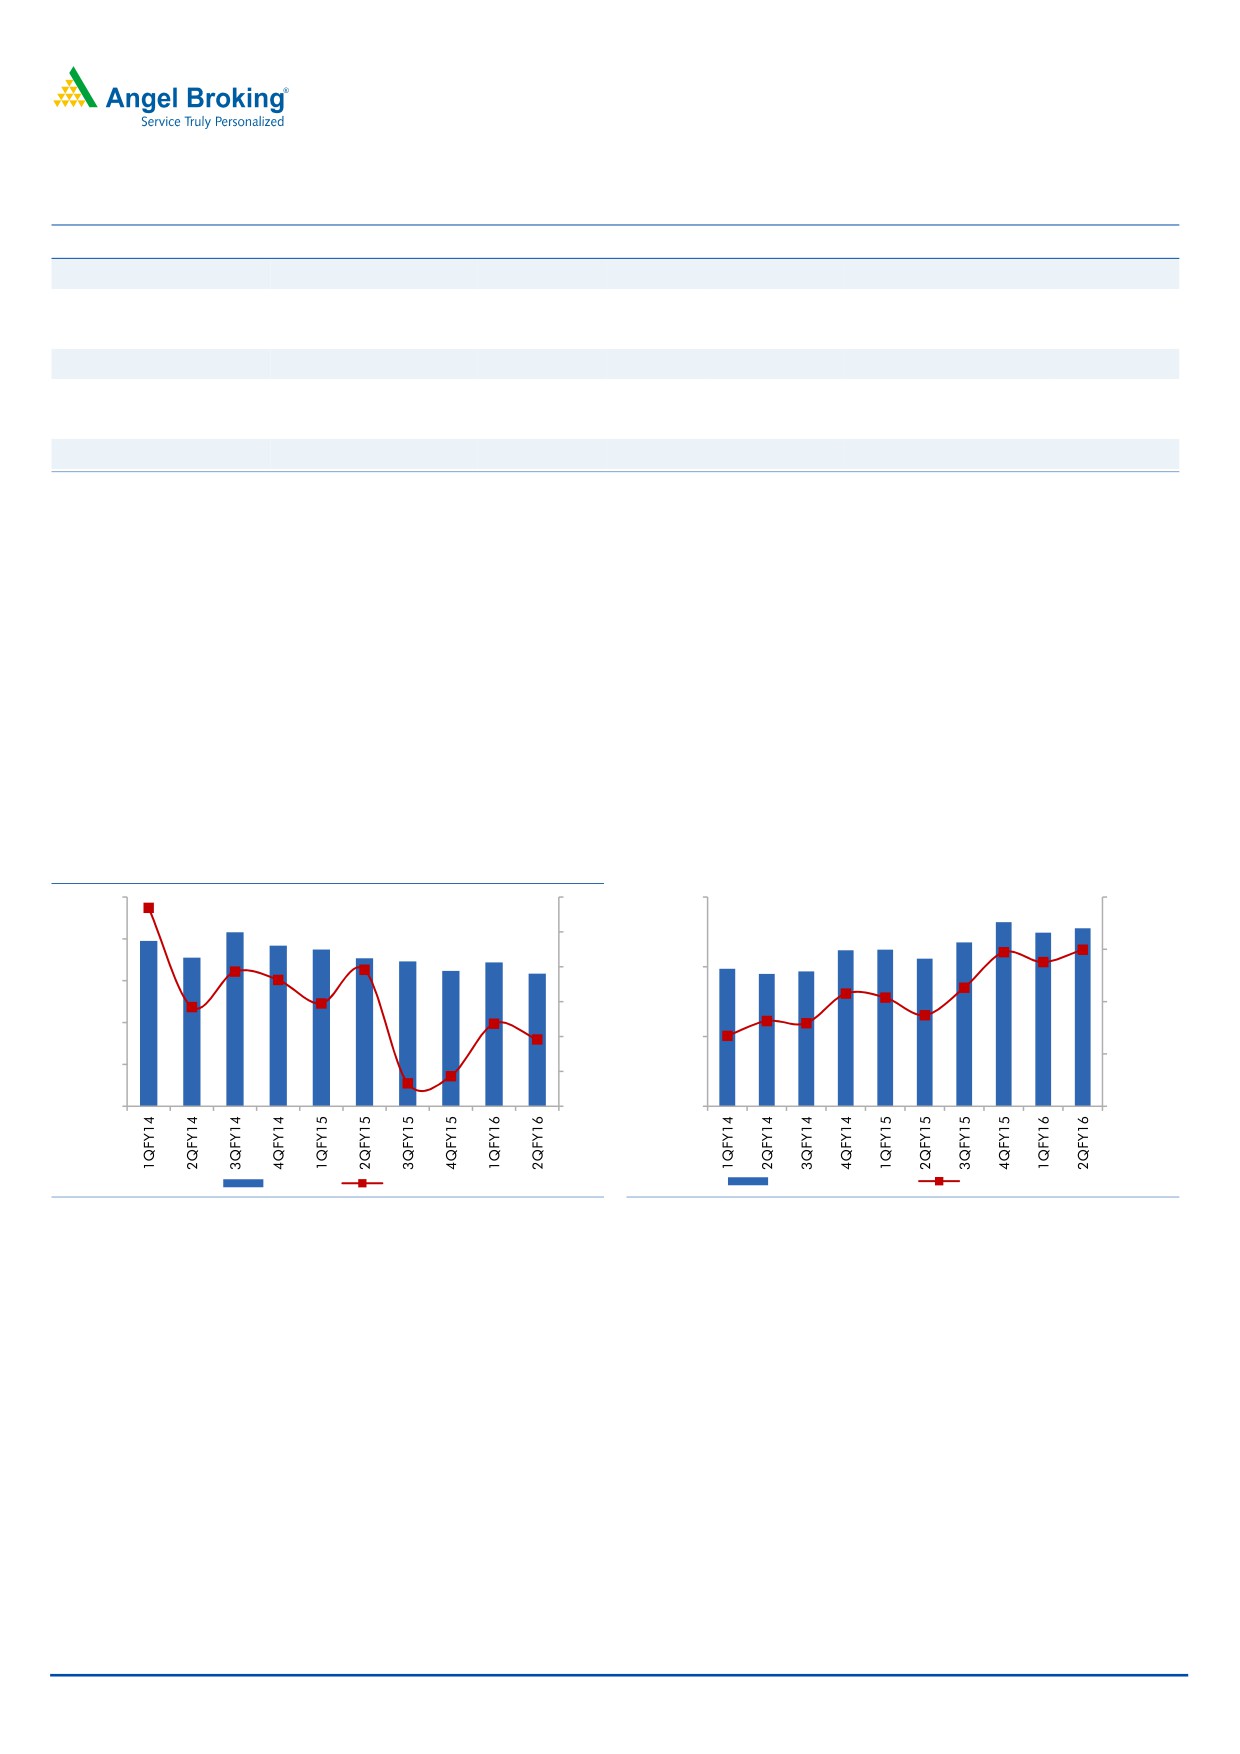
M&M’s volumes continued to remain under pressure, declining for the ninth
consecutive quarter. During 2QFY2016, overall volumes dipped 10% yoy.
Automotive volumes declined 2% yoy owing to continued market share loss in
the utility vehicles (UV) space and sluggishness in the three wheeler industry.
Tractor decline worsened to 26% yoy on account of poor sentiments due to
deficient rainfall and moderation in Minimum Support Prices (MSPs).
Realisation/vehicle grew 8% yoy to `5,55,227. Better product mix and price
hikes in both the farm and automotive segments boosted realizations.
Contribution/vehicle grew
16% yoy to
`179,895 on back of improved
realizations and benign commodity prices.
Exhibit 4: Volumes continue to decline
Exhibit 5: Realisation and contribution per vehicle trend
250,000
10
600,000
200,000
5
200,000
180,000
0
500,000
150,000
(5)
160,000
100,000
(10)
400,000
140,000
50,000
(15)
0
(20)
300,000
120,000
Volumes
Growth (%)
Realisation/vehicle
Contribution/vehicle
Source: Company, Angel Research
Source: Company, Angel Research
November 10, 2015
3
Mahindra & Mahindra | 2QFY2016 Result Update
Exhibit 6: Segmental performance
Y/E March (` cr)
2QFY16
2QFY15
% chg (yoy)
1QFY16
% chg (qoq)
1HFY15
1HFY14
% chg (yoy)
Total Net Sales
8,839
9,073
(2.6)
9,471
(6.7)
18,310
18,912
(3.2)
Auto segment
5,989
5,704
5.0
5,895
1.6
11,884
11,642
2.1
Farm segment
2,844
3,363
(15.4)
3,572
(20.4)
6,416
7,257
(11.6)
Other segments
5
6
(15.5)
4
41.3
9
13
(28.5)
Total PBIT
1,053
986
6.8
1,239
(14.9)
2,292
2,277
0.6
Auto segment
586
460
27.4
607
(3.4)
1,193
1,085
10.0
Farm segment
465
523
(11.1)
631
(26.3)
1,096
1,189
(7.8)
Other segments
2.0
3.0
(35.0)
0.5
286.3
2
3
(28.1)
PBIT/ Sales (%)
11.9
10.9
100 bp
13.1
(120) bp
12.5
12.0
50 bp
Auto segment
9.8
8.1
170 bp
10.3
(50) bp
10.0
9.3
70 bp
Farm segment
16.4
15.6
80 bp
17.7
(130) bp
17.1
16.4
70 bp
Other segments
36.4
47.3
13.3
26.8
26.7
Source: Company, Angel Research
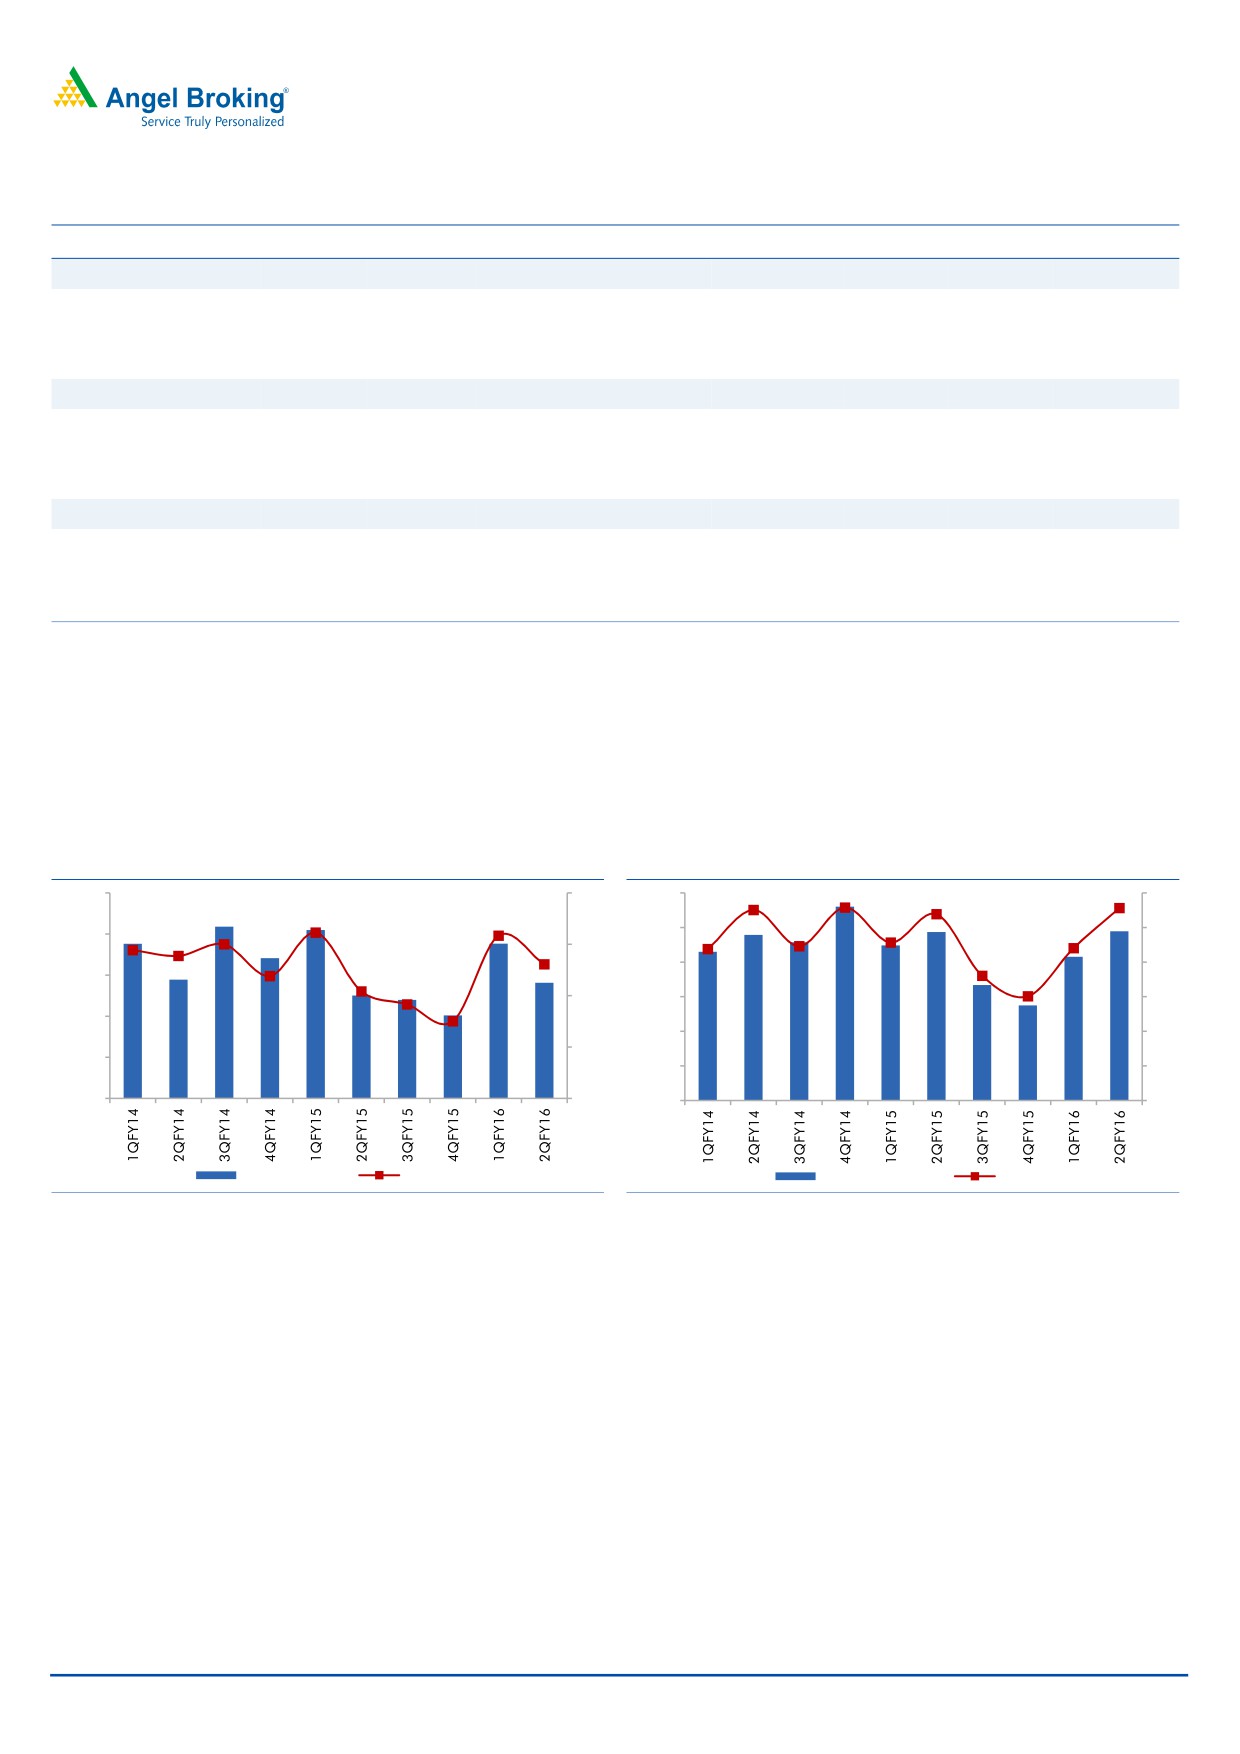
EBIDTA margins at 13.2%, improved 100bp yoy. Subdued commodity prices
and price hikes helped in margin improvement.
Despite the improvement in operating profits, the net profit at `978cr was flat
yoy. Higher depreciation expenses and taxation impacted the profitability.
Exhibit 7: EBITDA margin ahead of estimates
Exhibit 8: Net profit flat
1,600
16
1,200
12
10
1,000
1,400
14
800
8
1,200
12
600
6
1,000
400
4
10
800
200
2
600
8
0
0
EBIDTA (` cr)
Margin %
Net Profit (` cr)
Margin %
Source: Company, Angel Research
Source: Company, Angel Research
November 10, 2015
4
Mahindra & Mahindra | 2QFY2016 Result Update
Conference call - Key highlights
M&M expects the passenger vehicle (PV) industry growth in 2HFY2016 to
remain similar as the rate witnessed in 1HFY2016. It expects the industry to
grow at 6-7% in FY2016. Utility vehicle segment growth at 2-3% would be
slightly lower than the passenger vehicle industry.
Given the deficient rainfall for the second consecutive year and only a
moderate growth in MSPs, M&M has lowered the tractor industry FY2016
growth forecast from 5% growth in 1QFY2016 to -5% currently. M&M expects
the industry to grow in 2HFY2016 due to low base of corresponding period of
last year and limited impact on kharif production despite weak rainfall.
In order to strengthen presence in the UV space, M&M recently introduced
“TUV3OO”. Further, it aims to enter the compact utility vehicle space with the
launch of “S101” in January 2016. Given the new launches, M&M expects to
regain market share in the UV segment.
In order to improve market share in the LCV space, M&M recently launched
“Jeeto” in the sub-1-tonne segment. It also unveiled a 1.2 tonner vehicle
“Supro” to address the segment between the SCV (sub 1 tonne) and the pick
up space (2.5-3.5 tonne). The Management expects the LCV industry to
recover from 2HFY2016 given the recovery witnessed in MHCVs in the last
one year.
M&M’s Korean subsidiary Ssangyong Motor company (SYMC) has seen pick
up in volumes on back of success of the recently launched Tivoli. As against a
double-digit drop in 1QCY2015, SYMC volumes have swung in the positive
territory in the last four to five months. As a result 9MCY2015 (January 2015-
September 2015) volumes have been flat. SYMC is targeting to sell 1,45,000
units in CY2016, implying a growth of 3%.
Export growth continues to be strong with volumes growing by a robust 37% in
1HFY2016. Robust growth in key markets Sri Lanka, Bangladesh, Nepal and
Philippines boosted growth.
During 2QFY2016, M&M increased automotive prices by about 0.7%. The
tractor segment did not witness any pricing action.
M&M has maintained its capex guidance of `2,500cr per year over the next
two years. The amount would be majorly spent on new product introductions
and research and development.
November 10, 2015
5
Mahindra & Mahindra | 2QFY2016 Result Update
Investment arguments
Volume uptrend expected over the next two years: M&M is likely to witness
volume uptrend over the next two years (FY2016-17) driven by recovery in
both the automotive and the tractor segment. M&M would launch two new
products in the compact UV space beginning FY2016 (M&M has limited
presence in compact UVs which account for 40% of the UV industry), thus
likely enabling it to regain market share. It also plans to launch a small
commercial vehicle. Further, the other two key automotive segments - LCVs
and three-wheelers - are likely to recover given the improved economic
scenario.
The tractor segment is also expected to recover from 2HFY2016 on back of
improved sentiments and low base of the corresponding period of last year.
Further, with an improvement in the economy, the non-agri usage of tractors
is also likely to increase which would boost demand for tractors.
Investments constitute ~45% of total assets:
MM has presence in various
sectors through majority stakes in various listed companies, ie in sectors like
technology, hospitality, real estate and finance. The high growth potential of
M&M's subsidiaries has supported its valuation in the past and may continue
to do so in the long term as well. Investments constitute ~45% of M&M’s total
assets as of March 2014.
Outlook and valuation
M&M is likely to witness volume recovery from 2HFY2016 in both the automotive
and the tractor segment. In the automotive segment, M&M recently introduced TUV
3OO which has received encouraging response and plans to enter compact UV
space in January 2016 which will likely enable it to regain market share. Further,
the recently launched small commercial vehicle “Jeeto” and 1.2 tonner vehicle
“Supro” would boost the company’s share in the light commercial vehicle (LCV)
segment. We also believe that the tractor industry growth would revive from
2HFY2016 owing to the low base of the corresponding previous period and
relatively limited impact of deficient rainfall on kharif crop production. M&M’s PAT
is likely to grow at a CAGR of 9% over FY2015-FY2017. We have broadly retained
our earnings assumptions and maintain our “Accumulate” recommendation on the
stock with a revised SOTP based price target of `1,410.
November 10, 2015
6
Mahindra & Mahindra | 2QFY2016 Result Update
Exhibit 9: SOTP valuation
Particulars
Value/share
Remarks
Core business (MM+MVML)
1,041
At 16x FY2017 earnings
Key Subsidiaries
Tech Mahindra
248
Bloomberg Consensus target price
M&MFSL
122
2x its FY2017 Book value
Mahindra Lifespace
16
Market cap
Mahindra Holiday Resort
38
Market cap
Mahindra CIE
26
Market cap
Ssangyong
76
Market cap
Value of subsidiaries before discount
527
After holdings 30% discount
369
Target Price
1,410
Source: Company, Angel Research
Exhibit 10: Key assumptions
Y/E March (units)
FY2012
FY2013
FY2014
FY2015
FY2016E
FY2017E
Passenger Vehicles (UV+Verito)
220,115
279,270
229,155
210,021
216,322
242280
4-wheeler pick-up
152,691
174,233
177,587
158,957
163,726
180,098
Three wheelers
67,440
65,510
62,614
56,764
57,899
61,373
Truck & Bus
13,823
11,902
8,161
8,910
10,959
12,822
Exports
29,177
32,458
29,659
30,199
34,028
41,602
Total Automotive Sales
483,246
563,373
507,176
464,851
482,934
538,176
Domestic Tractor Sales
221,730
211,596
257,270
220,157
199,335
218,519
Exports Tractor Sales
13,722
12,289
10,364
13,866
14,975
17,222
Total Tractor Sales
235,452
223,885
267,634
234,023
214,310
235,741
Total Volume
718,698
787,257
774,810
698,874
697,243
773,917
Source: Company, Angel Research
Company background
Mahindra and Mahindra, the flagship company of the Mahindra Group, is the
largest manufacturer of UVs and tractors in India with an ~37% and ~42% market
share in these segments, respectively. The company is also the second largest
player in the light commercial vehicle space, with an ~37% market share. MM is
also the only company in India that is present across all the automotive segments.
It has an installed capacity of 6lakh and 2.3lakh units/year in the automotive and
farm equipment segments respectively. In FY2011, MM acquired
a 70% stake in Ssangyong Motor Co (SYMC), transforming itself into a global
UV player. Apart from the core auto business, the company has
subsidiaries/associates in various businesses such as IT, NBFC, auto ancillaries,
hospitality and infrastructure.
November 10, 2015
7
Mahindra & Mahindra | 2QFY2016 Result Update
Profit and loss statement
Y/E March (` cr)
FY12 FY13*
FY14*
FY15*
FY16E*
FY17E*
Total operating income
31,847
38,357
38,817
37,468
38,513
43,579
% chg
35.7
22.3
1.2
(3.5)
2.8
13.2
Total expenditure
28,083
33,027
33,569
32,865
33,259
37,588
Net raw material costs
23,500
27,439
26,920
25,727
26,032
29,590
Employee expenses
1,702
1,998
2,311
2,494
2,647
2,939
Other
2,881
3,590
4,338
4,645
4,580
5,059
EBITDA
3,764
5,329
5,248
4,603
5,254
5,991
% chg
9.0
28.4
(1.5)
(12.3)
14.1
14.0
(% of total op. income)
11.8
13.9
13.5
12.3
13.6
13.7
Depreciation & amortization
576
818
976
1,098
1,177
1,310
EBIT
3,188
5,081
4,937
4,325
4,931
5,661
% chg
4.9
28.2
(2.8)
(12.4)
14.0
14.8
(% of total op. income)
10.0
13.2
12.7
11.5
12.8
13.0
Interest and other charges
163
296
361
304
269
273
Other income
580
570
665
820
855
980
Recurring PBT
3,606
4,785
4,576
4,021
4,663
5,389
% chg
2.5
30.1
(4.4)
(12.1)
15.9
15.6
Extraordinary income/ (exp.)
(134)
91
53
336
0
0
PBT
3,472
4,875
4,629
4,357
4,663
5,389
Tax
727
1,241
724
934
1,179
1,347
(% of PBT)
20.9
25.5
15.6
21.4
25.3
25.0
PAT (reported)
2,879
3,634
3,905
3,423
3,484
4,042
ADJ. PAT
2,745
3,544
3,905
3,423
3,484
4,042
% chg
7.7
22.7
10.2
(12.3)
1.8
16.0
(% of total op. income)
8.6
9.2
10.1
9.1
9.0
9.3
Basic EPS (`)
48.9
59.2
63.4
55.6
56.6
65.6
Adj. EPS (`)
46.6
57.7
63.4
55.1
56.1
65.1
% chg
7.3
22.7
9.8
(13.1)
1.8
16.0
Note: * (MM + MVML)
November 10, 2015
8
Mahindra & Mahindra | 2QFY2016 Result Update
Balance sheet statement
Y/E March (` cr)
FY12
FY13*
FY14*
FY15*
FY16E*
FY17E*
SOURCES OF FUNDS
Equity share capital
295
295
295
296
296
296
Reserves & surplus
11,810
14,686
16,969
19,518
21,849
24,718
Shareholders’ Funds
12,105
14,981
17,265
19,813
22,144
25,014
Total loans
3,174
4,152
4,308
3,038
4,308
4,308
Deferred tax liability
527
756
1,051
1,151
1,151
1,151
Other long term liabilities
275
415
586
614
850
1,000
Long term provisions
363
478
557
655
578
654
Total Liabilities
16,444
20,782
23,767
25,271
29,031
32,126
APPLICATION OF FUNDS
Gross block
7,865
11,152
13,110
14,107
16,507
18,007
Less: Acc. depreciation
3,572
4,325
5,308
6,323
7,500
8,810
Net Block
4,293
6,827
7,801
7,784
9,007
9,197
Capital work-in-progress
795
919
1,254
2,297
1,254
1,254
Investments
10,297
10,894
10,464
12,179
13,379
14,379
Long term loans and adv.
1,477
2,087
3,018
3,834
3,081
3,486
Other noncurrent assets
36
504
416
104
104
89
Current assets
6,871
8,782
10,595
9,089
12,024
14,831
Cash
1,188
1,823
3,141
2,105
4,613
6,430
Loans & advances
1,396
827
1,031
808
1,001
1,133
Other
4,287
6,132
6,422
6,176
6,409
7,267
Current liabilities
7,326
9,232
9,782
10,014
9,818
11,109
Net current assets
(454)
(450)
813
(925)
2,206
3,722
Misc. exp. not written off
-
-
-
Total Assets
16,444
20,782
23,767
25,271
29,031
32,126
Note: * (MM + MVML)
November 10, 2015
9
Mahindra & Mahindra | 2QFY2016 Result Update
Cash flow statement
Y/E March (` cr)
FY12 FY13*
FY14*
FY15* FY16E* FY17E*
Profit before tax
3,472
4,785
4,576
4,021
4,663
5,389
Depreciation
576
583
984
1,015
1,177
1,310
Change in working capital
(484)
1,747
55
697
(623)
302
Others
479
(121)
(593)
(373)
911
(164)
Other income
(580)
-
Direct taxes paid
(727)
(1,241)
(724)
(934)
(1,179)
(1,347)
Cash Flow from Operations
2,735
5,753
4,299
4,427
4,949
5,489
(Inc.)/Dec. in fixed assets
(1,915)
(1,441)
(2,292)
(2,040)
(1,357)
(1,500)
(Inc.)/Dec. in investments
(1,372)
(1,420)
430
(1,714)
(1,200)
(1,000)
Other income
580
-
Cash Flow from Investing
(2,707)
(2,861)
(1,863)
(3,754)
(2,557)
(2,500)
Issue of equity
24
-
Inc./(Dec.) in loans
853
67
156
(1,270)
1,270
-
Dividend paid (Incl. Tax)
803
(894)
(966)
(966)
(1,153)
(1,172)
Others
(1,135)
(1,533)
Cash Flow from Financing
545
(2,360)
(810)
(2,235)
117
(1,172)
Inc./(Dec.) in cash
574
532
1,626
(1,563)
2,508
1,817
Opening Cash balances
615
1,291
1,823
3,141
2,105
4,613
Closing Cash balances
1,188
1,823
3,141
2,105
4,613
6,430
Note: * (MM + MVML)
November 10, 2015
10
Mahindra & Mahindra | 2QFY2016 Result Update
Key ratios
Y/E March
FY12
FY13*
FY14*
FY15*
FY16E*
FY17E*
Valuation Ratio (x)
P/E (on FDEPS)
27.7
21.7
19.8
22.8
22.4
19.3
P/CEPS
24.8
17.7
15.8
17.2
16.7
14.6
P/BV
7.1
5.1
4.5
3.9
3.5
3.1
Dividend yield (%)
1.0
1.0
1.1
1.1
1.3
1.3
EV/Sales
2.5
2.0
2.0
2.0
2.0
1.7
EV/EBITDA
20.9
14.7
14.6
16.6
14.5
12.4
EV / Total Assets
4.8
3.8
3.2
3.0
2.6
2.3
Per Share Data (`)
EPS (Basic)
45.3
57.7
63.4
55.1
56.1
65.1
EPS (fully diluted)
43.4
57.7
63.4
55.1
56.1
65.1
Cash EPS
50.5
71.0
79.3
72.8
75.0
86.2
DPS
12.0
13.0
14.0
13.9
16.0
16.3
Book Value
175.4
244.0
280.3
319.0
356.5
402.7
Dupont Analysis
EBIT margin
13.0
13.2
12.7
11.5
12.8
13.0
Tax retention ratio
0.7
0.7
0.8
0.8
0.7
0.8
Asset turnover (x)
2.1
2.0
1.9
1.6
1.6
1.7
ROIC (Post-tax)
20.5
20.0
20.2
14.7
15.1
16.5
Cost of Debt (Post Tax)
2.1
5.3
7.1
7.9
4.7
4.7
Leverage (x)
(0.6)
(0.6)
(0.5)
(0.6)
(0.6)
(0.7)
Operating ROE
9.4
11.6
13.1
10.8
8.6
8.8
Returns (%)
ROCE (Pre-tax)
24.8
24.4
20.8
17.1
17.0
17.6
Angel ROIC (Pre-tax)
17.7
26.8
23.9
18.7
20.2
22.0
ROE
28.1
23.7
22.6
17.3
15.7
16.2
Turnover ratios (x)
Asset Turnover (Gross Block)
4.2
3.4
3.0
2.7
2.3
2.4
Inventory / Sales (days)
22
29
30
27
28
28
Receivables (days)
20
21
24
25
25
25
Payables (days)
63
79
81
86
81
81
WC cycle (ex-cash) (days)
(21)
(28)
(28)
(33)
(28)
(28)
Solvency ratios (x)
Net debt to equity
(0.7)
(0.6)
(0.5)
(0.6)
(0.6)
(0.7)
Net debt to EBITDA
(2.1)
(1.6)
(1.8)
(2.4)
(2.6)
(2.8)
Interest Coverage (EBIT / Int.)
41.9
17.1
13.7
14.2
18.3
20.8
Note: * (MM + MVML)
November 10, 2015
11
Mahindra & Mahindra | 2QFY2016 Result Update
Research Team Tel: 022 - 39357800
DISCLAIMER
Angel Broking Private Limited (hereinafter referred to as “Angel”) is a registered Member of National Stock Exchange of India Limited,
Bombay Stock Exchange Limited and Metropolitan Stock Exchange of India Limited. It is also registered as a Depository Participant with
CDSL and Portfolio Manager with SEBI. It also has registration with AMFI as a Mutual Fund Distributor. Angel Broking Private Limited is
a registered entity with SEBI for Research Analyst in terms of SEBI (Research Analyst) Regulations, 2014 vide registration number
INH000000164. Angel or its associates has not been debarred/ suspended by SEBI or any other regulatory authority for accessing
/dealing in securities Market. Angel or its associates including its relatives/analyst do not hold any financial interest/beneficial
ownership of more than 1% in the company covered by Analyst. Angel or its associates/analyst has not received any compensation /
managed or co-managed public offering of securities of the company covered by Analyst during the past twelve months. Angel/analyst
has not served as an officer, director or employee of company covered by Analyst and has not been engaged in market making activity
of the company covered by Analyst.
This document is solely for the personal information of the recipient, and must not be singularly used as the basis of any investment
decision. Nothing in this document should be construed as investment or financial advice. Each recipient of this document should
make such investigations as they deem necessary to arrive at an independent evaluation of an investment in the securities of the
companies referred to in this document (including the merits and risks involved), and should consult their own advisors to determine
the merits and risks of such an investment.
Reports based on technical and derivative analysis center on studying charts of a stock's price movement, outstanding positions and
trading volume, as opposed to focusing on a company's fundamentals and, as such, may not match with a report on a company's
fundamentals.
The information in this document has been printed on the basis of publicly available information, internal data and other reliable
sources believed to be true, but we do not represent that it is accurate or complete and it should not be relied on as such, as this
document is for general guidance only. Angel Broking Pvt. Limited or any of its affiliates/ group companies shall not be in any way
responsible for any loss or damage that may arise to any person from any inadvertent error in the information contained in this report.
Angel Broking Pvt. Limited has not independently verified all the information contained within this document. Accordingly, we cannot
testify, nor make any representation or warranty, express or implied, to the accuracy, contents or data contained within this document.
While Angel Broking Pvt. Limited endeavors to update on a reasonable basis the information discussed in this material, there may be
regulatory, compliance, or other reasons that prevent us from doing so.
This document is being supplied to you solely for your information, and its contents, information or data may not be reproduced,
redistributed or passed on, directly or indirectly.
Neither Angel Broking Pvt. Limited, nor its directors, employees or affiliates shall be liable for any loss or damage that may arise from
or in connection with the use of this information.
Note: Please refer to the important ‘Stock Holding Disclosure' report on the Angel website (Research Section). Also, please refer to the
latest update on respective stocks for the disclosure status in respect of those stocks. Angel Broking Pvt. Limited and its affiliates may
have investment positions in the stocks recommended in this report.
Disclosure of Interest Statement
Mahindra & Mahindra
1. Analyst ownership of the stock
No
2. Angel and its Group companies ownership of the stock
No
3. Angel and its Group companies' Directors ownership of the stock
No
4. Broking relationship with company covered
No
Note: We have not considered any Exposure below ` 1 lakh for Angel, its Group companies and Directors
Ratings (Based on expected returns
Buy (> 15%)
Accumulate (5% to 15%)
Neutral (-5 to 5%)
over 12 months investment period):
Reduce (-5% to -15%)
Sell (< -15)
November 10, 2015
12