4QFY2016 Result Update | Tyre
30 October 2015
MRF
ACCUMULATE
CMP
`39,692
Performance Highlights
Target Price
`45,575
Y/E Sept. (` cr)
4QFY2016* 4QSY2014
% chg (yoy) 3QFY2016
% chg (qoq)
Investment Period
12 Months
Net sales
3,330
3,337
(0.2)
3,312
0.5
EBITDA
778
489
59.1
630
23.5
Stock Info
EBITDA margin (%)
23.4
14.7
872bp
19.0
435bp
Reported PAT
461
230
100.1
333
38.5
Sector
Tyre
Source: Company, Angel Research; Note: *The company has extended the current financial year
Market Cap (Rs cr)
16,834
by six months, ie up to 31 March 2016.
Net Debt
(807)
For 4QFY2016, MRF beat our estimates on the EBITDA and bottom-line fronts.
Beta
1.1
The top-line for the quarter remained flat on a yoy basis at `3,330cr (it declined
52 Week High / Low
46405/30750
marginally by 0.9% yoy). Raw material cost as a percentage of sales declined by
Avg. Daily Volume
2,388
589bp yoy to 53.6%, thus aiding EBITDA margin expansion by 530bp yoy to
Face Value (Rs)
10
23.4%. Depreciation expense grew by 12.2% yoy to `125cr and other income grew
BSE Sensex
26,657
by 209.3% yoy to `77cr. As a result, the net profit jumped by 45.4% yoy to `461cr.
Nifty
8,066
Replacement market demand affected by Chinese imports, OEM recovery to
Reuters Code
MRF.BO
continue: The recovery in demand from OEMs has been slow despite better
Bloomberg Code
MRF IN
numbers from the MHCV side. This is because 2W/3W and tractor performance
has been sub-par due to deficient monsoons and dampened rural sentiments.
Additionally, surge in import of cheaper Chinese tyres is eating into the share of
Shareholding Pattern (%)
domestic players, including MRF, in the TBR replacement market. However
Promoters
27.4
recovery is expected in MHCV replacement cycle on the back of strong OEM sales
MF / Banks / Indian Fls
10.3
in the last one year. We expect MRF to benefit from its diversified product portfolio
and strong presence in the replacement market across all segments.
FII / NRIs / OCBs
8.7
Indian Public / Others
53.6
Low rubber prices to aid margins: During 4QFY2016, the price of rubber in the
domestic market declined by 5.9% yoy to `118/kg; rubber currently trades at
~`114/kg in the domestic market. Considering the high global inventory levels,
Abs. (%)
3m 1yr 3yr
cheaper synthetic rubber and lower demand from China, we expect rubber prices to
Sensex
(2.6)
(1.0)
44.0
remain at lower levels. This will help the company in maintaining its EBITDA margin.
MRF
3.1
31.1
309.0
Outlook and valuation: We expect net sales to be at `14,488cr in FY2017E, while
the EBITDA margin is expected to be at 21.1% in FY2017E. On the back of better
margins, the net profit is expected to be at `1,611cr in FY2017E. At the current
3-year daily price chart
market price, MRF is trading at a PE of 10.5x its FY2017E earnings and at a P/BV
50,000
of 2.0x for FY2017E. We have an Accumulate rating on the stock with a target
40,000
price of `45,575 based on a target P/E of 12.0x for FY2017E.
30,000
Key Financials (Standalone)
20,000
Y/E March (` cr)
SY2013
SY2014
FY2016E*
FY2017E
10,000
Net Sales
12,131
13,198
20,316
14,488
% chg
2.2
8.8
53.9
(28.7)
0
Net Profit
802
898
2,328
1,611
% chg
40.2
11.9
159.2
(30.8)
EBITDA (%)
14.6
14.6
21.4
21.1
Source: Company, Angel Research
EPS (`)
1,892
2,117
5,488
3,798
P/E (x)
21.0
18.7
7.2
10.5
P/BV (x)
4.6
3.7
2.5
2.0
RoE (%)
24.7
22.0
41.1
21.2
RoIC (%)
28.3
28.8
62.6
36.5
Milan Desai
EV/Sales (x)
1.4
1.3
0.8
1.0
+91- 22- 3935 7800 Ext: 6846
EV/EBITDA (x)
9.7
8.8
3.6
4.9
Source: Company, Angel Research; Note: *The company has extended the current financial year
by six months, ie up to 31 March 2016.
Please refer to important disclosures at the end of this report
1
MRF | 4QFY2016 Result Update
Exhibit 1: 4QFY2016 performance
Y/E Sept (` cr)
4QFY16
4QSY14
yoy chg (%)
3QFY16
qoq chg (%)
SY2015
SY2014
% chg
Net Sales
3,330
3,361
(0.9)
3,539
(5.9)
13,533
13,198
2.5
Net raw material
1,784
1,999
(10.8)
1,941
(8.1)
7,568
8,379
(9.7)
(% of Sales)
53.6
59.5
(589)bp
54.9
55.9
63.5
Staff Costs
212
180
17.8
216
(1.7)
830
733
13.3
(% of Sales)
6.4
5.4
102bp
6.1
6.1
5.6
Other Expenses
555
574
(3.4)
570
(2.7)
2,290
2,158
6.1
(% of Sales)
16.7
17.1
(42)bp
16.1
16.9
16.3
Total Expenditure
2,551
2,754
(7.3)
2,728
(6.5)
10,688
11,270
(5.2)
Operating Profit
778
608
28.1
811
(4.1)
2,846
1,928
47.6
OPM
23.4
18.1
530bp
22.9
45bp
21.0
14.6
642bp
Interest
53
56
52
229
232
Depreciation
125
111
117
467
423
Other Income
77
25
209.3
32
155
66
PBT
678
465
45.8
674
0.5
2,305
1,339
72.2
(% of Sales)
20.4
13.8
19.0
17.0
10.1
Tax
217
148
46.6
227
(4.5)
742
441
68.2
(% of PBT)
32.0
31.8
33.7
32.2
32.9
Extraordinary income
-
-
-
-
-
Reported PAT
461
317
45.4
447
3.1
1,564
898
74.2
PATM
13.8
9.4
12.6
11.6
6.8
Adjusted PAT
461
317
45.4
447
3.1
1,564
898
74.2
Equity capital (cr)
4
4
4
4
4
EPS (`)
1,087
747
45.4
1,054
3.1
3,688
2,118
74.2
Source: Company, Angel Research
Exhibit 2: Actual vs. Estimate (4QFY2016)
Particulars (` cr)
Actual
Estimate
Variation (%)
Total Income
3,330
3,425
(2.8)
EBIDTA
778
639
21.7
EBIDTA margin (%)
23.4
18.7
25.2
Adjusted PAT
461
326
41.1
Source: Company, Angel Research
Top-line below our expectation.
MRF’s top-line for the quarter remained flat on a yoy basis at `3,330cr (it declined
marginally by 0.9% yoy), which is 2.8% lower than our estimate of `3,425cr. The
Indian tyre sector continues to face the heat from cheaper Chinese imports that
have flooded the Indian market in the TBR segment. The flat top-line performance
for the quarter could be partially attributable to this factor. Additionally passing on
of raw material cost benefits to OEMs may have added to the decline in
realizations.
30 October 2015
2
MRF | 4QFY2016 Result Update
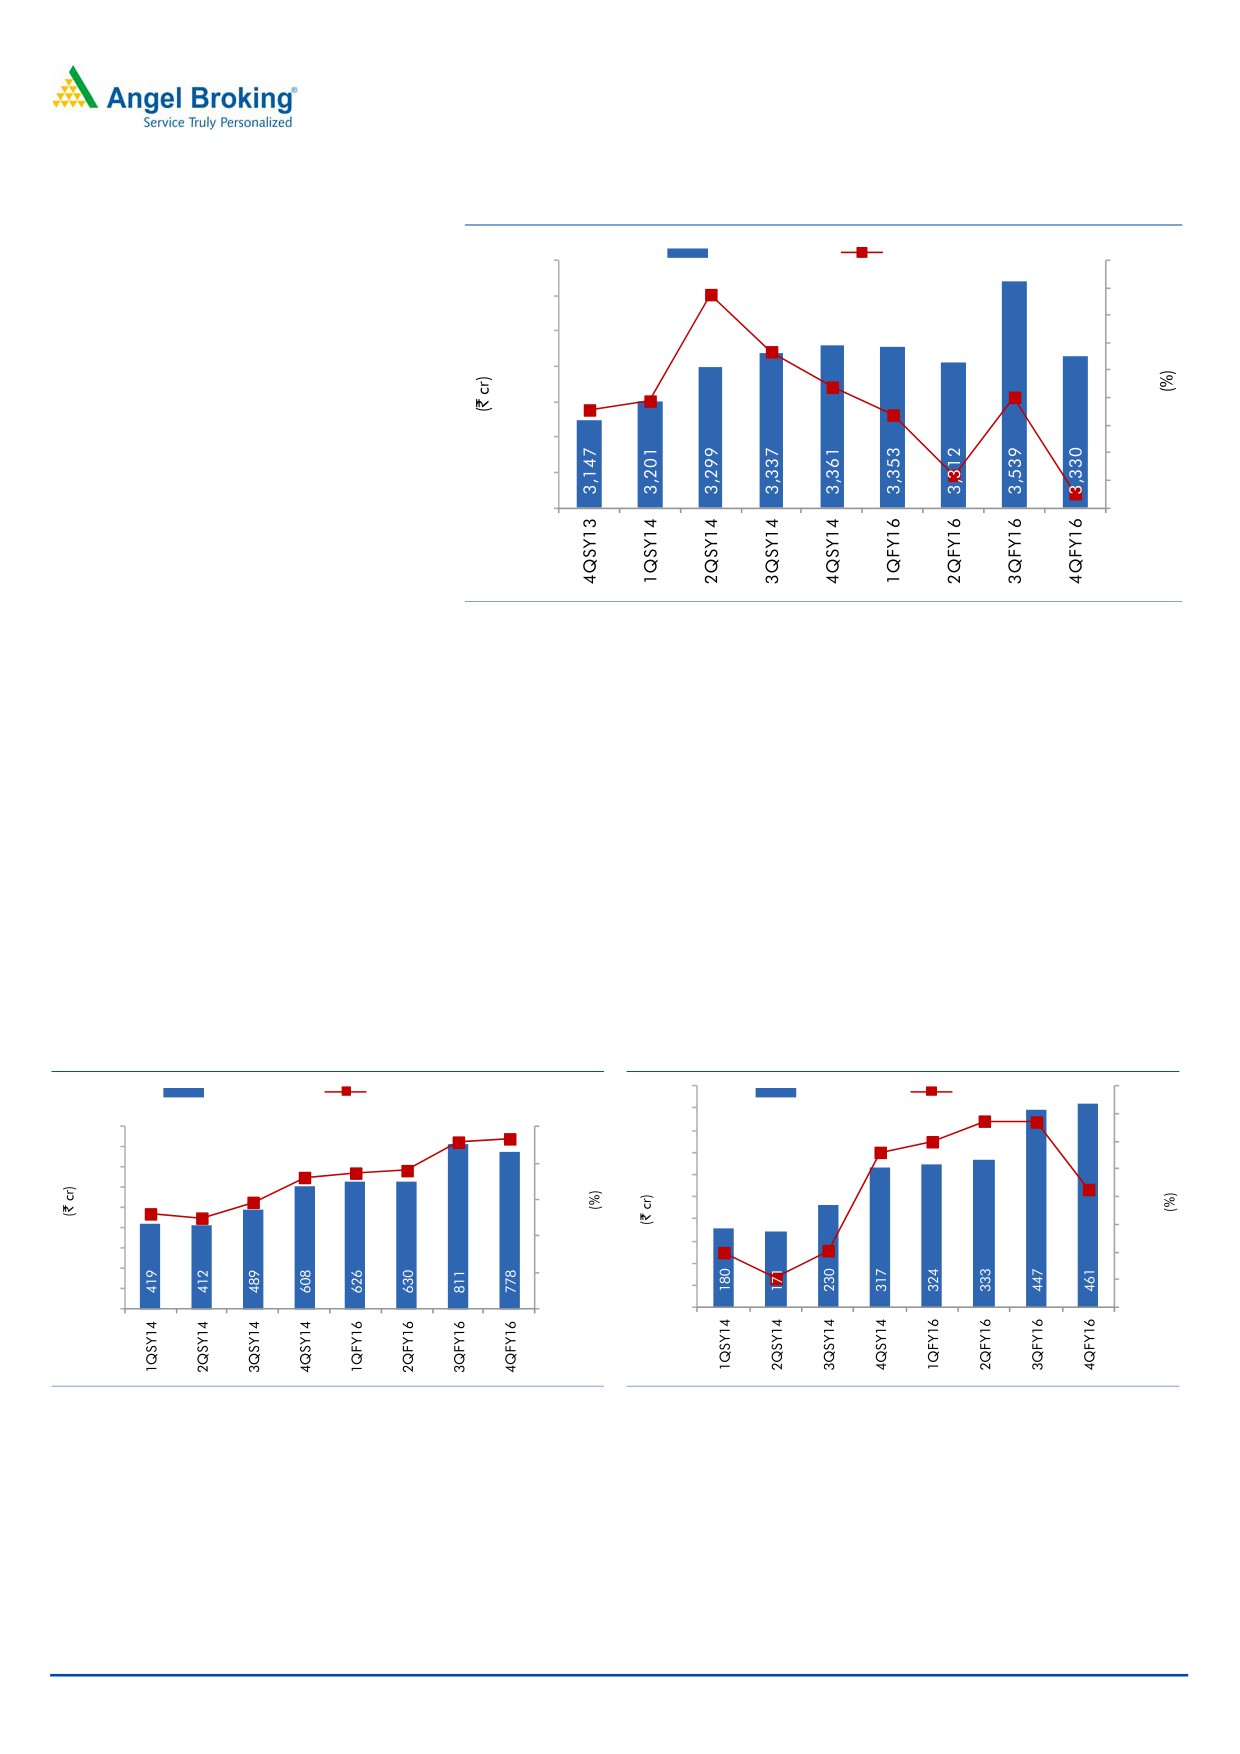
Exhibit 3: Quarterly revenue trend
Revenue (LHS)
yoy growth (RHS)
3600
16.0
14.0
3500
13.5
12.0
3400
10.0
9.4
3300
6.8
8.0
5.8
6.1
3200
5.1
6.0
4.8
4.0
3100
2.0
3000
0.4
(0
.9)-
2900
(2.0)
Source: Company, Angel Research
Margins impress resulting in higher bottom-line
A decline in raw material prices in the latter two months of the past quarter aided
in EBITDA margin expansion by 530bp yoy to 23.4% in 4QFY2016. We had
estimated for an EBITDA margin of 18.7%; the deviation from our estimate was
largely caused by a decline in raw material cost as a percentage of sales. Currently
natural rubber trades at
~`118/kg and
~`98/kg in the domestic and
international markets, respectively. Additionally, other raw materials which are
derived from crude oil are trading at lower levels, owing to weaker crude prices.
Employee and other expenses as a percentage of sales were mostly stable. The
other income grew by 209.3% yoy to `77cr and as a result, the net profit jumped
by 45.4% yoy to `461cr.
Exhibit 4: Lower RM costs aid EBITDA
Exhibit 5: ...thus leading to net profit growth
500
120.0
EBITDA (LHS)
EBITDA margin (RHS)
PAT (LHS)
yoy growth (RHS)
450
22.9
23.4
100.0
900
25.0
94.1
400
94.7
79.8
80.0
800
18.7
19.0
18.1
350
700
20.0
72.1
60.0
14.7
300
45.
4
600
13.1
12.5
15.0
250
40.0
500
200
400
20.0
10.0
150
1.3
300
(0.2)
-
200
100
5.0
(20.0)
100
50
(18.9)
0
-
0
(40.0)
Source: Company, Angel Research
Source: Company, Angel Research
30 October 2015
3
MRF | 4QFY2016 Result Update
Investment rationale
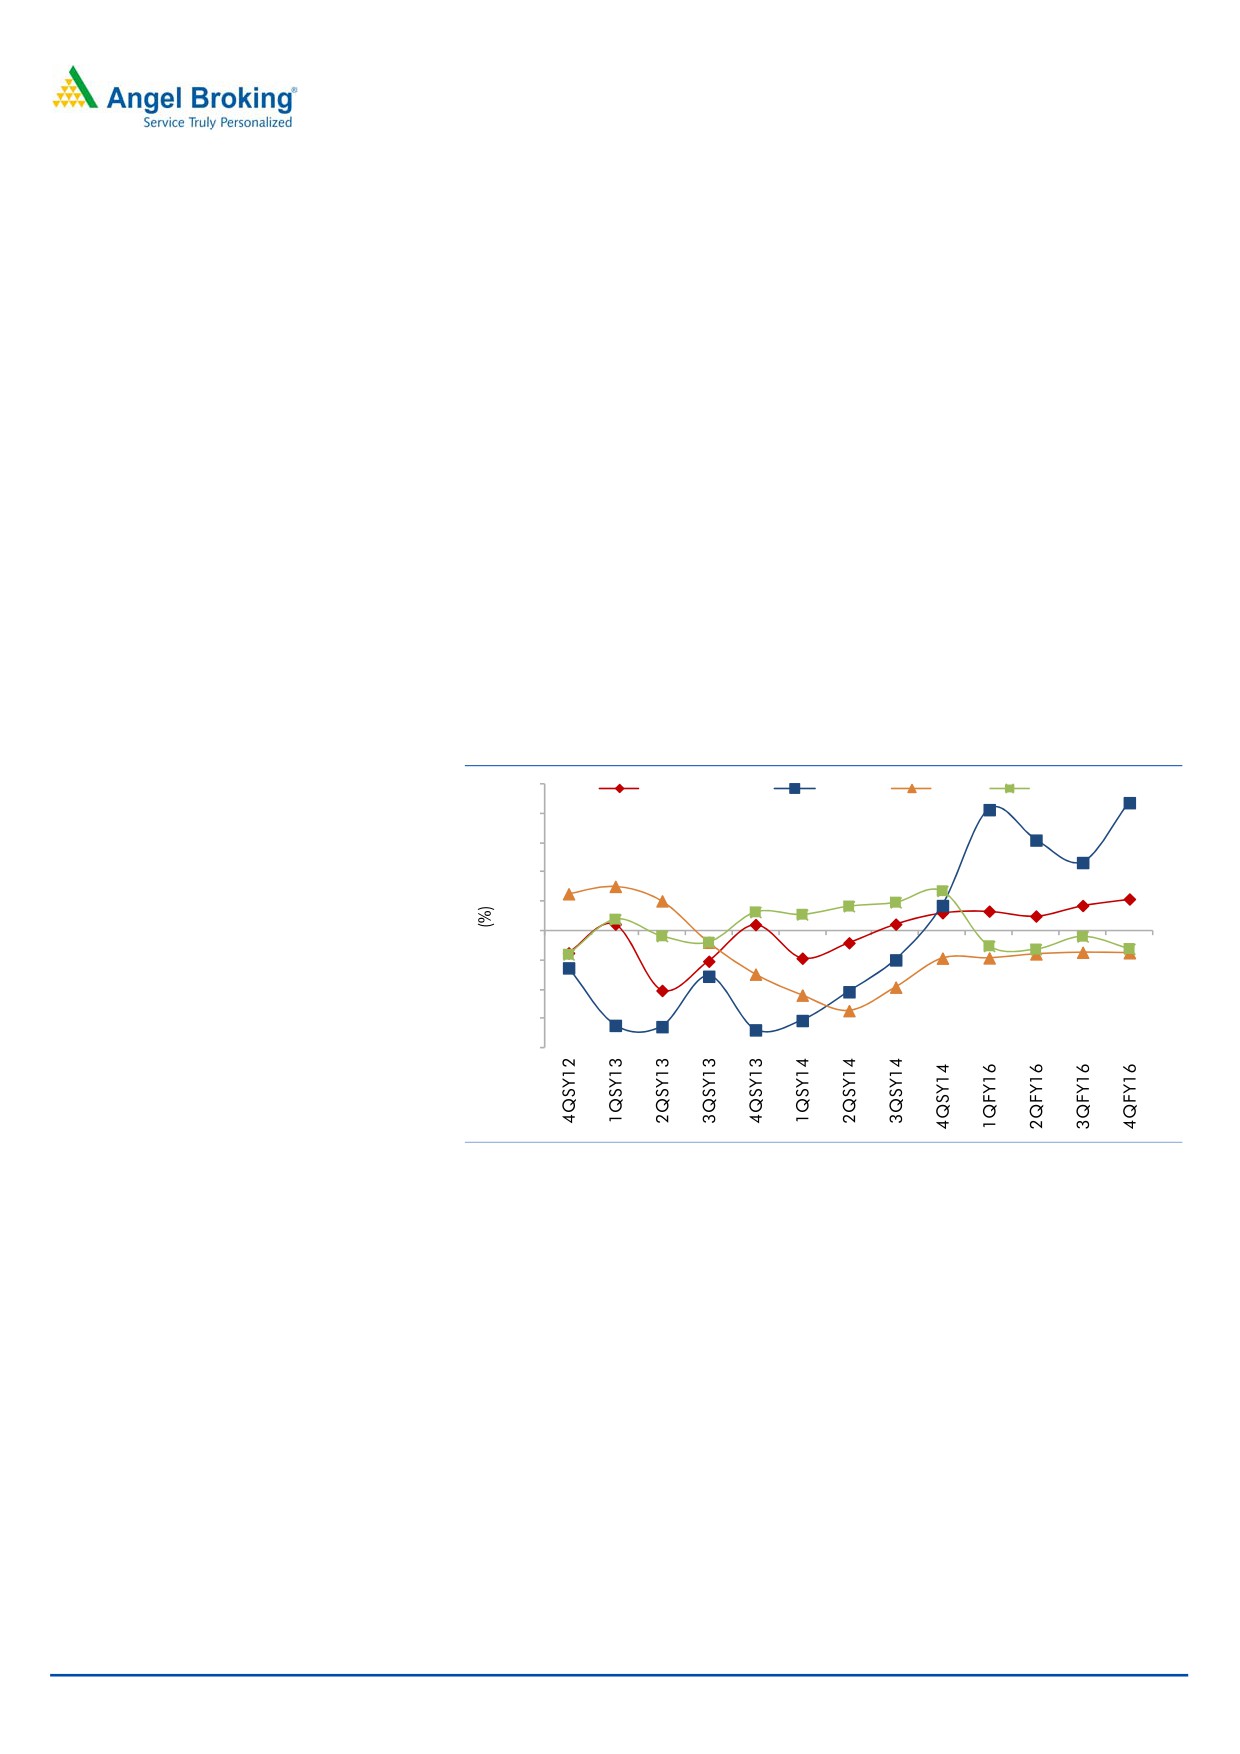
Replacement market demand affected by Chinese imports; OEM
recovery to continue
In the past 4 quarters the MHCV and passenger car segments have posted strong
numbers. However tractors, motorcycles and LCVs have disappointed. We expect
the recovery in these segments to be at a slower pace. Cheaper Chinese tyres have
infiltrated the Indian markets and have hurt replacement market sales of local
players, especially in the TBR segment. However, we expect a recovery in the
MHCV replacement cycle on the back of strong OEM sales in the last one year. We
believe that MRF has a diversified product mix along with a leading position in the
replacement tyre market which should enable it to maintain its market share and
traverse through the bumpy road in the near term. As far as replacement demand
for other segments is concerned, our dealer checks in the recent past have
indicated that Chinese tyres are a less of a threat in the passenger and motorcycle
tyre segments. Also, dealers raved about the quality of MRF tyres and claimed they
enjoy customer preference due to their longer life vis-a-vis competitors’ tyres.
Exhibit 6: Domestic vehicle sales trend
50
Passanger Car
MHCV
LCV
Motor Cycle
40
43.6
30
20
10
10.8
0
(6.2)
(10)
(7.5)
(20)
(30)
(40)
Source: Company, Angel Research
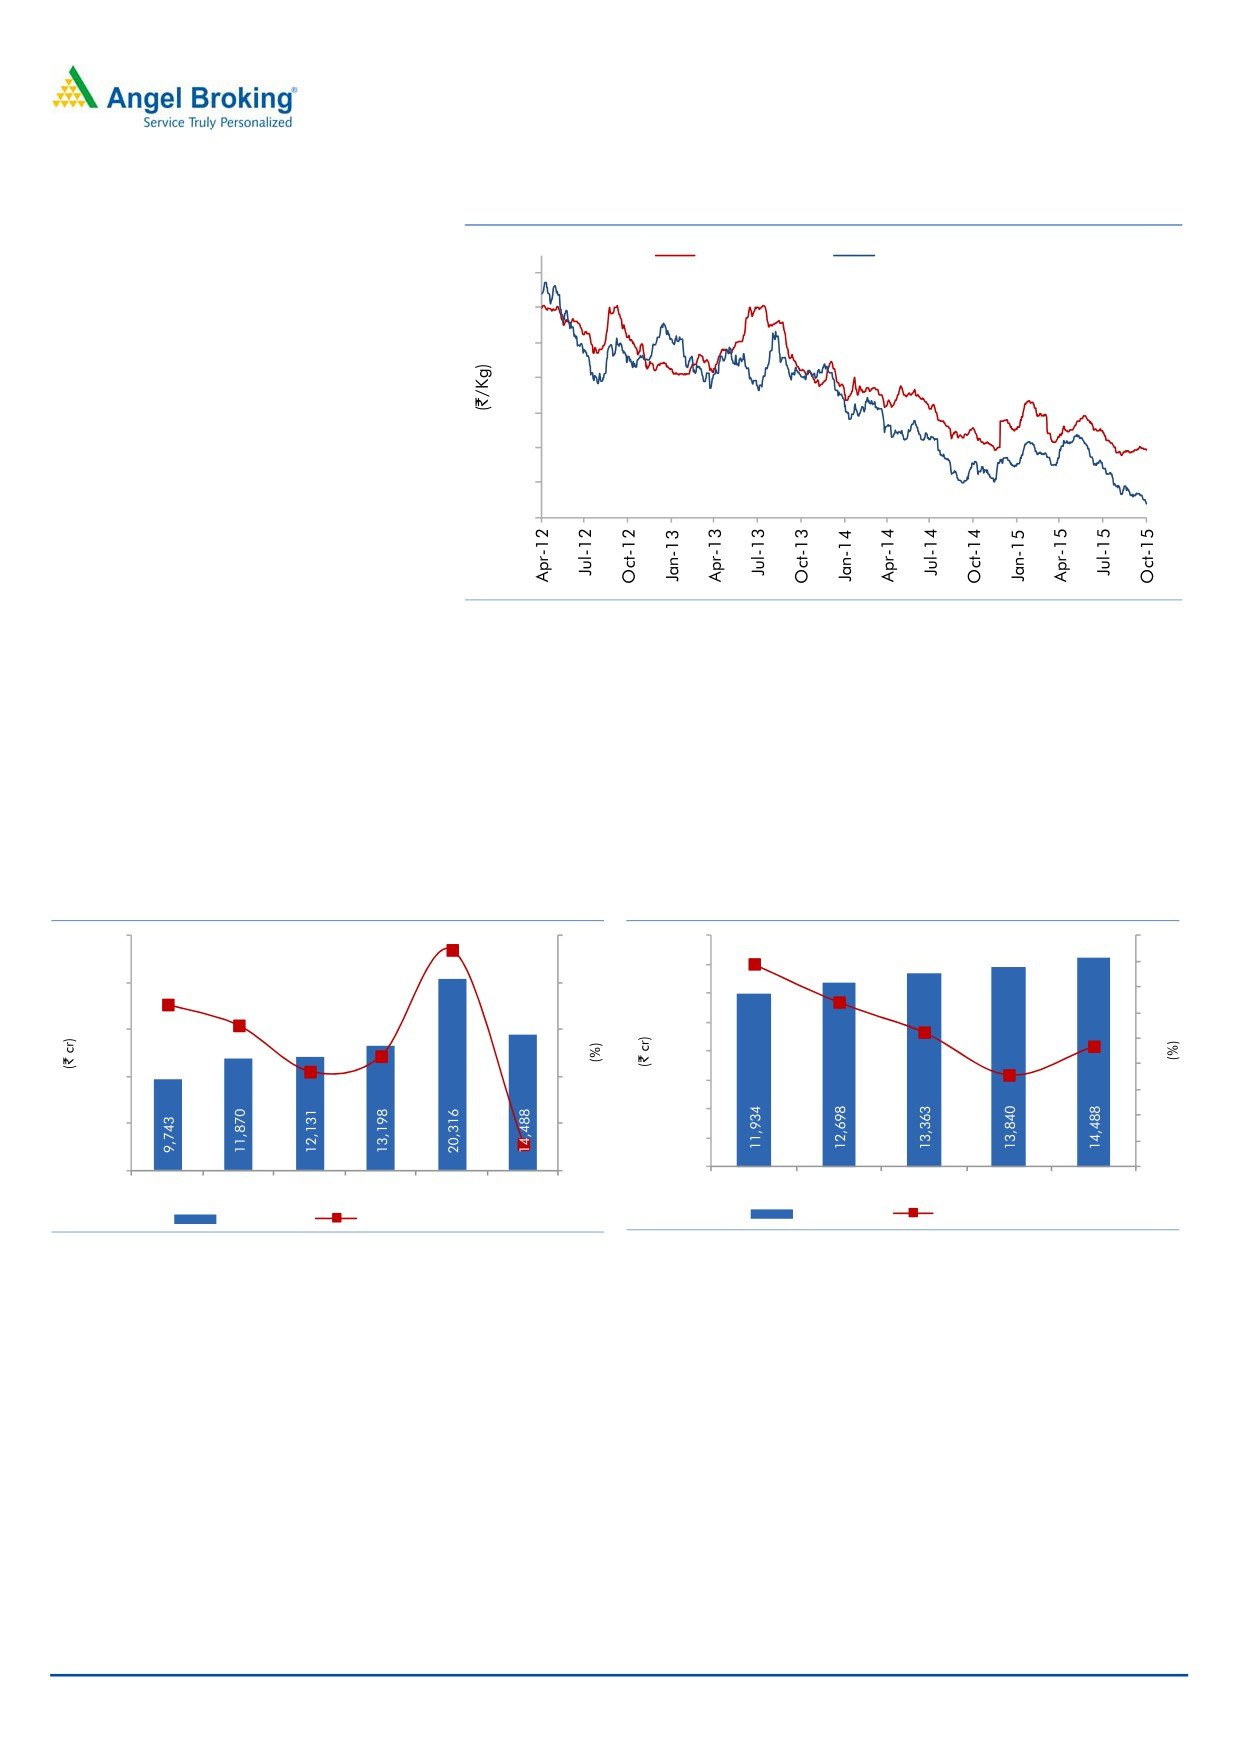
Lower rubber prices to help in sustaining EBITDA margin
MRF’s margin expansion during the quarter has been mostly due to lower raw
material prices. The prices of both, Styrene Butadiene Rubber (SBR) and Natural
Rubber (NR), have corrected on account of weakness in crude and global NR
prices. The prices of SBR feedstock, butadiene and natural rubber are likely to
remain at current levels owing to higher global inventory of both crude and NR.
Domestic NR prices have corrected by 14.6% yoy to `124/kg in the past four
quarters while international NR prices have dropped by 14.8% yoy. Currently,
domestic NR trades at `114kg.
30 October 2015
4
MRF | 4QFY2016 Result Update
Exhibit 7: Domestic and International rubber price trends
Domestic Price
International Price
215
195
175
155
135
115
114
95
75
83
Source: Angel Research
Financials
Revenue to grow at slower rate
Owing to subdued demand for LCVs, motorcycles and tractors; and on account of
lower realizations, the top-line is expected to be at `20,316cr for FY2016E (18
month sales) and `14,488cr in FY2017E.
Exhibit 8: Sales trend
Exhibit 9: Adjusted sales comparison
25,000
60
16,000
9
7.9
53.9
14,000
8
20,000
40
7
30.7
12,000
6.4
6
15,000
21.8
20
10,000
5.2
5
8.8
2.2
8,000
3.6
4.7
4
10,000
0
6,000
3
4,000
2
5,000
(20)
(2
8.7)
2,000
1
0
(40)
0
0
SY2011
SY2012
SY2013
SY2014
FY2016E* FY2017E
FY2013
FY2014
FY2015
FY2016E
FY2017E
Revenue (LHS)
Revenue growth (RHS)
Revenue (LHS)
Revenue growth (RHS)
Source: Company, Angel Research; Note:*FY2016E will have 18 months
Source: Company, Angel Research
and hence, numbers post SY2014 are not comparable
30 October 2015
5
MRF | 4QFY2016 Result Update
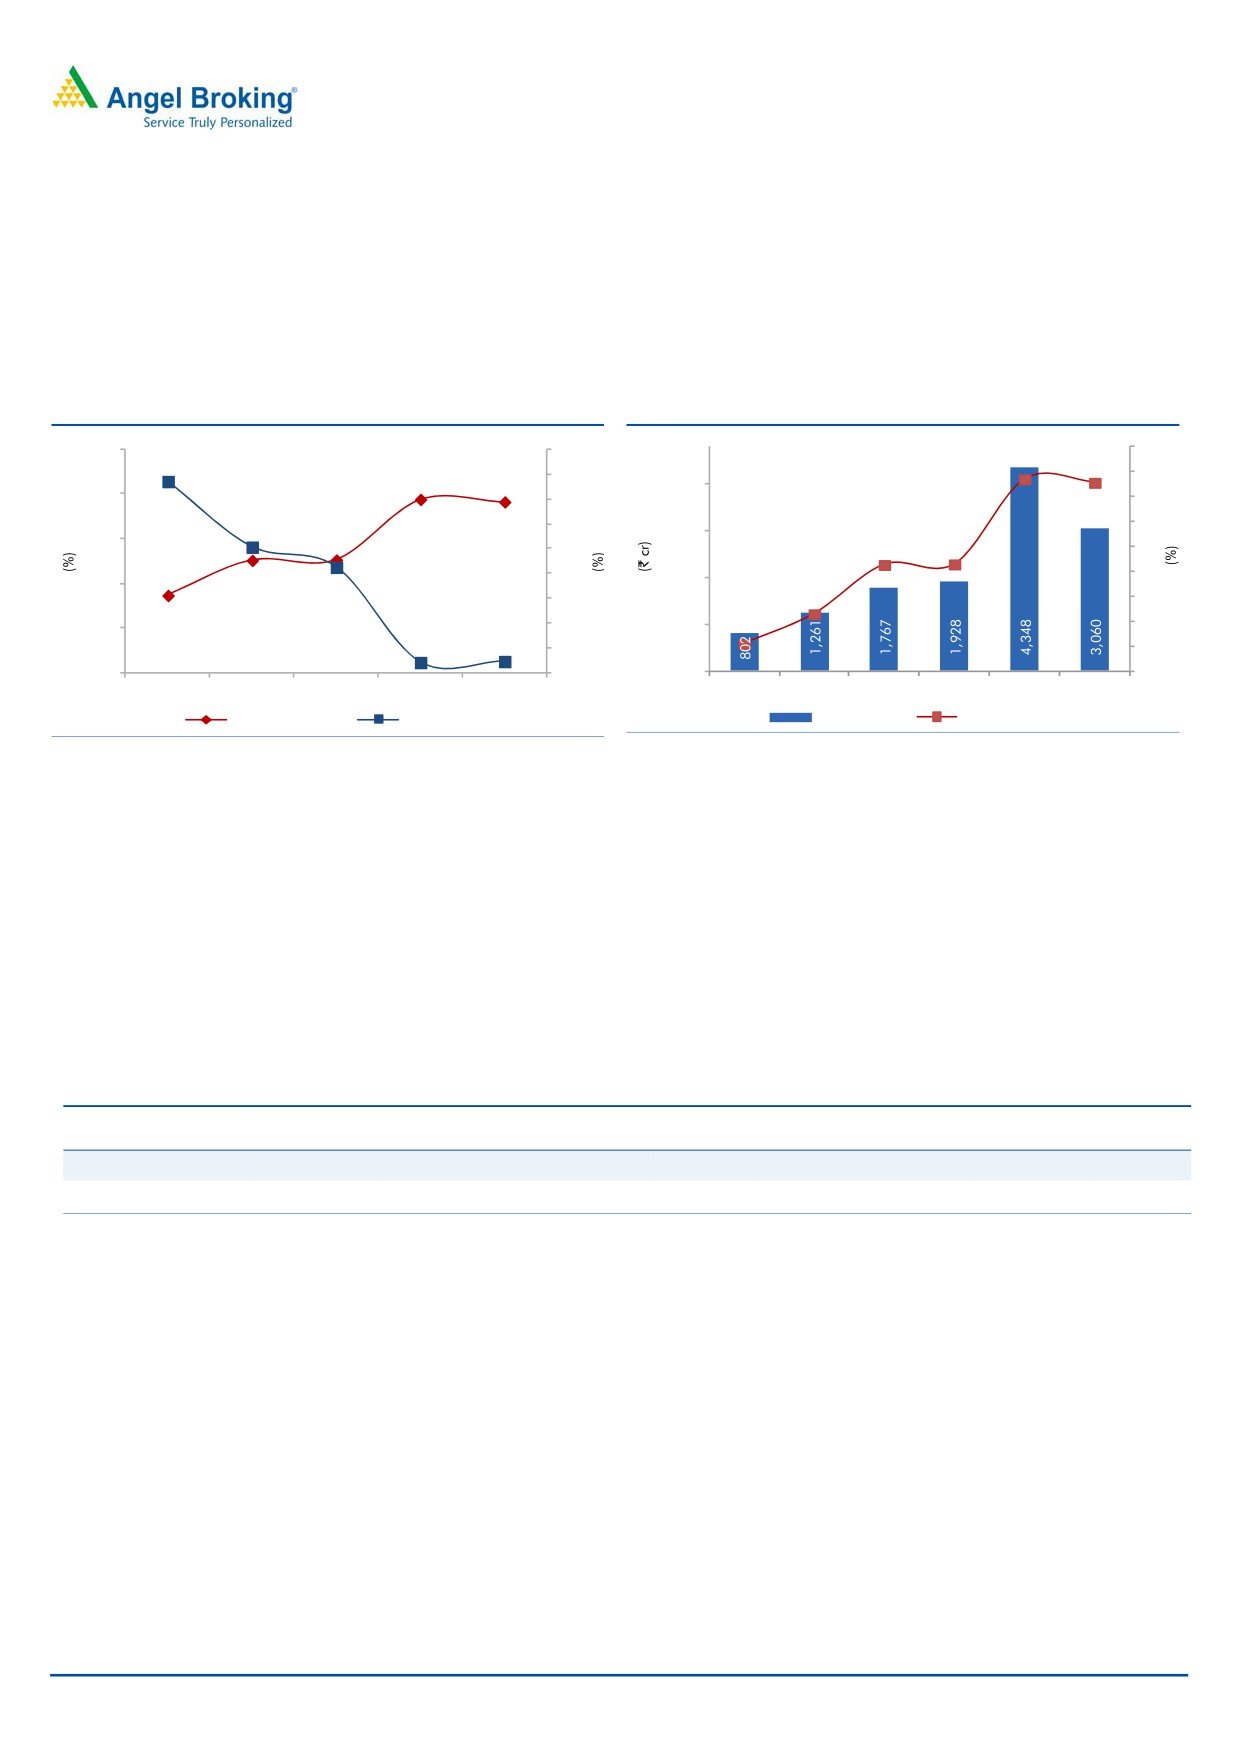
EBITDA and PAT margins to improve
The effect of lower rubber prices is being reflected in the company’s current
quarter numbers and will carry over into FY2017. We expect EBITDA margins to
improve to 21.4% in FY2016E (18 months) and be at 21.1% in FY2017E.
Consequently, we estimate the net profit to be at `1,611cr in FY2017E.
Exhibit 10: Lower rubber prices to aid EBITDA margin
Exhibit 11: Steady growth in net profit
27.0
73.0
24
70.4
21.4
21.1
22
71.0
21.4
4,000
22.0
21.1
20
69.0
67.0
14.6
18
3,000
17.0
14.6
14.6
65.0
14.6
16
65.1
63.0
14
2,000
12.0
63.5
10.6
61.0
12
10.6
59.0
10
7.0
1,000
55.8
55.9
57.0
8.2
8
2.0
55.0
0
6
SY2012
SY2013
SY2014
FY2016E* FY2017E
SY2011
SY2012
SY2013
SY2014
FY2016E* FY2017E
EBITDA margin
RM/Net sales (RHS)
EBITDA (LHS)
EBITDA margin
Source: Company, Angel Research
Source: Company, Angel Research Note:*FY2016E will have 18 months and
hence, numbers post SY2014 are not comparable
Outlook and valuation
We expect net sales to be at `14,488cr in FY2017E, while the EBITDA margin is
expected to be at 21.1% in FY2017E. As a result of better margins, the net profit is
expected to be at `1,611cr in FY2017E. At the current market price, MRF is trading
at a PE of 10.5x its FY2017E earnings and at a P/BV of 2.0x for FY2017E. We
have an Accumulate rating on the stock with a target price of `45,850 based on
a target P/E of 12.0x for FY2017E.
Exhibit 12: Relative valuation
Sales
OPM
PAT
EPS
ROE
P/E
P/BV
EV/EBITDA
EV/Sales
Year end
(` cr)
(%)
(` cr)
(`)
(%)
(x)
(x)
(x)
(x)
Apollo Tyres
FY2017E
12,978
16.1
1,012
19.9
13.4
9.2
1.2
5.3
0.8
MRF
FY2017E
14,488
21.1
1,611
3,797.9
21.2
10.5
2.0
4.9
1.0
Source: Company
30 October 2015
6
MRF | 4QFY2016 Result Update
Risks
Volatile rubber prices: Natural rubber is the key raw material used in the
manufacture of tyres. Domestic rubber prices have declined from the level of
`133/kg in 4QSY2014 to average levels of `118/kg in the past quarter. Increase
in rubber prices would have a negative impact on the company’s EBITDA margin
and consequently on its profit.
Hike in import duty on rubber: In the wake of falling domestic rubber prices, the
Central Government has increased the import duty on natural rubber to a lower of
20% or `30/kg, from the currently lower of 20% or `20/kg. Any further upward
revision in import duty will have an adverse impact on MRF’s profitability.
Slowdown in automobile sector: Automobile demand in India has been declining
since SY2011. Of the total tyre consumption in terms of tonnage for the industry,
OEMs account for ~36%. If the demand from OEMs continues to be sluggish, it
will impact the revenue growth of the company.
Cheaper Chinese Imports: The government has yet to extend the anti-dumping
duty, it had levied on imported MHCV tyres, beyond February 2015. In case of
further delay in the extension of the duty or in the eventuality of the government
altogether not extending the aforementioned anti-dumping duty, MRF’s volumes
would be adversely impacted.
Company Background
MRF manufactures rubber products such as tyres, tubes, flaps, tread rubber and
conveyor belts. The company is present across all categories of tyres. MRF is a
market leader in the tyre industry with an ~24% market share as on FY2012. The
company is also a leader in the passenger car tyre segment with a 24.8% market
share and holds a third position in the MHCV segment with a 22.3% market share.
MRF also exports tyres to over 65 countries in America, Europe, Middle East, Japan
and the Pacific region.
30 October 2015
7
MRF | 4QFY2016 Result Update
Profit & Loss Statement (Standalone)
Y/E Sept (` cr)
SY2012
SY2013
SY2014
FY2016E*
FY2017E
Gross sales
13,062
13,453
14,649
22,551
16,082
Less: Excise duty
1,192
1,322
1,451
2,235
1,594
Net Sales
11,870
12,131
13,198
20,316
14,488
% chg
21.8
2.2
8.8
53.9
(28.7)
Net Raw Materials
8,353
7,899
8,379
11,336
8,096
Personnel
514
603
733
1,209
877
Other
1,743
1,862
2,158
3,423
2,456
Total Expenditure
10,609
10,365
11,270
15,968
11,428
EBITDA
1,261
1,767
1,928
4,348
3,060
% chg
57.3
40.1
9.1
125.5
(29.6)
(% of Net Sales)
10.6
14.6
14.6
21.4
21.1
Depreciation & Amort.
301
373
423
721
557
EBIT
960
1,394
1,505
3,627
2,503
% chg
73.3
45.2
8.0
141.0
(31.0)
(% of Net Sales)
8.1
11.5
11.4
17.9
17.3
Interest & other charges
159
196
232
336
189
Other Income
32
29
66
183
90
(% of sales)
0.3
0.2
0.5
0.9
0.6
PBT
833
1,227
1,339
3,474
2,404
% chg
73.0
47.3
9.1
159.5
(30.8)
Tax
261
425
441
1146
793
(% of PBT)
31.3
34.6
32.9
33.0
33.0
PAT (reported)
572
802
898
2,328
1,611
Minority interest
-
-
-
-
-
Extraordinary (Exp)/Inc.
-
-
-
-
-
Tax on extraordinary exp
-
-
-
-
-
ADJ. PAT
572
802
898
2,328
1,611
% chg
32.6
40.2
11.9
159.2
(30.8)
(% of Net Sales)
4.8
6.6
6.8
11.5
11.1
Basic EPS (`)
1,350
1,892
2,117
5,488
3,798
Fully Diluted EPS (`)
1,350
1,892
2,117
5,488
3,798
% chg
32.6
40.2
11.9
159.2
(30.8)
Note:*FY2016E will have 18 months and hence, numbers post SY2014 are not comparable
30 October 2015
8
MRF | 4QFY2016 Result Update
Balance Sheet (Standalone)
Y/E Sept (` cr)
SY2012
SY2013
SY2014
FY2016E*
FY2017E
SOURCES OF FUNDS
Equity Share Capital
4
4
4
4
4
Preference Capital
-
-
-
-
-
Reserves& Surplus
2,854
3,641
4,513
6,816
8,401
Equity share warrants
-
-
-
-
-
Shareholders’ Funds
2,858
3,645
4,518
6,820
8,405
Total Loans
1,659
1,562
1,903
1,808
1,717
Deferred Tax Liability
187
222
235
259
259
Other Long Term Liabilities
957
1,080
1,145
1,317
1,195
Long Term Provisions
87
75
92
92
92
Total Liabilities
5,748
6,585
7,892
10,295
11,668
APPLICATION OF FUNDS
Gross Block
5,063
5,475
6,328
7,593
9,534
Less: Acc. Depreciation
2,149
2,505
2,899
3,620
4,177
Net Block
2,914
2,970
3,429
3,973
5,357
Capital Work-in-Progress
415
359
627
1,250
600
Investments
425
906
1,088
1,856
1,856
Long Term Loans and adv.
57
138
224
244
244
Other noncurrent assets
30
35
42
65
65
Current Assets
3,371
3,850
4,387
4,947
5,738
Cash
61
331
708
1,078
1,605
Loans & Advances
211
167
137
185
188
Inventory
1,646
1,795
1,800
1,913
2,058
Debtors
1,454
1,556
1,708
1,742
1,866
Other current assets
-
-
35
29
21
Current liabilities
1,464
1,672
1,905
2,040
2,192
Net Current Assets
1,907
2,177
2,483
2,907
3,546
Mis. Exp. not written off
-
-
-
-
-
Total Assets
5,748
6,585
7,892
10,295
11,668
Note:*FY2016E will have 18 months and hence, numbers post SY2014 are not comparable
30 October 2015
9
MRF | 4QFY2016 Result Update
Cash Flow Statement (Standalone)
Y/E Sept (` cr)
SY2012
SY2013
SY2014
FY2016E* FY2017E
Profit before tax
833
1,227
1,339
3,474
2,404
Depreciation
301
373
423
721
557
Change in Working Capital
(294)
(0)
71
(54)
(112)
Other income
443
248
280
(183)
(90)
Direct taxes paid
(261)
(425)
(428)
(1,123)
(793)
Cash Flow from Operations
1,023
1,422
1,685
2,835
1,965
(Inc.)/Dec. in Fixed Assets
(603)
(357)
(1,120)
(1,889)
(1,291)
(Inc.)/Dec. in Investments
(352)
(481)
(182)
(768)
-
(Decr)/Incr in Long term prov.
38
(12)
17
-
-
(Incr)/Decr In L.T loans & adv.
82
(85)
(93)
(42)
-
Other income
32
29
66
183
90
Others
(126)
12
(455)
-
-
Cash Flow from Investing
(929)
(895)
(1,768)
(2,516)
(1,201)
Issue of Equity
-
-
-
-
-
Inc./(Dec.) in loans
241
26
405
77
(212)
Dividend Paid (Incl. Tax)
(12)
(13)
(25)
(25)
(25)
Others
(317)
(315)
(328)
-
-
Cash Flow from Financing
(89)
(301)
52
51
(237)
Inc./(Dec.) in Cash
5
226
(31)
370
527
Fixed Deposit
-
44
408
-
-
Opening Cash balances
56
61
331
708
1,078
Closing Cash balances
61
331
708
1,078
1,605
Note:*FY2016E will have 18 months and hence, numbers post SY2014 are not comparable
30 October 2015
10
MRF | 4QFY2016 Result Update
Key Ratios
Y/E Sept (` cr)
SY2012
SY2013
SY2014
FY2016E*
FY2017E
Valuation Ratio (x)
P/E (on FDEPS)
29.4
21.0
18.7
7.2
10.5
P/CEPS
19.3
14.3
12.7
5.5
7.8
P/BV
5.9
4.6
3.7
2.5
2.0
Dividend yield (%)
0.1
0.1
0.2
0.2
0.2
EV/Sales
1.5
1.4
1.3
0.8
1.0
EV/EBITDA
14.3
9.7
8.8
3.6
4.9
EV / Total Assets
3.1
2.6
2.1
1.5
1.3
Per Share Data (`)
EPS (Basic)
1,349.9
1,892.0
2,117.1
5,488.0
3,797.9
EPS (fully diluted)
1,349.9
1,892.0
2,117.1
5,488.0
3,797.9
Cash EPS
2,060.1
2,771.6
3,114.7
7,188.9
5,110.4
DPS
25.0
30.0
50.0
50.0
50.0
Book Value
6,740
8,597
10,652
16,080
19,818
Dupont Analysis
EBIT margin
8.1
11.5
11.4
17.9
17.3
Tax retention ratio
0.7
0.7
0.7
0.7
0.7
Asset turnover (x)
2.4
2.4
2.4
3.3
1.9
ROIC (Post-tax)
13.6
18.3
18.4
39.8
22.1
Cost of Debt (Post Tax)
6.8
8.0
9.0
12.1
7.2
Leverage (x)
0.4
0.1
0.0
(0.2)
(0.2)
Operating ROE
16.4
19.2
18.7
35.2
19.0
Returns (%)
ROCE (Pre-tax)
18.1
22.6
20.8
39.9
22.8
Angel ROIC (Pre-tax)
22.5
28.3
28.8
62.6
36.5
ROE
22.2
24.7
22.0
41.1
21.2
Turnover ratios (x)
Asset Turnover (Gross Block)
2.7
2.3
2.2
2.9
1.7
Inventory / Sales (days)
49
52
50
52
50
Receivables (days)
42
45
45
47
47
Payables (days)
51
55
58
70
70
WC cycle (ex-cash) (days)
52
56
50
49
47
Solvency ratios (x)
Net debt to equity
0.4
0.1
0.0
(0.2)
(0.2)
Net debt to EBITDA
0.9
0.2
0.1
(0.3)
(0.6)
Interest Coverage (EBIT / Int.)
6.0
7.1
6.5
10.8
13.2
Note:*FY2016E will have 18 months and hence, numbers post SY2014 are not comparable
30 October 2015
11
MRF | 4QFY2016 Result Update
Research Team Tel: 022 - 39357800
DISCLAIMER
Angel Broking Private Limited (hereinafter referred to as “Angel”) is a registered Member of National Stock Exchange of India Limited,
Bombay Stock Exchange Limited and MCX Stock Exchange Limited. It is also registered as a Depository Participant with CDSL and
Portfolio Manager with SEBI. It also has registration with AMFI as a Mutual Fund Distributor. Angel has received in-principal approval
from SEBI for registering as a Research Entity in terms of SEBI (Research Analyst) Regulations, 2014. Angel or its associates has not
been debarred/ suspended by SEBI or any other regulatory authority for accessing /dealing in securities Market. Angel or its associates
including its relatives/analyst do not hold any financial interest/beneficial ownership of more than 1% in the company covered by
Analyst. Angel or its associates/analyst has not received any compensation / managed or co-managed public offering of securities of
the company covered by Analyst during the past twelve months. Angel/analyst has not served as an officer, director or employee of
company covered by Analyst and has not been engaged in market making activity of the company covered by Analyst.
This document is solely for the personal information of the recipient, and must not be singularly used as the basis of any investment
decision. Nothing in this document should be construed as investment or financial advice. Each recipient of this document should
make such investigations as they deem necessary to arrive at an independent evaluation of an investment in the securities of the
companies referred to in this document (including the merits and risks involved), and should consult their own advisors to determine
the merits and risks of such an investment.
Reports based on technical and derivative analysis center on studying charts of a stock's price movement, outstanding positions and
trading volume, as opposed to focusing on a company's fundamentals and, as such, may not match with a report on a company's
fundamentals.
The information in this document has been printed on the basis of publicly available information, internal data and other reliable
sources believed to be true, but we do not represent that it is accurate or complete and it should not be relied on as such, as this
document is for general guidance only. Angel Broking Pvt. Limited or any of its affiliates/ group companies shall not be in any way
responsible for any loss or damage that may arise to any person from any inadvertent error in the information contained in this report.
Angel Broking Pvt. Limited has not independently verified all the information contained within this document. Accordingly, we cannot
testify, nor make any representation or warranty, express or implied, to the accuracy, contents or data contained within this document.
While Angel Broking Pvt. Limited endeavors to update on a reasonable basis the information discussed in this material, there may be
regulatory, compliance, or other reasons that prevent us from doing so.
This document is being supplied to you solely for your information, and its contents, information or data may not be reproduced,
redistributed or passed on, directly or indirectly.
Neither Angel Broking Pvt. Limited, nor its directors, employees or affiliates shall be liable for any loss or damage that may arise from
or in connection with the use of this information.
Note: Please refer to the important ‘Stock Holding Disclosure' report on the Angel website (Research Section). Also, please refer to the
latest update on respective stocks for the disclosure status in respect of those stocks. Angel Broking Pvt. Limited and its affiliates may
have investment positions in the stocks recommended in this report.
Disclosure of Interest Statement
MRF
1. Analyst ownership of the stock
No
2. Angel and its Group companies ownership of the stock
No
3. Angel and its Group companies' Directors ownership of the stock
No
4. Broking relationship with company covered
No
Note: We have not considered any Exposure below ` 1 lakh for Angel, its Group companies and Directors
Ratings (Based on expected returns
Buy (> 15%)
Accumulate (5% to 15%)
Neutral (-5 to 5%)
over 12 months investment period):
Reduce (-5% to -15%)
Sell (< -15)
30 October 2015
12