2QFY2016 Result Update | Others
November 10, 2015
MM Forgings
BUY
CMP
`516
Performance highlights
Target Price
`614
Y/E March (` cr)
2QFY16 2QFY15
% chg. (yoy)
1QFY16
% chg. (qoq)
Investment Period
12 months
Net sales
128
125
1.8
124
2.9
EBITDA
28
28
0.2
27
4.5
Stock Info
EBITDA Margin (%)
21.9
22.3
(37)
21.6
34
Sector
Others
Adjusted PAT
13
13
(0.5)
13
1.2
Market Cap (` cr)
623
Source: Company, Angel Research
Net debt (` cr)
101
Beta
0.8
For 2QFY2016, MM Forgings (MMFL) reported disappointing numbers on the top-
line and bottom-line fronts. The top-line during the quarter grew marginally by
52 Week High / Low
751/ 229
Avg. Daily Volume
7,533
1.8% yoy to `128cr. The raw material cost declined by 111bp yoy to 38.2% of
Face Value (`)
10
sales, but the benefits were offset by an increase in employee and power costs.
BSE Sensex
26,121
Employee and power costs rose by 162bp yoy and 17bp yoy to 11.1% and 10.4%
of sales, respectively. As a result, the EBITDA margin witnessed a slight decline of
Nifty
7,915
37bp yoy to 21.9%. The other income came in at `1.3cr vs `0.4cr in 2QFY2015.
Reuters Code
MMFO.BO
Bloomberg Code
MMFG IN
The net profit remained flat at `13cr.
Sufficient capacity to cater to improving demand across the globe: MMFL is in the
midst of increasing its capacity to 65,000MT, which should be in place by
Shareholding Pattern (%)
4QFY2016. The company mainly caters to global markets (Europe and USA) with a
Promoters
56.4
focus on the commercial vehicle (CV) industry. The company is witnessing healthy
MF / Banks / Indian Fls
13.5
demand from USA and we expect demand from the region to remain intact over the
FII / NRIs / OCBs
3.2
next 12-15 month period. We expect demand from Europe to be subdued in the near
Indian Public / Others
26.9
term and recover thereafter. Additionally, appreciation of the USD against the INR will
provide a boost to the company’s top-line by way of higher realization in INR terms.
Improvement in demand from domestic CV industry: The domestic CV industry’s
Abs.(%)
3m 1yr
3yr
performance over the past three years had been lackluster amidst a pronounced
Sensex
(7.2)
(5.8)
39.6
slowdown. However, there has been an evident recovery in the domestic CV
MMFL
(24.3)
0.9
397.3
industry, ie in the medium and heavy commercial vehicle (MHCV) segment, where
vehicle sales have grown by 54.9% in 1HFY2016. Going ahead, the outlook on the
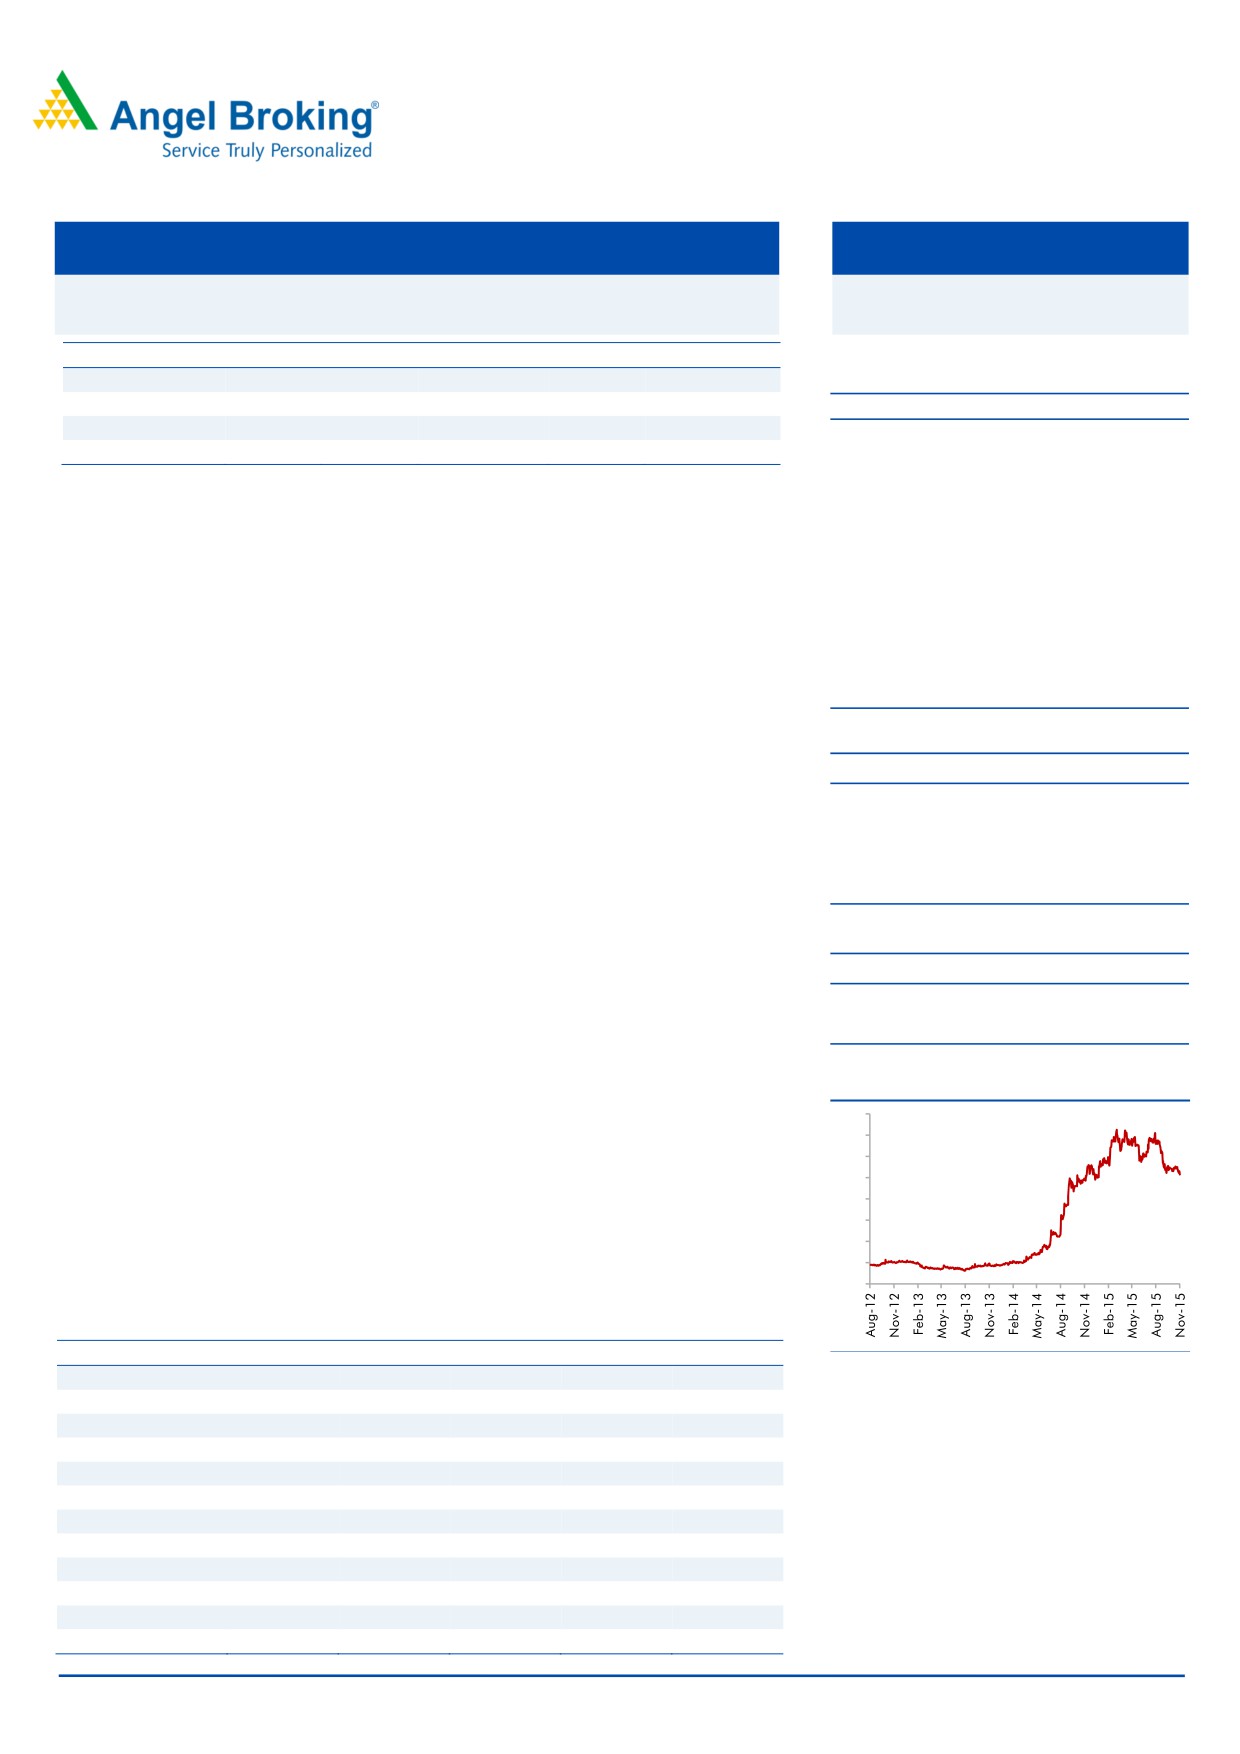
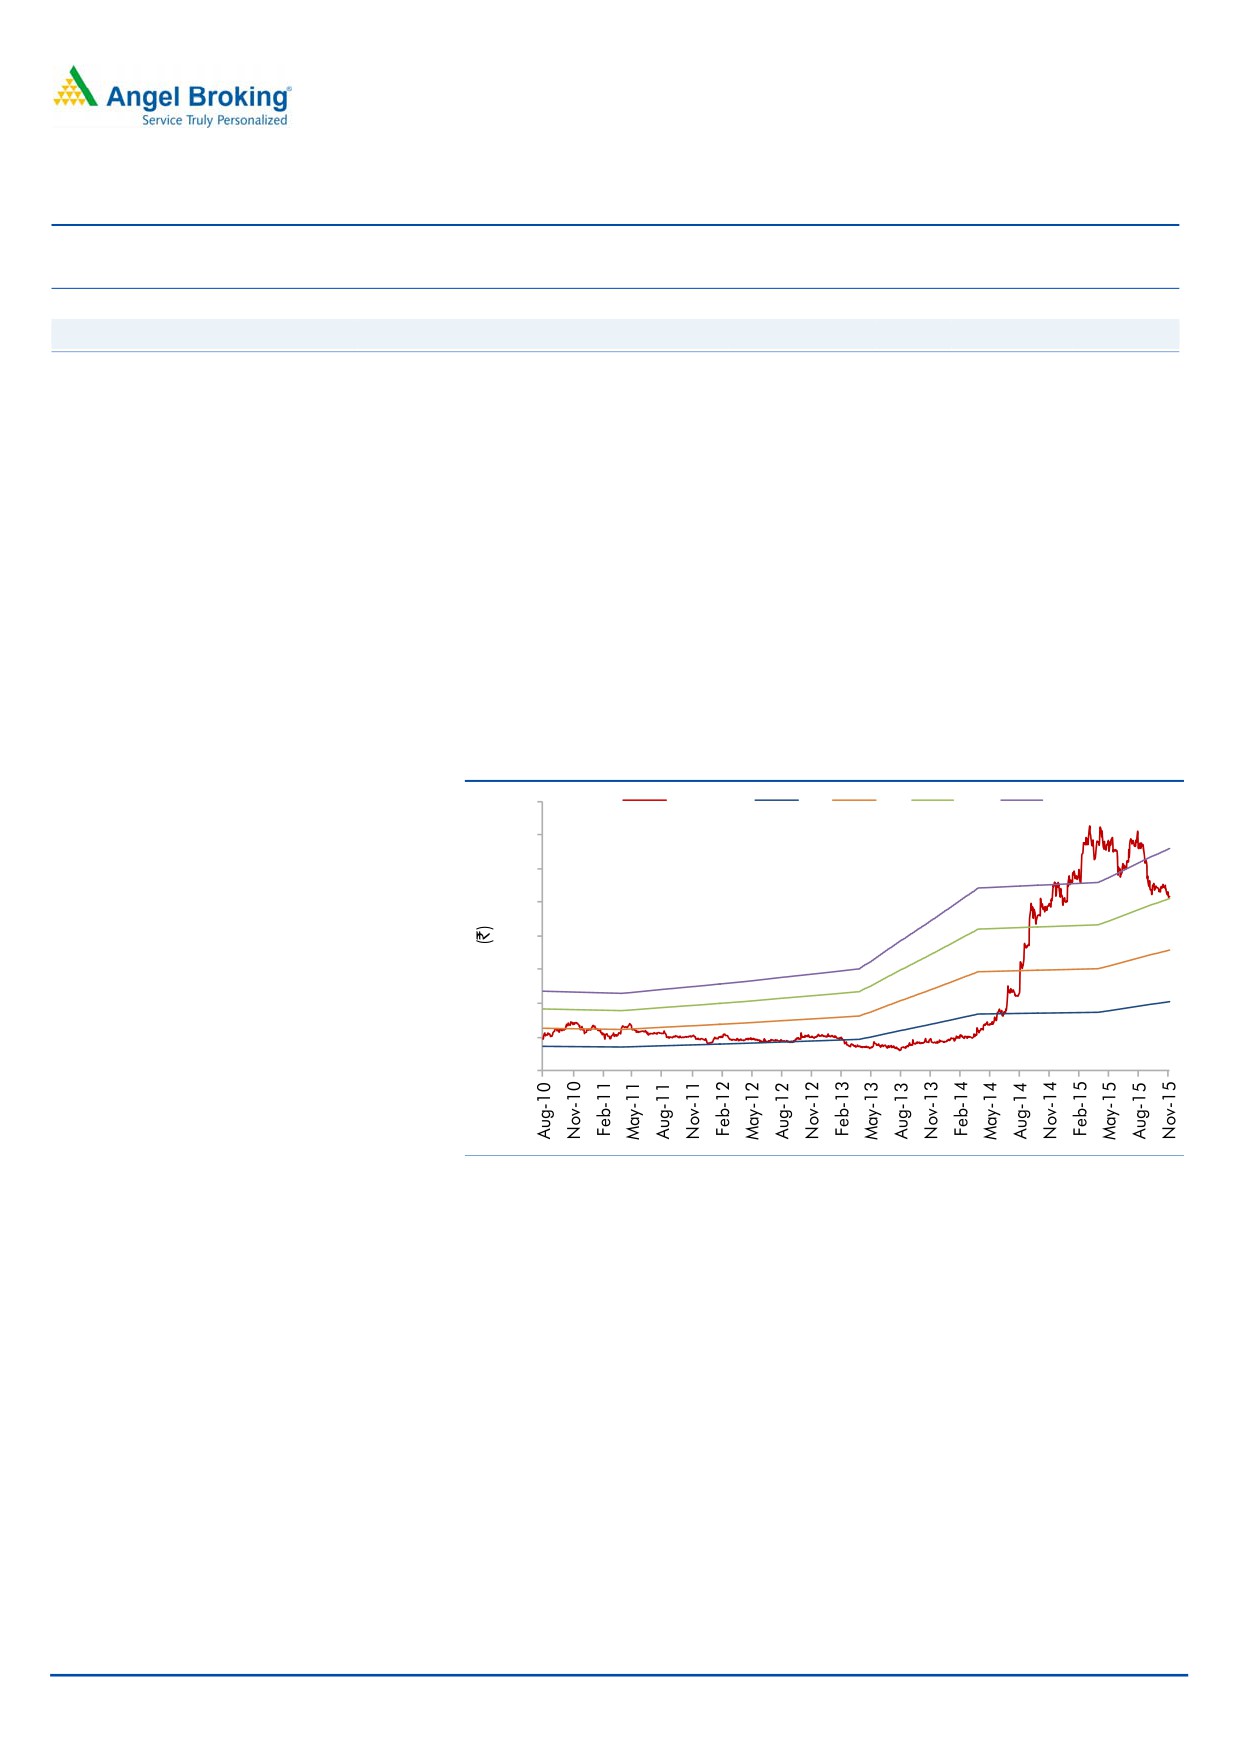
3 year price chart
domestic CV industry remains positive on the back of increase in government
800
spending on infrastructure coupled with stable diesel cost and possible interest rate
700
cuts in the near future.
600
500
Outlook and valuation: We expect MMFL to register a revenue CAGR of 10.6%
400
over FY2015-17E to `615cr with an EBITDA margin of 21.6% in FY2017E. The
300
profit is expected to improve to `67cr in FY2017E. At the current market price, the stock is
200
trading at a P/E of 9.3x its FY2017E earnings. We have a Buy rating on the stock with a
100
0
revised target price of `614 based on target P/E of 11.0x for FY2017E.
Key financials
Y/E March (` cr)
FY2013
FY2014
FY2015
FY2016E
FY2017E
Source: Company, Angel Research
Net Sales
361
411
503
511
615
% chg
3.1
13.9
22.1
1.7
20.3
Adj. Net Profit
24
28
51
52
67
% chg
14.8
14.8
80.0
3.0
29.4
OPM (%)
16.0
19.2
22.0
21.7
21.6
EPS (`)
20.3
23.3
41.9
43.1
55.8
P/E (x)
25.5
22.2
12.3
12.0
9.3
P/BV (x)
3.6
3.2
2.6
2.2
1.8
RoE (%)
15.1
15.3
23.3
19.9
21.2
RoCE (%)
11.7
12.9
19.4
16.0
18.1
Milan Desai
EV/Sales (x)
2.1
1.8
1.4
1.4
1.1
022-40003600 Ext: 6846
EV/EBITDA (x)
13.3
9.5
6.5
6.6
5.0
Source: Company, Angel Research, CMP as of November 9, 2015
Please refer to important disclosures at the end of this report
1
M M Forgings | 2QFY2016 Result Update
Exhibit 1: 2QFY2016 performance
Y/E March (` cr)
2QFY16
2QFY15
% chg. (yoy)
1QFY16
% chg. (qoq)
1HFY16
1HFY15
% chg
Net Sales
128
125
1.8
124
2.9
252
250
0.8
Net raw material
49
49
(1.0)
49
(0.1)
98
105
(7.1)
(% of Sales)
38.2
39.3
(111)bp
39.3
(115)bp
38.7
42.0
(328)bp
Employee Cost
14
12
19.2
14
0.9
28
22.6
25.1
(% of Sales)
11.1
9.5
162bp
11.4
(22)bp
11.2
9.1
219bp
Power, Oil & Fuel
13
13
3.6
14
(2.5)
27
25
9.5
(% of Sales)
10.4
10.2
17bp
11.0
(57)bp
10.7
9.8
85bp
Other Expenses
24
23
0.1
21
12.8
44
42
5.1
(% of Sales)
18.4
18.7
(31)bp
16.8
161bp
17.6
16.9
73bp
Total Expenditure
100
97
2.3
97
2.5
197
194
1.4
Operating Profit
28
28
0.2
27
4.5
55
56
(1)
OPM (%)
21.9
22.3
(37)bp
21.6
34bp
21.7
22.2
(48)
Interest
2
2
9.9
2
5.9
5
4
4.7
Depreciation
9
9
-
9
-
18
18
-
Other Income
1
0
230.3
1
8.4
2
1
207.9
PBT
18
17
4.1
17
7.0
35
34
1.9
(% of Sales)
14.0
13.7
13.4
13.7
13.6
Tax
5
4
19.0
4
27.0
9
8
13.5
(% of PBT)
26.7
23.3
22.5
24.7
22.1
Reported PAT
13
13
(0.5)
13
1.2
26
26
(1.4)
Extraordinary Expense/(Inc.)
-
-
-
-
-
Adjusted PAT
13
13
(0.5)
13
1.2
26
26
(1.4)
PATM
10.2
10.5
10.4
10.3
10.6
Source: Company, Angel Research
Exhibit 2: Actual vs. Angel estimates (2QFY2016)
Actual (` cr)
Estimate (` cr)
Var (%)
Total Income
128
139
(8.1)
EBIDTA
28
31
(8.6)
EBIDTA margin (%)
21.9
22.0
(12)
Adjusted PAT
13
15
(13.4)
Source: Company, Angel Research
Numbers disappoint on top and bottom line front
For 2QFY2016, the company reported numbers that disappointed on the top-line
front. The top-line during the quarter grew marginally by 1.8% yoy to `128cr. The
same was below our estimate of `139cr. The raw material cost declined by 111bp
yoy to 38.2% of sales and other expenses declined by 31bp yoy to 18.4% of sales,
but the benefits were offset by an increase in employee and power costs. Employee
and power costs rose by 162bp yoy and 17bp yoy to 11.1% and 10.4% of sales,
respectively. As a result, the EBITDA margin witnessed a slight decline of 37bp yoy
to 21.9%, which is in-line our estimate of 22.0%. Other income came in at `1.3cr
against `0.4cr in the same quarter of the previous year and consequently, the net
profit remained flat at `13cr vis-à-vis our expectation of `15cr.
November 10, 2015
2
M M Forgings | 2QFY2016 Result Update
Investment arguments
Sufficient capacity to cater to improving demand across the globe
The company is in the midst of increasing its capacity from 40,000MT to
~65,000MT by the end of FY2016. The company caters mainly to the global
markets (Europe and USA) with a focus on the CV industry; its overall exports
accounted for ~72% of sales in FY2015. In terms of global CV sales by region,
USA accounts for 39.3% of Global CV sales and Europe accounts for 10.4%.
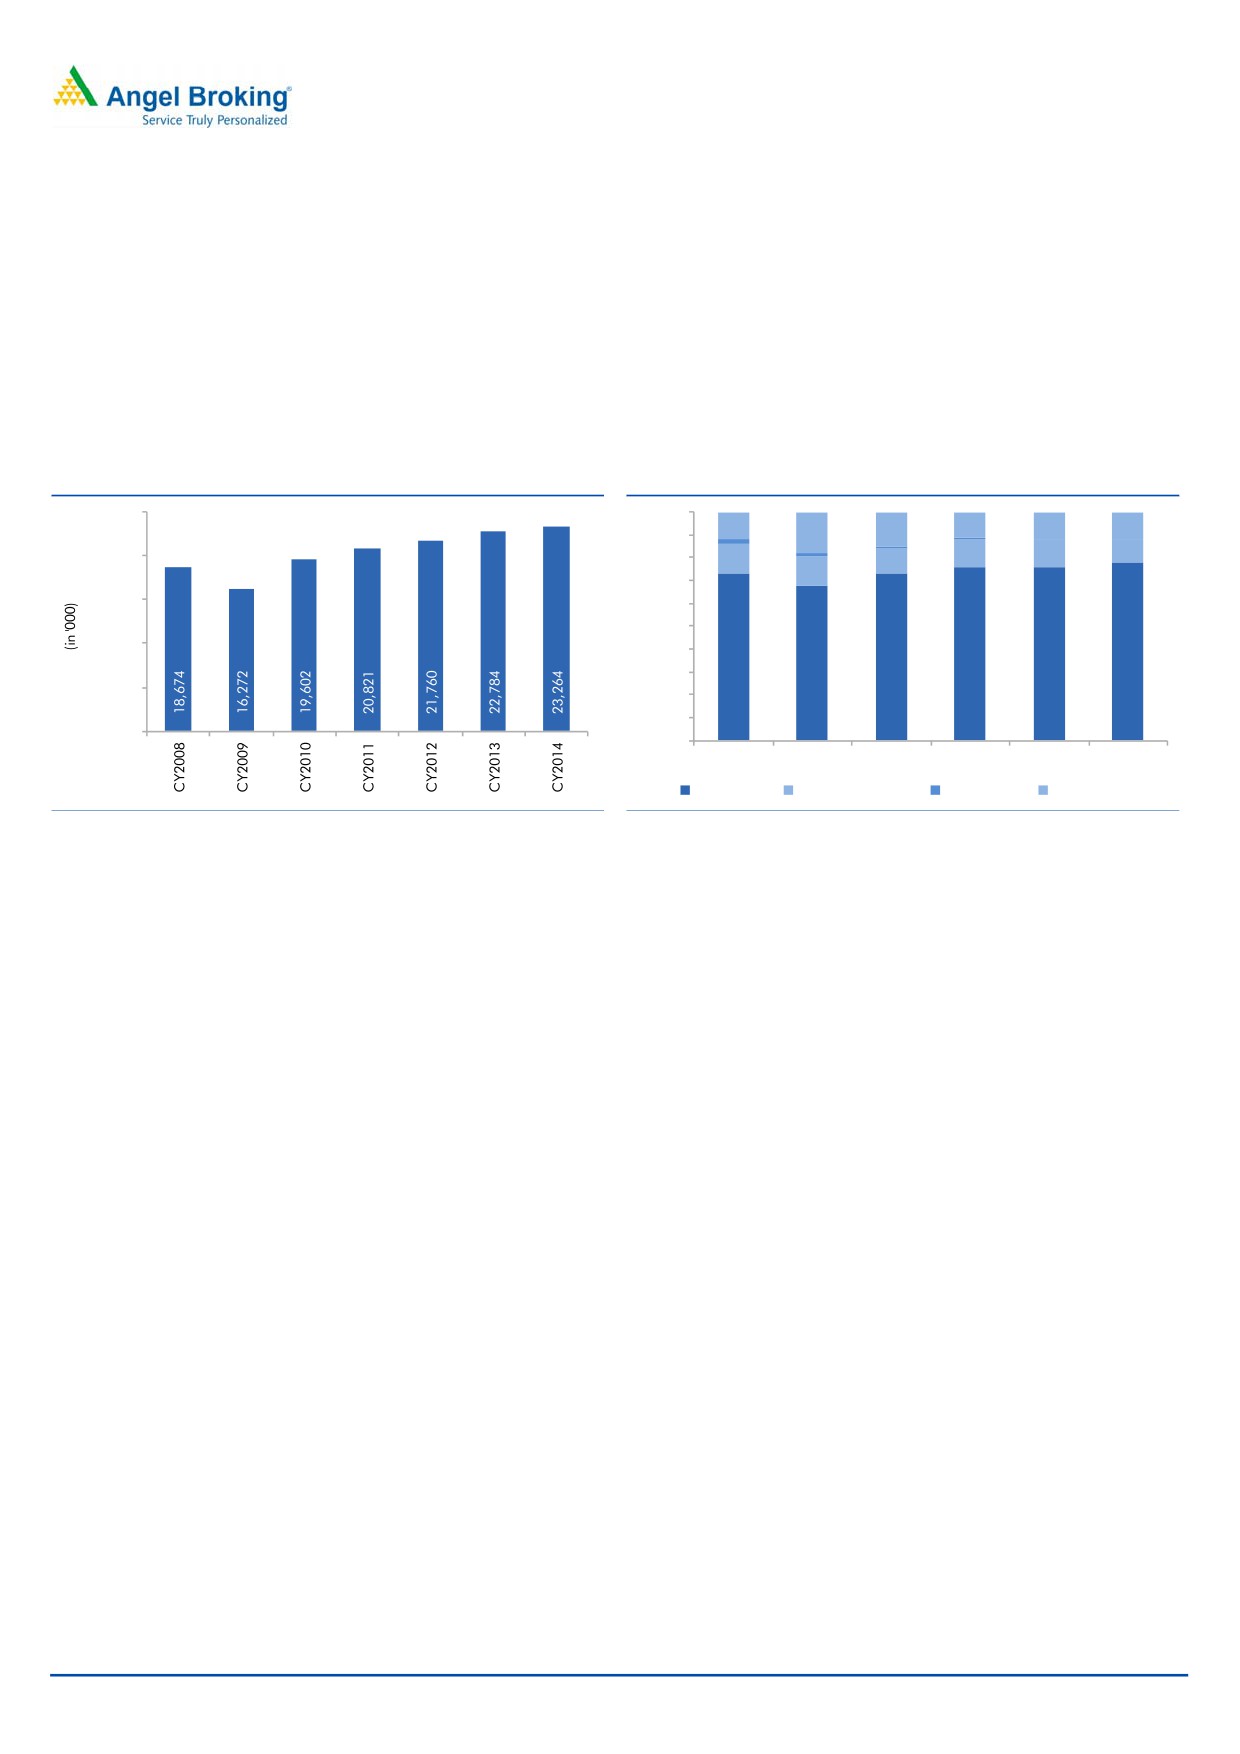
Exhibit 3: Global CV sales
Exhibit 4: Automotive segment’s contribution increases in net sales
25,000
100%
12.0
15.0
11.0
12.0
12.0
90%
18.0
12.0
12.0
10.0
20,000
80%
13.0
11.0
13.0
70%
15,000
60%
50%
10,000
40%
30%
5,000
20%
10%
73.0
68.0
73.0
76.0
76.0
78.0
-
0%
FY2010
FY2011
FY2012
FY2013
FY2014
FY2015
Automotive
Valve and Oilfiled
Engineering
Off Highway
Source: OICA, Angel Research
Source: Company, Angel Research
As of FY2015, the CV industry accounted for ~63% of net sales while passenger
cars accounted for ~15% of company’s net sales. We expect the demand for CVs
to remain intact, mainly from US and India. A recovery in the US economy has
positively impacted the company’s performance in FY2015 and the Management
expects the better demand scenario to spill into FY2016. In the near term, we
expect demand from Europe to be muted owing to the subdued economic scenario
prevalent in the region. Although Europe CV sales data (OICA) for the first half of
2015 suggests that the volumes are picking up, particularly in UK, Spain and Italy,
we expect the demand scenario to stabilize across the continent in the longer run.
Improvement in demand from domestic CV industry
As per the Association of Indian Forging Industry (AIFI), the demand for forgings is
largely dependent on the health of the automotive industry. Within the automotive
sector, CVs account for a major share followed by passenger vehicle (PV)s. The
demand from the domestic CV industry had been lackluster over the last three
years as the sector faced a pronounced slowdown. However, domestic CV sales
have been on an uptick in the past year, ie mainly MHCVs, the sales of which have
grown by ~54.9% yoy in 1HFY2016. The outlook for MHCVs remains positive on
the back of increase in government spending on infrastructure coupled with stable
diesel cost and possibility of further interest rate cuts in the near future.
November 10, 2015
3
M M Forgings | 2QFY2016 Result Update
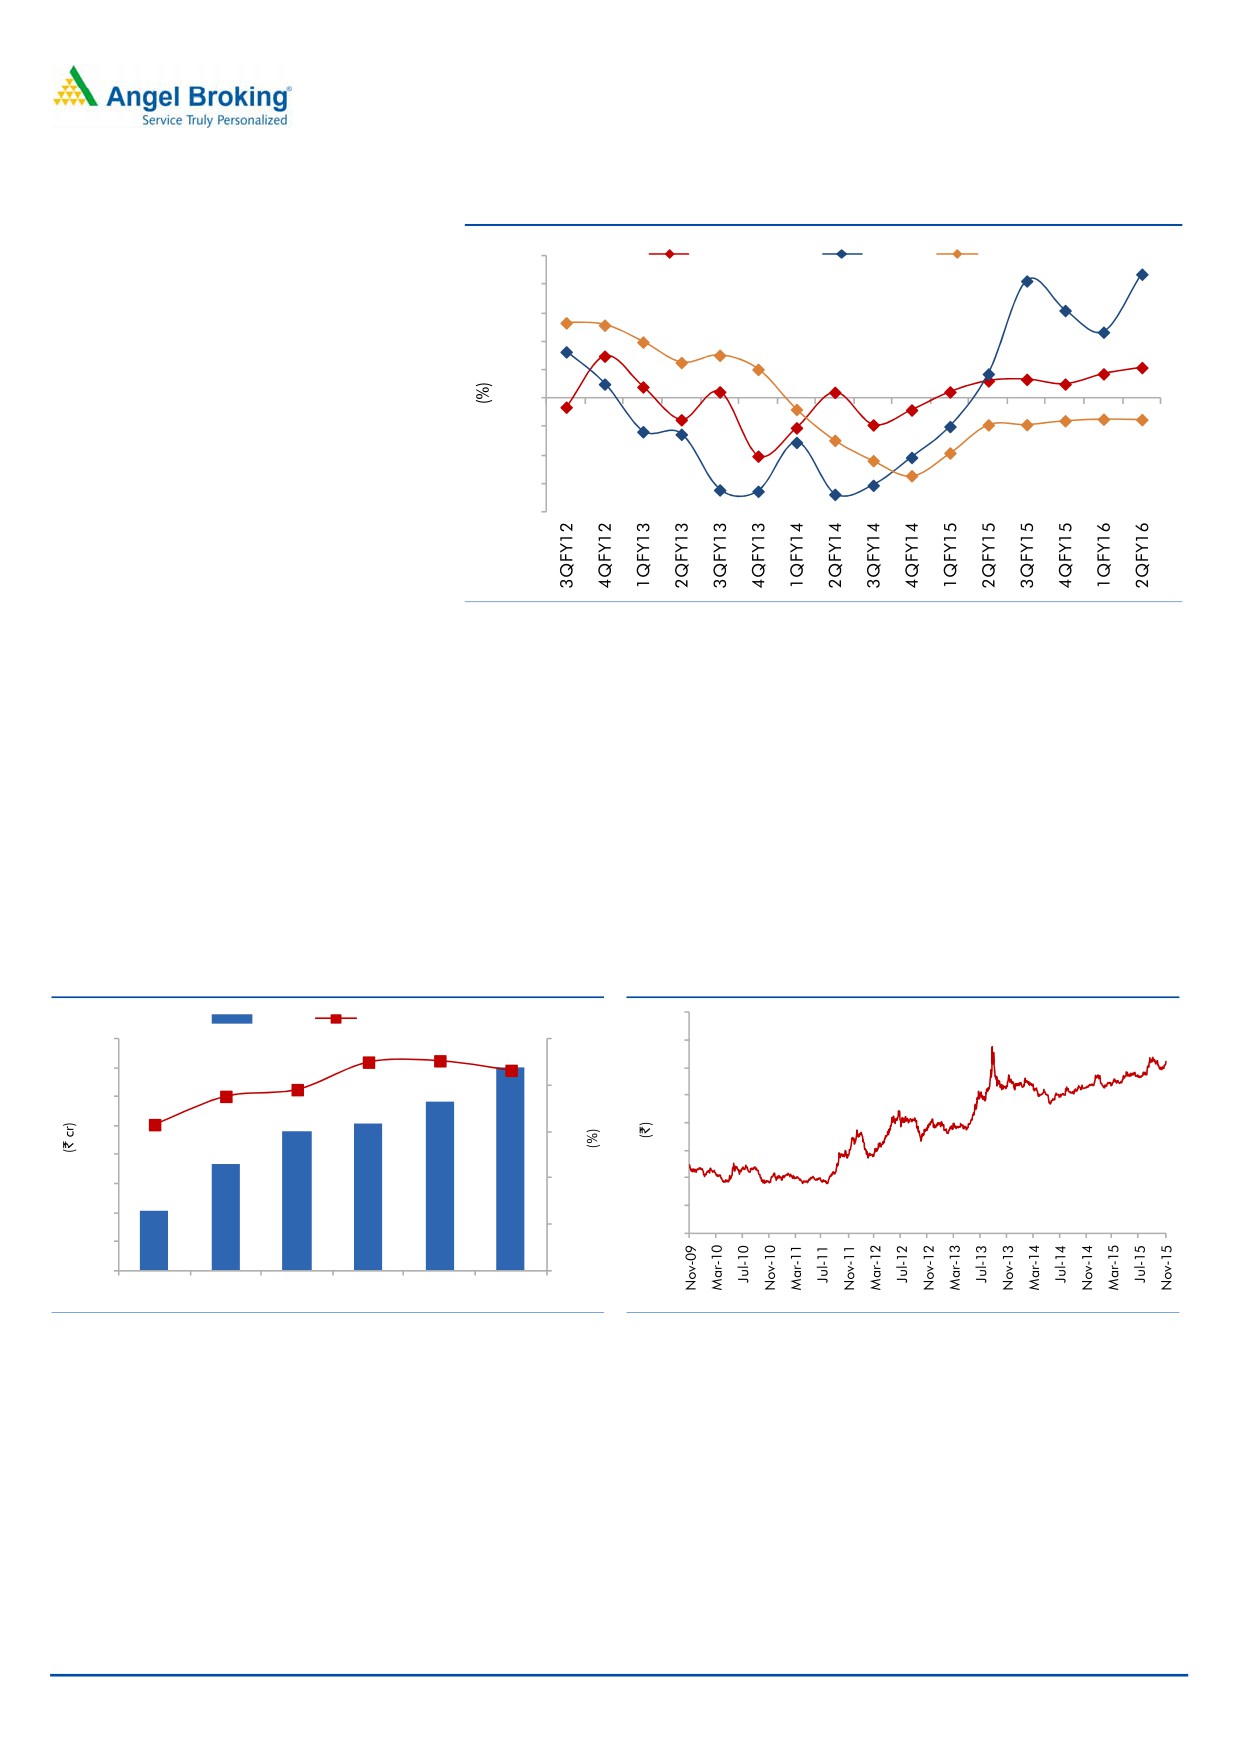
Exhibit 5: Domestic CV and Passenger Sales
50.0
Passanger Car
MHCV
LCV
43.6
40.0
30.0
20.0
10.8
10.0
-
(10.0)
(7.5)
(20.0)
(30.0)
(40.0)
Source: SIAM, Angel Research
Stronger Dollar to boost top-line
Exports have been a major contributor to the company’s revenues over the years
with contribution increasing to
71.6% in FY2015 from
65.8% in FY2010.
Considering that US is one of the major markets to which the company exports to,
the Indian Rupee (INR)’s depreciation against the US Dollar (USD) is favorable for
the company. The INR has depreciated against the USD by close to 6% in FY2016
and is likely to remain weak owing to impending interest rate hike by the Federal
Reserve in the near future. We expect the company’s top-line to receive a boost on
back of potential strengthening of the USD, thus aiding the company’s realizations.
Exhibit 6: Increasing contribution from exports
Exhibit 7: INR/USD trend
75
Export
% of total sales
400
72.5
72.6
75.0
70
71.6
66
350
69.5
65
68.8
70.0
300
60
65.8
250
55
65.0
200
50
60.0
45
150
40
100
55.0
35
50
104
183
239
254
291
351
0
50.0
FY2010
FY2011
FY2012
FY2013
FY2014
FY2015
Source: Company, Angel Research
Source: Company, Angel Research
November 10, 2015
4
M M Forgings | 2QFY2016 Result Update
Financials
Revenue to grow on the back of global CV industry recovery
The company has witnessed a top-line CAGR of 25.0% over FY2010-15 while the
global CV industry’s sales have grown by close to 7.4% during the same period.
The company is in the process of increasing its capacity to 65,000MT by the end of
FY2016. On the back of improving demand in the CV industry across the globe
and the company’s strong relationship with its customers, we expect the company
to successfully utilize its extended capacity and witness a strong top-line CAGR of
10.6% over FY2015-17E to `615cr.
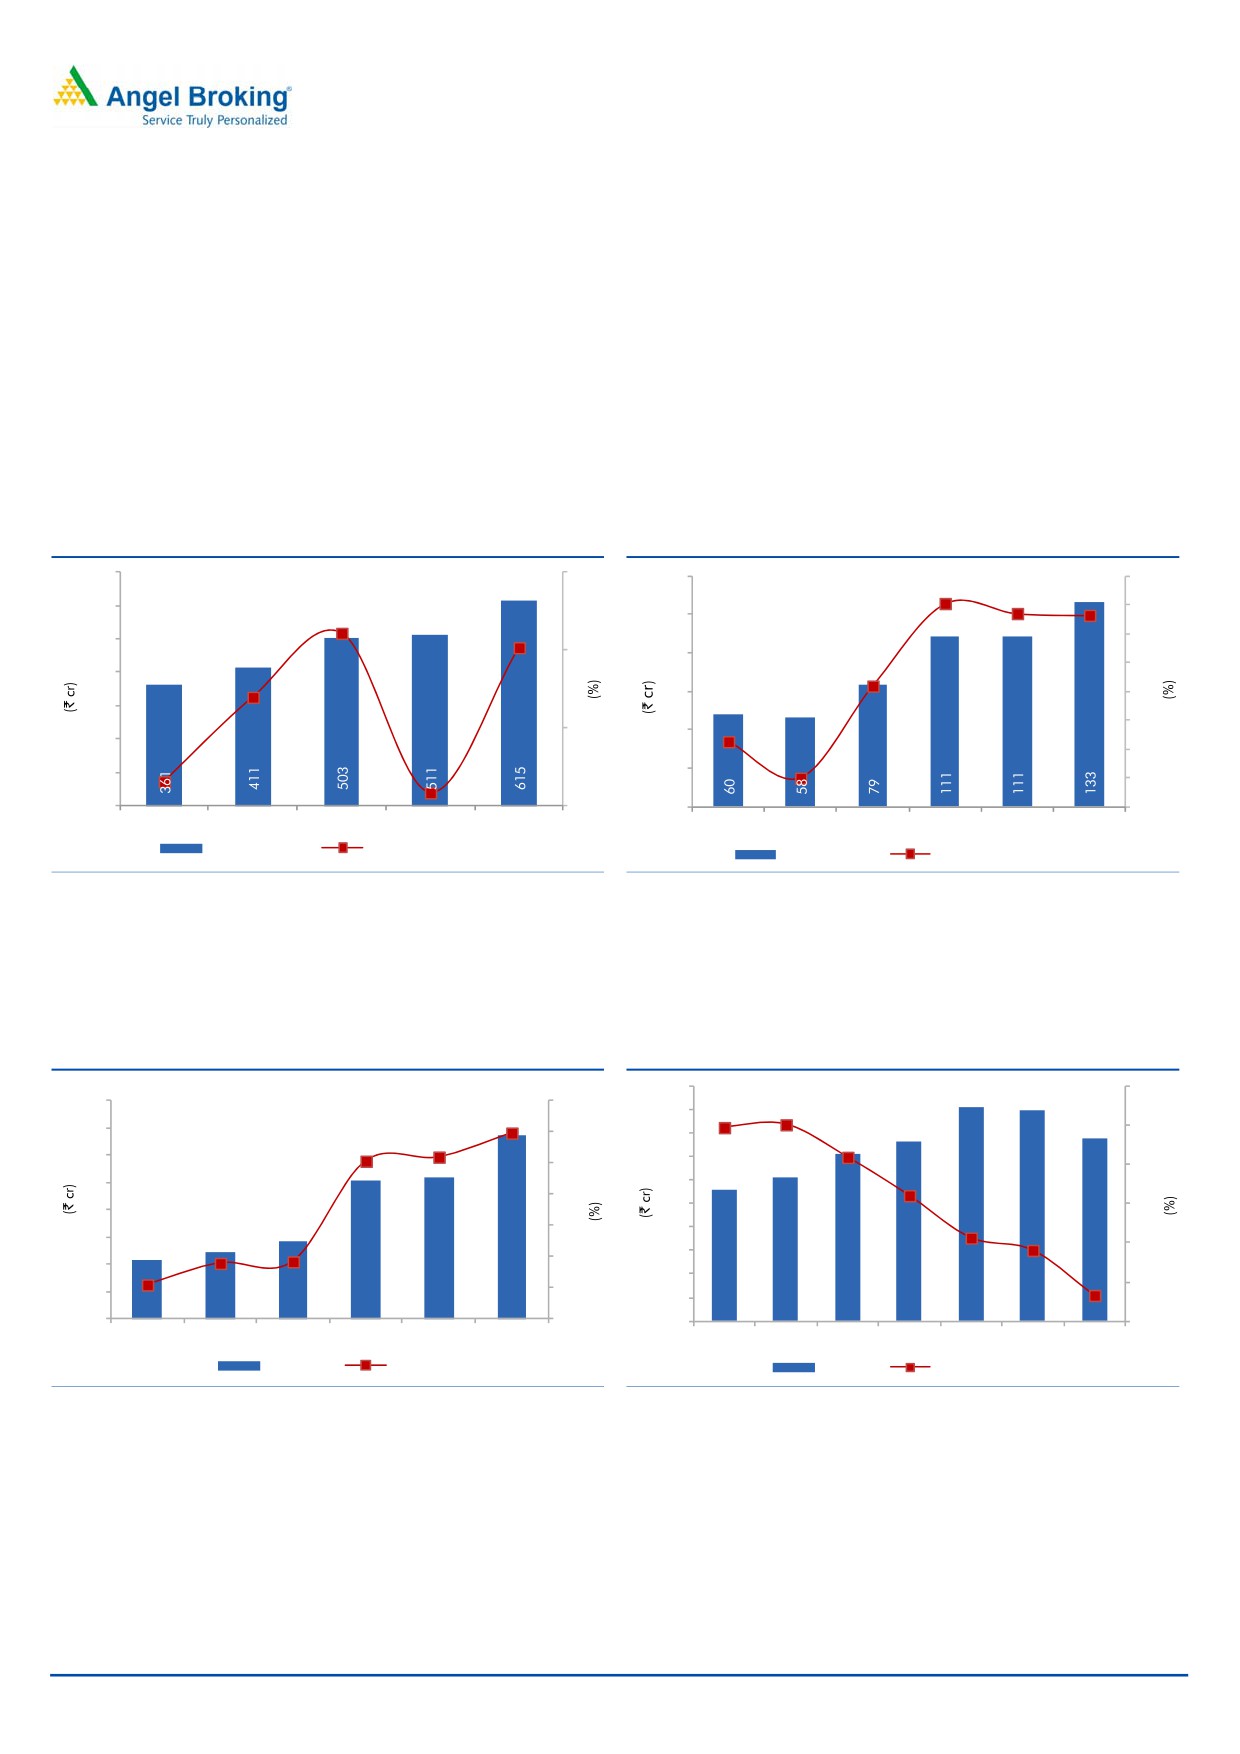
Exhibit 8: Improving CV sales to drive volume
Exhibit 9: EBITDA margin to improve
700
30
150
23
21.7
21.6
600
22.0
22
22.1
125
20.
3
21
500
20
100
19.2
20
400
75
19
13.9
300
18
10
50
200
17.3
17
16.0
100
3.1
25
1.7
16
0
0
0
15
FY2013
FY2014
FY2015
FY2016E
FY2017E
FY2012
FY2013
FY2014
FY2015
FY2016E FY2017E
Revenue (LHS)
Revenue growth (RHS)
EBITDA (LHS)
EBITDA Margin (RHS)
Source: Company, Angel Research
Source: Company, Angel Research
Raw material prices are expected to remain at lower levels largely due to lower
commodity prices. We expect the EBITDA margin to be at 21.6% in FY2017E.
Consequently, we expect the profit to be at `67cr in FY2017E.
Exhibit 10: PATM to improve
Exhibit 11: Net debt to equity to decrease
10
1.2
80
12.0
11.0
9
1.0
1.0
70
10.1
1.0
10.2
11.0
8
60
7
0.8
10.0
0.8
50
6
0.6
9.0
5
0.6
40
6.8
8.0
4
30
6.8
0.4
0.4
3
0.4
7.0
6.1
20
2
0.2
10
6.0
1
0.
1
21
24
28
51
52
67
6
6
7
8
9
9
8
0
5.0
0
0.0
FY2012
FY2013
FY2014
FY2015
FY2016E FY2017E
FY2011
FY2012
FY2013
FY2014
FY2015
FY2016E FY2017E
PAT (LHS)
PATM (RHS)
Interest
Net debt to equity
Source: Company, Angel Research
Source: Company, Angel Research
November 10, 2015
5
M M Forgings | 2QFY2016 Result Update
Exhibit 12: Relative valuation (Trailing twelve months)
Mcap Sales OPM
PAT
EPS
RoIC
P/E
P/BV
EV/EBITDA
EV/
Company
(` cr)
(` cr)
(%)
(` cr)
(`)
(%)
(x)
(x)
(x)
Sales (x)
M M Forgings
623
508
21.6
50
41.6
19.8
12.4
2.4
6.7
1.4
Ramkrishna Forgings
1,481
929
19.3
87
31.6
11.0
17.0
3.3
12.7
2.4
Source: Company, Angel Research;
Outlook and valuation: We expect MMFL to register a revenue CAGR of 10.6%
over FY2015-17E to `615cr in FY2017E. The company’s EBITDA margin is
expected to stabilize at 21.6% for FY2017E. Consequently, the net profit is
expected to improve to `67cr in FY2017E.
Given that the company is increasing its capacity to cater to improving demand
from domestic CV industry as well as from its major export market - USA, we are
positive on the company from a long term perspective.
At the current market price, the company is trading at a P/E of 9.3x its FY2017E
earnings. We have a Buy rating on the stock with a target price of `614 based on
a target P/E of 11.0x its FY2017E earnings.
Exhibit 13: One-year forward P/E band
800
Price (`)
4x
7x
10x
13x
700
600
500
400
300
200
100
0
Source: Company, Angel Research
Concerns
Continued slowdown in CV industry: The company earns a major portion of its
revenue from the CV industry, mainly in the US and Europe. Any prolonged
slowdown in these economies can adversely affect the company’s performance.
Adverse movement in currency: Rupee depreciation is an added advantage for the
company. In case of any appreciation, the revenue of the company will be
adversely affected.
Fluctuations in steel price: Any substantial fluctuation in the price of steel can lead
to margin compression for the company.
November 10, 2015
6
M M Forgings | 2QFY2016 Result Update
Company background
MM Forgings (MMFL) was incorporated in 1946 as Madras Motors Ltd. and was
renamed MM Forgings Ltd. in the year 1993. It is engaged in the manufacturing of
steel forgings, with a work force of 1,105 employees. It manufactures steel
forgings in raw, semi-machined and fully machined stages in various grades of
Carbon, Alloy, Micro-Alloy and Stainless Steels in the weight range of 0.20Kg to
60Kg. The company caters to the forging requirements of almost all sections of the
industry - Automotive, Valve and Oil-filed, Engineering and Off Highway.
The company’s manufacturing plants are located at Singampunari-Pasumpon
Muthuramalingam District, Viralimalai-Pudukkottai District and Karainaithangal
Village- Kanchipuram District, all in Tamil Nadu. The company has its Wind Farm
at Panakudi Village- Tirunelveli District and at Meenakshipuram, Theni District and
the power generated is utilised for captive use.
November 10, 2015
7
M M Forgings | 2QFY2016 Result Update
Profit and loss statement
Y/E Mar. (` cr)
FY2013
FY2014
FY2015
FY2016E
FY2017E
Net Sales
361
411
503
511
615
Other operating income
-
-
-
-
-
Total operating income
361
411
503
511
615
% chg
3.1
13.9
22.1
1.7
20.3
Net Raw Materials
154
176
207
203
249
% chg
4.9
14.4
17.3
-2.1
22.9
Power and Fuel
46
44
49
51
61
% chg
2.7
(5.0)
12.1
4.1
20.3
Personnel
31
39
48
55
65
% chg
11.8
25.1
24.9
15.0
17.0
Other
72
74
87
91
106
% chg
2.6
2.0
18.8
4.0
17.0
Total Expenditure
303
332
392
400
482
EBITDA
58
79
111
111
133
% chg
(4.4)
36.6
40.3
0.1
20.0
(% of Net Sales)
16.0
19.2
22.0
21.7
21.6
Depreciation
21
36
35
38
41
EBIT
37
43
75
73
92
% chg
(1.9)
17.1
75.7
(2.8)
25.4
(% of Net Sales)
10.1
10.4
15.0
14.3
14.9
Interest & other Charges
7
8
9
9
8
Other Income
1
3
2
5
5
(% of Net Sales)
0.1
0.8
0.5
0.9
0.9
Recurring PBT
30
35
66
64
84
% chg
(5.5)
19.5
87.9
(3.0)
30.8
PBT (reported)
30
38
69
69
89
Tax
6
9
18
17
22
(% of PBT)
18.6
23.7
26.4
24.6
24.6
PAT (reported)
24
29
51
52
67
Extraordinary Expense/(Inc.)
0
1
0
0
0
ADJ. PAT
24
28
51
52
67
% chg
14.8
14.8
80.0
3.0
29.4
(% of Net Sales)
6.8
6.8
10.1
10.2
11.0
Basic EPS (`)
20.3
23.3
41.9
43.1
55.8
Fully Diluted EPS (`)
20.3
23.3
41.9
43.1
55.8
% chg
14.8
14.8
80.0
3.0
29.4
November 10, 2015
8
M M Forgings | 2QFY2016 Result Update
Balance sheet
Y/E Mar. (` cr)
FY2013
FY2014
FY2015
FY2016E
FY2017E
SOURCES OF FUNDS
Equity Share Capital
12
12
12
12
12
Reserves& Surplus
160
184
226
274
337
Shareholders’ Funds
172
196
238
286
349
Total Loans
146
151
190
200
180
Other Long Term Liabilities
1
1
1
1
1
Long Term Provisions
0
0
0
0
0
Deferred Tax (Net)
11
11
12
12
12
Total liabilities
329
359
441
499
542
APPLICATION OF FUNDS
Gross Block
398
438
499
524
595
Less: Acc. Depreciation
202
238
273
311
352
Net Block
196
200
225
213
243
Capital Work-in-Progress
4
7
11
51
6
Goodwill
-
-
-
-
-
Investments
0
0
0
0
0
Long Term Loans and adv.
14
16
15
18
18
Other Non-current asset
3
4
4
4
5
Current Assets
146
151
218
239
301
Cash
1
25
89
96
134
Loans & Advances
39
20
21
21
26
Inventory
71
76
79
92
106
Debtors
34
29
29
30
36
Other current assets
0
0
0
0
0
Current liabilities
34
19
32
26
31
Net Current Assets
112
132
186
213
270
Misc. Exp. not written off
-
-
-
-
-
Total Assets
329
359
441
499
542
November 10, 2015
9
M M Forgings | 2QFY2016 Result Update
Cash flow statement
Y/E Mar. (` cr)
FY2013 FY2014
FY2015 FY2016E FY2017E
Profit before tax
30
38
69
69
89
Depreciation
21
36
35
38
41
Change in Working Capital
2
4
10
(20)
(20)
Direct taxes paid
(6)
(9)
(17)
(17)
(22)
Others
10
(34)
9
(5)
(5)
Cash Flow from Operations
57
35
106
65
83
(Inc.)/Dec. in Fixed Assets
(30)
(43)
(65)
(65)
(26)
(Inc.)/Dec. in Investments
(0)
-
-
-
-
(Incr)/Decr In LT loans & adv.
(5)
(3)
2
(3)
(1)
Others
6
6
0
5
5
Cash Flow from Investing
(30)
(40)
(63)
(63)
(22)
Issue of Equity
0
-
-
-
-
Inc./(Dec.) in loans
(9)
6
39
10
(20)
Dividend Paid (Incl. Tax)
(4)
(6)
(8)
(4)
(4)
Others
(15)
6
(10)
-
-
Cash Flow from Financing
(28)
6
21
5
(24)
Inc./(Dec.) in Cash
(0)
1
64
7
38
Opening Cash balances
1
24
25
89
96
Closing Cash balances
1
25
89
96
134
November 10, 2015
10
M M Forgings | 2QFY2016 Result Update
Key ratios
Y/E Mar.
FY2013
FY2014
FY2015
FY2016E
FY2017E
Valuation Ratio (x)
P/E (on FDEPS)
25.5
22.2
12.3
12.0
9.3
P/CEPS
13.7
9.7
7.3
7.0
5.7
P/BV
3.6
3.2
2.6
2.2
1.8
EV/Net sales
2.1
1.8
1.4
1.4
1.1
EV/EBITDA
13.3
9.5
6.5
6.6
5.0
EV / Total Assets
2.4
2.2
1.7
1.5
1.3
Per Share Data (`)
EPS (Basic)
20.3
23.3
41.9
43.1
55.8
EPS (fully diluted)
20.3
23.3
41.9
43.1
55.8
Cash EPS
37.8
53.1
71.2
74.3
89.9
DPS
3.0
4.0
6.0
6.0
6.0
Book Value
142.6
162.2
197.1
236.7
289.1
DuPont Analysis
EBIT margin
10.1
10.4
15.0
14.3
14.9
Tax retention ratio
0.8
0.8
0.7
0.8
0.8
Asset turnover (x)
1.2
1.3
1.6
1.5
1.7
ROIC (Post-tax)
9.7
10.4
17.2
16.6
19.0
Cost of Debt (Post Tax)
3.9
3.9
3.9
3.5
3.1
Leverage (x)
0.8
0.6
0.4
0.4
0.1
Operating ROE
14.6
14.6
22.9
21.3
21.1
Returns (%)
ROCE (Pre-tax)
11.7
12.9
19.4
16.0
18.1
Angel ROIC (Pre-tax)
11.9
13.7
23.4
22.0
25.2
ROE
15.1
15.3
23.3
19.9
21.2
Turnover ratios (x)
Asset TO (Gross Block)
0.9
1.0
1.1
1.0
1.1
Inventory / Net sales (days)
79
65
56
61
59
Receivables (days)
29
28
21
21
21
Payables (days)
34
29
24
24
24
WC cycle (ex-cash) (days)
113
96
74
76
75
Solvency ratios (x)
Net debt to equity
0.8
0.6
0.4
0.4
0.1
Net debt to EBITDA
2.5
1.6
0.9
0.9
0.3
Int. Coverage (EBIT/ Int.)
5.1
5.6
8.2
8.2
11.8
November 10, 2015
11
M M Forgings | 2QFY2016 Result Update
Research Team Tel: 022 - 39357800
DISCLAIMER
Angel Broking Private Limited (hereinafter referred to as “Angel”) is a registered Member of National Stock Exchange of India Limited,
Bombay Stock Exchange Limited and Metropolitan Stock Exchange of India Limited. It is also registered as a Depository Participant with
CDSL and Portfolio Manager with SEBI. It also has registration with AMFI as a Mutual Fund Distributor. Angel Broking Private Limited is
a registered entity with SEBI for Research Analyst in terms of SEBI (Research Analyst) Regulations, 2014 vide registration number
INH000000164. Angel or its associates has not been debarred/ suspended by SEBI or any other regulatory authority for accessing
/dealing in securities Market. Angel or its associates including its relatives/analyst do not hold any financial interest/beneficial
ownership of more than 1% in the company covered by Analyst. Angel or its associates/analyst has not received any compensation /
managed or co-managed public offering of securities of the company covered by Analyst during the past twelve months. Angel/analyst
has not served as an officer, director or employee of company covered by Analyst and has not been engaged in market making activity
of the company covered by Analyst.
This document is solely for the personal information of the recipient, and must not be singularly used as the basis of any investment
decision. Nothing in this document should be construed as investment or financial advice. Each recipient of this document should
make such investigations as they deem necessary to arrive at an independent evaluation of an investment in the securities of the
companies referred to in this document (including the merits and risks involved), and should consult their own advisors to determine
the merits and risks of such an investment.
Reports based on technical and derivative analysis center on studying charts of a stock's price movement, outstanding positions and
trading volume, as opposed to focusing on a company's fundamentals and, as such, may not match with a report on a company's
fundamentals.
The information in this document has been printed on the basis of publicly available information, internal data and other reliable
sources believed to be true, but we do not represent that it is accurate or complete and it should not be relied on as such, as this
document is for general guidance only. Angel Broking Pvt. Limited or any of its affiliates/ group companies shall not be in any way
responsible for any loss or damage that may arise to any person from any inadvertent error in the information contained in this report.
Angel Broking Pvt. Limited has not independently verified all the information contained within this document. Accordingly, we cannot
testify, nor make any representation or warranty, express or implied, to the accuracy, contents or data contained within this document.
While Angel Broking Pvt. Limited endeavors to update on a reasonable basis the information discussed in this material, there may be
regulatory, compliance, or other reasons that prevent us from doing so.
This document is being supplied to you solely for your information, and its contents, information or data may not be reproduced,
redistributed or passed on, directly or indirectly.
Neither Angel Broking Pvt. Limited, nor its directors, employees or affiliates shall be liable for any loss or damage that may arise from
or in connection with the use of this information.
Note: Please refer to the important ‘Stock Holding Disclosure' report on the Angel website (Research Section). Also, please refer to the
latest update on respective stocks for the disclosure status in respect of those stocks. Angel Broking Pvt. Limited and its affiliates may
have investment positions in the stocks recommended in this report.
Disclosure of Interest Statement
M M Forgings
1. Analyst ownership of the stock
No
2. Angel and its Group companies ownership of the stock
No
3. Angel and its Group companies' Directors ownership of the stock
No
4. Broking relationship with company covered
No
Note: We have not considered any Exposure below ` 1 lakh for Angel, its Group companies and Directors
Ratings (Based on expected returns
Buy (> 15%)
Accumulate (5% to 15%)
Neutral (-5 to 5%)
over 12 months investment period):
Reduce (-5% to -15%)
Sell (< -15%)
November 10, 2015
12