Company Update | Infrastructure
April 4, 2016
MBL Infrastructures
BUY
CMP
`154
Wins projects worth `2,126cr
Target Price
`285
MBL Infrastructures (MBL) reported having won 2 NHAI road projects worth
Investment Period
12 Months
`2,126cr on Hybrid Annuity model.
Stock Info
The first project entails 4-laning of Chutmultpur-Ganeshpur section of NH-72A to
Sector
Infrastructure
Roorkee-Chutmalpur-Gagalheri section of NH-73, covering a stretch of 53.3kms.
Market Cap (` cr)
638
MBL won this project at a bid price of `942cr, against the NHAI base price of
Net debt (` cr)
987
`809.88cr. This Hybrid Annuity project is a 15-year project, which includes 730
Beta
1.0
days of construction period.
52 Week High / Low
320/116
The second project covers 4-laning of Gagalheri-Saharanpur-Yamunanagar
Avg. Daily Volume
122,396
Face Value (`)
10
section of NH-73, covering a 51.455kms stretch. MBL won this project at a bid
price of `1,184cr, against NHAI base price of `1,009.36cr. This Hybrid Annuity
BSE Sensex
25,270
Nifty
7,713
project is a 15-year project, which includes 730 days of construction period.
Reuters Code
MBLI.BO
For both the projects, Sadbhav Engineering was the second lowest bidder.
Bloomberg Code
MBL@IN
MBL’s unexecuted order book as of 3QFY2016 stood at ~`4,748cr (order book
[OB] to LTM revenues at ~2.0x). With these 2 project wins, we now expect MBL to
Shareholding Pattern (%)
end FY2016 with OB to LTM sales ratio of ~2.8x, indicating better revenue
Promoters
46.7
visibility.
MF / Banks / Indian Fls
31.2
Outlook and valuation: MBL’s stock price has corrected by ~50% in the last 12
FII / NRIs / OCBs
6.6
months period owing to order book concerns. For FY2016, MBL has surpassed its
Indian Public / Others
15.6
order inflow guidance of `2,500cr. Considering the strong roads & highways bid
pipeline and MBL’s strong market positioning, we are optimistic that MBL has a
Abs. (%)
3m 1yr 3yr
fair chance of attaining its order inflow guidance of `2,800cr for FY2017E. Post
the recent order wins, concern over its order book get allayed up to certain
Sensex
(3.4)
(10.6)
32.7
extent. Also 3 of its BOT projects are expected to commence operations in
MBL
(31.5)
(50.4)
110.1
FY2016-17E, which should lead to initiation of debt repayment cycle at SPV level.
All these positives shaping-up comfort us that the stock is poised to get re-rated.
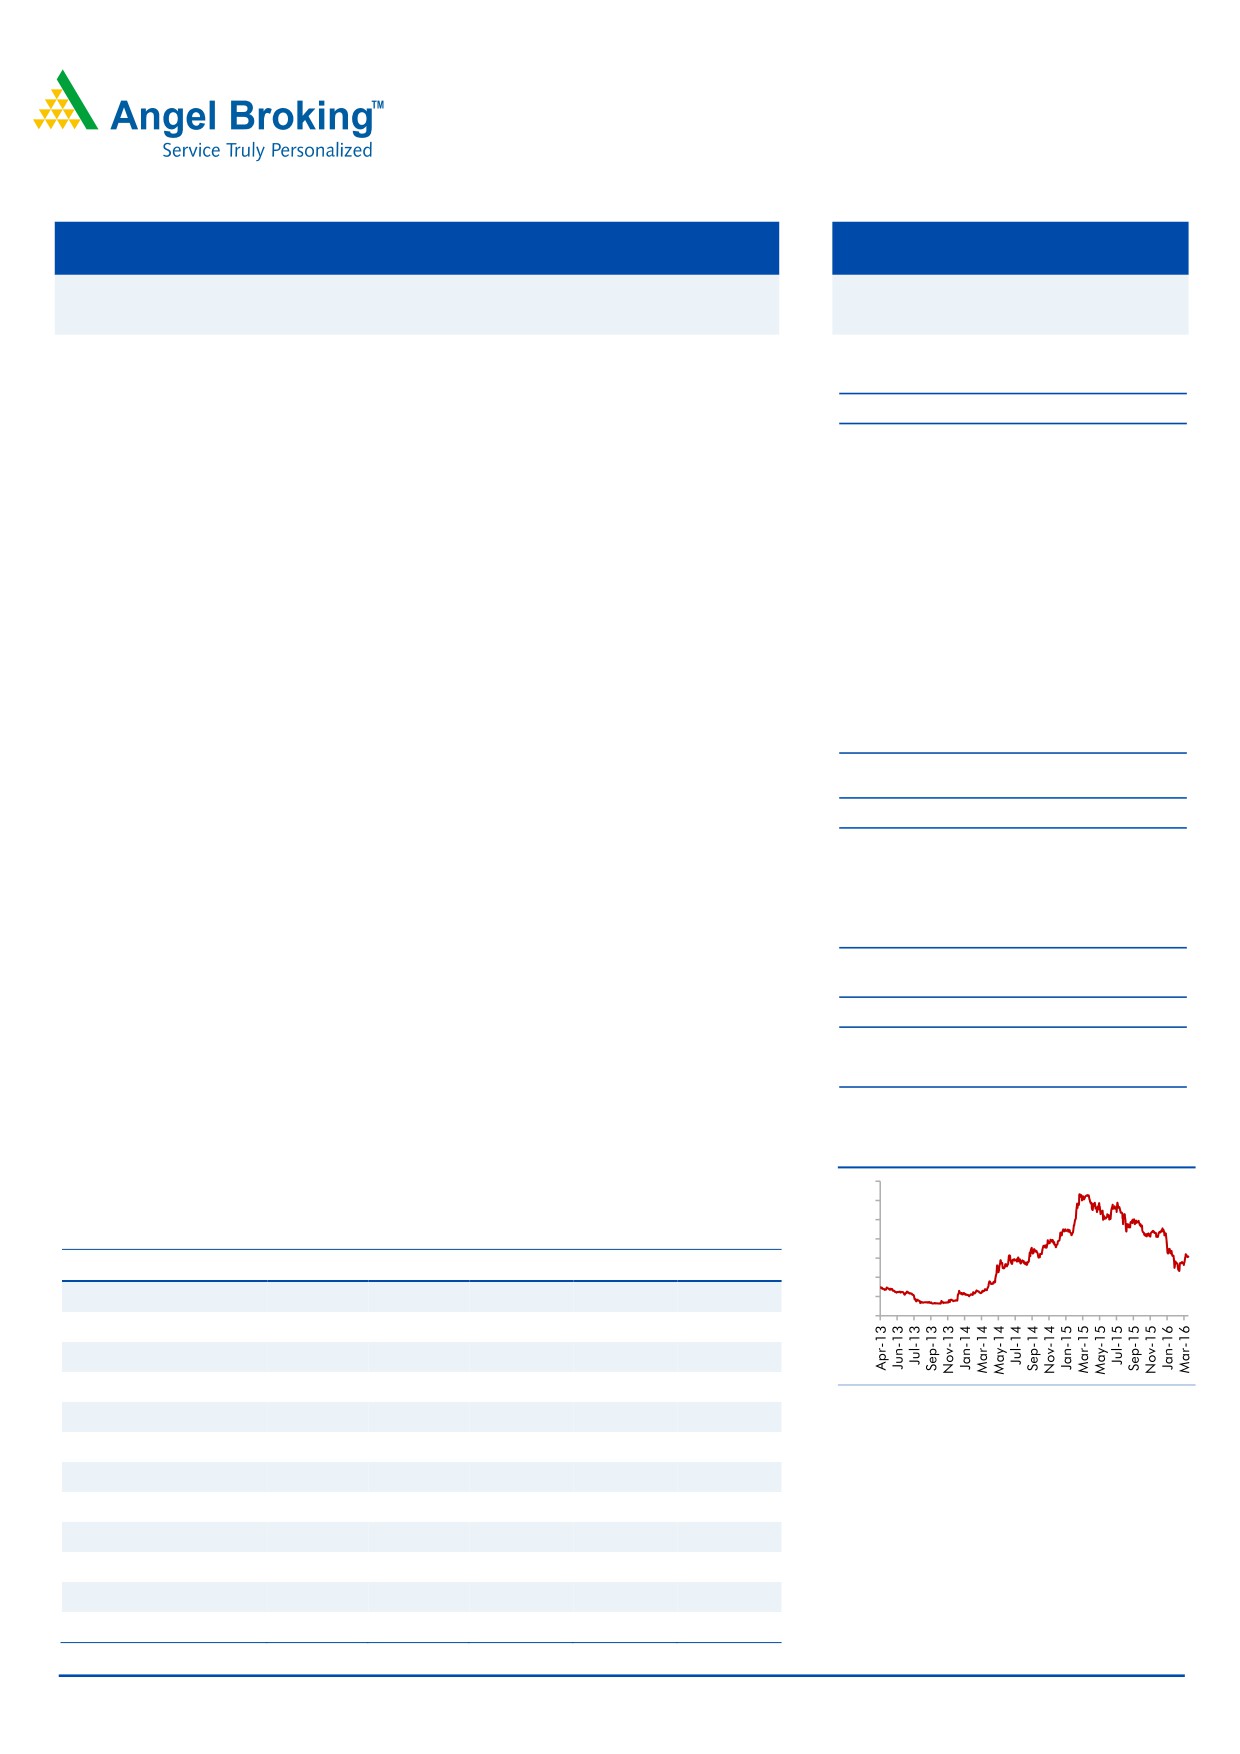
3-Year Daily Price Chart
Using SoTP based valuation methodology we arrive at FY2017E based price
350
target of `285. Given the upside potential, we maintain our Buy on the stock.
300
250
Key financials (Consolidated)
200
150
Y/E March (` cr)
FY13
FY14
FY15P
FY16E
FY17E
100
Net Sales
1,355
1,766
1,962
2,313
2,797
50
0
% chg
30.3
11.1
17.9
21.0
Net Profit
57
77
82
80
84
% chg
35.9
6.0
(2.1)
5.0
Source: Company, Angel Research
EBITDA (%)
10.6
10.7
12.1
12.2
14.6
EPS (`)
32
44
39
19
20
P/E (x)
4.8
3.5
3.9
8.0
7.6
P/BV (x)
0.7
0.6
0.5
0.8
0.8
RoE (%)
15.2
17.8
14.5
11.3
10.6
RoCE (%)
14.6
15.6
14.9
12.1
13.9
Yellapu Santosh
EV/Sales (x)
0.6
0.6
0.7
1.0
0.9
022 - 3935 7800 Ext: 6811
EV/EBITDA (x)
5.8
5.2
5.5
8.0
6.0
Source: Company, Angel Research; CMP as of April 1, 2016
Please refer to important disclosures at the end of this report
1
MBL Infrastructures | Company Update
Profit and Loss Statement (Consolidated)
Y/E March (` cr)
FY13
FY14
FY15
FY16E
FY17E
Net Sales
1,355
1,766
1,962
2,313
2,797
% Chg
30.3
11.1
17.9
21.0
Total Expenditure
1,212
1,578
1,725
2,031
2,389
Cost of Materials Consumed
954
1,376
1,517
1,777
2,089
Direct Labour, Sub-Contracts
180
118
84
138
161
Employee benefits Expense
23
27
37
36
41
Other Expenses
55
57
87
79
98
EBITDA
143
188
237
282
408
% Chg
31.2
25.9
19.0
44.8
EBIDTA %
10.6
10.7
12.1
12.2
14.6
Depreciation
11
14
20
33
57
EBIT
132
174
217
249
351
% Chg
31.6
24.5
14.8
41.1
Interest and Financial Charges
58
75
101
140
246
Other Income
2
4
3
3
3
PBT
76
103
119
111
108
Tax
20
26
37
31
39
% of PBT
25.7
25.2
31.3
28.1
35.6
PAT before Exceptional item
57
77
82
80
70
Exceptional item
0
0
0
0
0
PAT before Minority Interest
57
77
82
80
70
Minority Interest
0
0
0
0
(14)
PAT after Minority Interest
57
77
82
80
84
% Chg
35.9
6.0
(2.1)
5.0
PAT %
4.2
4.4
4.2
3.5
3.0
Diluted EPS
32
44
39
19
20
% Chg
36.0
(10.5)
(51.1)
5.0
April 4, 2016
2
MBL Infrastructures | Company Update
Balance Sheet (Consolidated)
Y/E March (` cr)
FY13
FY14
FY15
FY16E
FY17E
Sources of Funds
Equity Capital
18
18
21
41
41
Reserves Total
380
451
635
715
779
Networth
398
469
656
756
820
Total Debt
644
772
1,063
1,680
1,848
Other Long-term Liabilities
44
40
80
73
73
Minority Interest
0
32
0
0
(14)
Deferred Tax Liability
30
34
41
35
35
Total Liabilities
1,116
1,347
1,839
2,544
2,762
Application of Funds
Gross Block
248
287
351
921
1,663
Accumulated Depreciation
59
73
91
120
181
Net Block
189
214
260
801
1,482
Capital WIP
209
376
497
620
0
Investments
20
20
24
24
24
Current Assets
Inventories
`491
559
811
807
919
Sundry Debtors
253
318
395
450
544
Cash and Bank Balance
77
68
76
49
39
Loans, Advances & Deposits
72
98
88
101
104
Other Current Asset
6
8
7
6
7
Current Liabilities
208
330
379
375
417
Net Current Assets
692
721
998
1,038
1,195
Other Assets
6
16
61
61
61
Total Assets
1,116
1,347
1,839
2,544
2,762
April 4, 2016
3
MBL Infrastructures | Company Update
Cash Flow Statement (Consolidated)
Y/E March (` cr)
FY13
FY14
FY15
FY16E
FY17E
Profit before tax
76
103
119
111
108
Depreciation
11
14
20
33
57
Change in Working Capital
(35)
(56)
(261)
(217)
(488)
Interest & Financial Charges
58
75
101
140
246
Direct taxes paid
(48)
(14)
(37)
(31)
(39)
Cash Flow from Operations
62
122
(58)
37
(115)
(Inc)/ Dec in Fixed Assets
(172)
(206)
(186)
(552)
197
(Inc)/ Dec in Investments
(20)
0
(4)
0
0
Cash Flow from Investing
(191)
(206)
(190)
(552)
197
Issue/ (Buy Back) of Equity
0
0
117
21
0
Inc./ (Dec.) in Loans
202
128
290
617
176
Dividend Paid (Incl. Tax)
(3)
(6)
(7)
(8)
(9)
Interest Expenses
(58)
(75)
(101)
(140)
(246)
Minority Interest
0
32
(32)
0
(14)
Cash Flow from Financing
142
78
267
490
(92)
Inc./(Dec.) in Cash
13
(6)
18
(26)
(11)
Opening Cash balances
50
63
57
75
49
Closing Cash balances
63
57
75
49
39
April 4, 2016
4
MBL Infrastructures | Company Update
Key Ratios (Consolidated)
Y/E March
FY13
FY14
FY15
FY16E
FY17E
Valuation Ratio (x)
P/E (on FDEPS)
4.8
3.5
3.9
8.0
7.6
P/CEPS
4.0
3.0
3.1
5.6
4.5
Dividend yield (%)
1.5
1.5
1.5
0.8
0.9
EV/Sales
0.6
0.6
0.7
1.0
0.9
EV/EBITDA
5.8
5.2
5.5
8.0
6.0
EV / Total Assets
0.8
0.7
0.7
0.9
0.9
Per Share Data (`)
EPS (fully diluted)
32.3
44.0
39.4
19.3
20.2
Cash EPS
38.7
52.0
49.1
27.3
34.0
DPS
3.0
3.0
3.1
1.6
1.9
Book Value
227.1
267.6
316.5
182.5
197.9
Returns (%)
RoCE (Pre-tax)
14.6
15.6
14.9
12.1
13.9
Angel RoIC (Pre-tax)
12.9
14.4
12.8
10.3
13.3
RoE
15.2
17.8
14.5
11.3
10.6
Turnover ratios (x)
Asset Turnover (Gross Block) (X)
0.6
0.7
0.7
0.5
0.4
Inventory / Sales (days)
127
108
127
128
113
Receivables (days)
57
59
66
67
65
Payables (days)
18
25
37
32
19
Leverage Ratios (x)
D/E ratio (x)
1.6
1.6
1.6
2.2
2.3
Interest Coverage Ratio (x)
2.3
2.4
2.2
1.8
1.4
April 4, 2016
5
MBL Infrastructures | Company Update
Research Team Tel: 022 - 39357800
DISCLAIMER
Angel Broking Private Limited (hereinafter referred to as “Angel”) is a registered Member of National Stock Exchange of India Limited,
Bombay Stock Exchange Limited and MCX Stock Exchange Limited. It is also registered as a Depository Participant with CDSL and
Portfolio Manager with SEBI. It also has registration with AMFI as a Mutual Fund Distributor. Angel Broking Private Limited is a
registered entity with SEBI for Research Analyst in terms of SEBI (Research Analyst) Regulations, 2014 vide registration number
INH000000164. Angel or its associates has not been debarred/ suspended by SEBI or any other regulatory authority for accessing
/dealing in securities Market. Angel or its associates including its relatives/analyst do not hold any financial interest/beneficial
ownership of more than 1% in the company covered by Analyst. Angel or its associates/analyst has not received any compensation /
managed or co-managed public offering of securities of the company covered by Analyst during the past twelve months. Angel/analyst
has not served as an officer, director or employee of company covered by Analyst and has not been engaged in market making activity
of the company covered by Analyst.
This document is solely for the personal information of the recipient, and must not be singularly used as the basis of any investment
decision. Nothing in this document should be construed as investment or financial advice. Each recipient of this document should
make such investigations as they deem necessary to arrive at an independent evaluation of an investment in the securities of the
companies referred to in this document (including the merits and risks involved), and should consult their own advisors to determine
the merits and risks of such an investment.
Reports based on technical and derivative analysis center on studying charts of a stock's price movement, outstanding positions and
trading volume, as opposed to focusing on a company's fundamentals and, as such, may not match with a report on a company's
fundamentals.
The information in this document has been printed on the basis of publicly available information, internal data and other reliable
sources believed to be true, but we do not represent that it is accurate or complete and it should not be relied on as such, as this
document is for general guidance only. Angel Broking Pvt. Limited or any of its affiliates/ group companies shall not be in any way
responsible for any loss or damage that may arise to any person from any inadvertent error in the information contained in this report.
Angel Broking Pvt. Limited has not independently verified all the information contained within this document. Accordingly, we cannot
testify, nor make any representation or warranty, express or implied, to the accuracy, contents or data contained within this document.
While Angel Broking Pvt. Limited endeavors to update on a reasonable basis the information discussed in this material, there may be
regulatory, compliance, or other reasons that prevent us from doing so.
This document is being supplied to you solely for your information, and its contents, information or data may not be reproduced,
redistributed or passed on, directly or indirectly.
Neither Angel Broking Pvt. Limited, nor its directors, employees or affiliates shall be liable for any loss or damage that may arise from
or in connection with the use of this information.
Note: Please refer to the important ‘Stock Holding Disclosure' report on the Angel website (Research Section). Also, please refer to the
latest update on respective stocks for the disclosure status in respect of those stocks. Angel Broking Pvt. Limited and its affiliates may
have investment positions in the stocks recommended in this report.
Disclosure of Interest Statement
MBL Infrastructures
1. Analyst ownership of the stock
No
2. Angel and its Group companies ownership of the stock
No
3. Angel and its Group companies' Directors ownership of the stock
No
4. Broking relationship with company covered
No
Note: We have not considered any Exposure below ` 1 lakh for Angel, its Group companies and Directors
Ratings (Based on expected returns
Buy (> 15%)
Accumulate (5% to 15%)
Neutral (-5 to 5%)
over 12 months investment period):
Reduce (-5% to -15%)
Sell (< -15%)
April 4, 2016
6