IPO Note | Financials
Oct 05, 2017
MAS Financials Services Ltd
SUBSCRIBE
sue Open: Oct 06, 2017
Is
On the track to excel
Issue Close: Oct 10, 2017
MAS Financial Services (MAS) is a Gujarat based NBFC, which is two decades
old. It primarily lends to Micro Enterprises (ME) and SME, which contribute 60%
and 23% of its AUM respectively. Company’s business and financing is in five
Issue Details
categories i.e. micro-enterprise loan, SME loans, two wheeler loans, commercial
Face Value: `10
vehicle loans and housing loans. Company’s AUM has grown at healthy 33.4%
Present Eq. Paid up Capital: `91.5cr
CAGR over FY2013-17 with strong asset quality (GNPA -1.1%, NNPA -0.9%).
Expanding offerings to support AUM growth: MAS had begun its journey with a
Offer for Sale: **0.49cr Shares
clear focus to ME and gradually expanded its offerings to two wheeler & CV
segments for its existing client. FY2012 onwards, MAS commenced lending to
Fresh issue: `233cr
SME and Housing loan, which is growing at a very healthy rate. To leverage
Post Eq. Paid up Capital: `96.5cr
existing client base and network further it has extended loans to the agricultural
input and equipment segment.
Issue size (amount): *`457cr -**460 cr
Fairly strong AUM growth at 33.4% CAGR over FY2013-17: Focused approach
towards asset financing, ability to find out gaps and the underserved sections of
Price Band: `456-459
the micro enterprise SME, Vehicle Finance, segments has helped the company to
Lot Size: 32 shares and in multiple
achieve a strong 33.4% CAGR in AUM over FY2013-17.
thereafter
Healthy return ratios: MAS has reported average ROE/ROA of 27.9%/3.2% over
Post-issue implied mkt. cap: *`2,492cr
last 5 years. Higher return ratios are largely driven by lower Cost to Income(C/I)
- **`2,508cr
(33.5%) and lower provisioning expenses. C/I has declined from 43.7% in
Promoters holding Pre-Issue: 80.7%
FY2013 to 33.5% in FY2017, and we believe C/I would continue to decline
Promoters holding Post-Issue: 73.2%
further.
Strong asset quality; sufficient CAR to support growth: Robust credit assessment
*Calculated on lower price band
process and clever understanding of targeted market has helped to keep GNPA at
** Calculated on upper price band
1% over last 5 years. As on 1QFY2018, CAR stood at 23.8% and post IPO CAR
Book Building
would further increase. With strong internal capital generation ability, present
high CAR and IPO proceeds would not require MAS to dilute equity for high
QIBs
50% of issue
growth in near future.
Non-Institutional
15% of issue
High valuations underpinned by high growth potential and profitability: Close
Retail
35% of issue
peers, Capital First and Shriram City Union Finance are trading at ~3x FY2017
book, however both the companies report moderate ROE of 11%. At the upper
end of the price band, MAS is valued at 6.85x of FY2017 book value (Pre-IPO)
Post Issue Shareholding Patter
and on post dilution basis at 4.1x of Book value. Although valuations are on the
Promoters
73%
higher side, looking at the strong and sustainable growth and ROE prospects of
the company, we recommend a Subscribe to the issue.
Others
27%
Key Financials
Y/E March (` cr)
FY13
FY14
FY15
FY16
FY17
NII
71
90
105
136
172
YoY Growth (%)
-
27
16
30
27
PAT
27
33
40
51
69
YoY Growth (%)
-
19
23
27
35
EPS
6
7
8
10
14
Book Value
21
26
32
37
67
P/E
83
70
57
45
33
P/BV
21
18
14
12
7
Jaikishan J Parmar
ROE (%)
26
28
28
30
27
+022 39357600, Extn: 6810
ROA (%)
3
3
3
3
3
Source: RHP, Angel Research; Note: Valuation ratios based on pre-issue outstanding shares and at upper end of the price band d
Please refer to important disclosures at the end of this report
1
MAS Financials Services Ltd | IPO Note
Company Background
MAS Fin Ser is a Gujarat-headquartered NBFC with more than two decades of
business operations and as of June 30, 2017, it operated across six States and the
NCT of Delhi. The financing activity are primarily focused on middle and low
income customer segments, and include five principal categories: (i) micro-
enterprise loans; (ii) SME loans; (iii) two-wheeler loans; (iv) Commercial Vehicle
loans (which include new and used commercial vehicle loans, used car loans and
tractor loans); and (v) housing loans.
As of Q4FY17 and Q1FY18, the company’s AUM was `3,332.6cr and `3,451.7
cr, respectively. AUM increased at a CAGR of 33.4% from `1,053.2cr as of FY13
to `3,332.6cr as of FY17. As of June 30, 2017 MAS had more than 500,000
active loan accounts, across more than 3,165 Customer Locations in six States and
the NCT of Delhi, served through our 121 branches.
Exhibit 1: Business Segments
ME
SME Two Wheeler
CV Housing
AUM (` Cr )
1,984.86
763.84
285.39
122.06
3,332.57
% of AUM
60
23
9
4
5
Average Ticket Size
`36,000
`55lacs
`43,000
`1.5lacs
`14lacs
4 Yr CAGR
32
138
6
3
44
Loan Tenure
36 Months
-
36 Months
60 Months 240 Months
Source: RHP, Angel Research
Key Management Personnel
Mr. Kamlesh Chimanlal Gandhi is Chairman & Managing Director (Founder of
MAS). He received the higher secondary school examination certificate from the
Gujarat Secondary Education Board, Gandhinagar in 1983. He has over 21 years
of experience in the financial services sector.
Mr. Mukesh Chimanlal Gandhi is a whole-time Director and Chief Financial
Officer of the Company. He has been associated with the Company since May 25,
1995. He holds bachelor’s and master’s degrees in commerce from Gujarat
University. He is also the chairman of the Gujarat Finance Company Association
and a director of the Finance Industry Development Council.
Darshana Saumil Pandya is an executive Director of the Company. She has been
associated with the Company since June 1, 1996. She holds a bachelor’s degree
in commerce from Gujarat University. Presently, she also holds the position of the
Chief Operating Officer of the Company.
Oct 05, 2017
2
MAS Financials Services Ltd | IPO Note
Issue details
This IPO is a mix of OFS and issue of fresh shares. The issue would constitute fresh
issue worth of `233cr and OFS worth of `227cr. OFS largely would offer exit to
early investors namely FMO, DEG & Sarva Capital.
Exhibit 2: Pre and Post-IPO shareholding pattern
No of shares
No of shares
%
%
(Pre-issue)
(Post-issue)
Promoter
3,99,96,975
80.7
3,99,96,975
73.2
Investor/Public
95,72,239
19.3
1,46,48,491
26.8
4,95,69,214
100.0
5,46,45,466
100.0
Source: RHP Note: Calculated on upper price band
Objects of the offer
To achieve benefits of listing equity shares on stock exchanges and to carry out
the offer for sale. Listing of equity shares will enhance MAS’ brand name and
provide liquidity to existing shareholders.
The Company would utilise the proceeds from the Fresh Issue towards
augmenting its capital base to meet future capital requirements.
Oct 05, 2017
3
MAS Financials Services Ltd | IPO Note
Expanding offerings to support AUM growth: MAS has begun its journey with a
clear focus to ME and gradually expanded its offering in two wheeler & CV to
existing client. FY12 onwards MAS has commence lending to SME and Housing
loan, which is growing at a very healthy rate. To Leverage existing client base and
network further it has extended loans to the agricultural input and equipment
segment.
Exhibit 3: Segmental Gross AUM (` Cr )
FY13
FY14
FY15
FY16
FY17
CAGR FY13-17
ME
651
948
1,386
1,735
1,985
32%
YoY Growth %
46
46
25
14
SME
24
75
215
429
764
138%
YoY Growth %
214
185
100
78
Two Wheeler
227
229
240
258
285
6%
YoY Growth %
1
5
7
11
CV
110
139
164
144
122
3%
YoY Growth %
26
18
-12
-15
Housing Loan
41
65
94
135
176
44%
YoY Growth %
60
44
43
31
Total AUM
1,053
1,743
2,354
2,820
3,421
33%
YoY Growth %
66
35
20
21
Source: RHP
We believe ME & SME would continue to support advance growth going forward.
However, housing finance and newly ventured segment i.e. farm loan would
propel loan growth going forward. It intends to offer loans to farmers to acquire
accessories, implements and tractors in collaboration with dealers, manufacturers
and distributors as sourcing intermediaries. The proximity of these sourcing
intermediaries with farmers enables them to generate quality leads for MAS.
Power equipment, hybrid seeds penetration, and higher usage of bio-pesticides
and bio-fertilisers will drive growth close to 15% in FY2017 and over 10%
thereafter, compared to a single digit growth for most large sub segments in Fiscal
2016. (Source: CRISIL Agri Report, 2016)
Agricultural finance segment had a market size of `8.8 trillion in FY2016. The
expectation of good monsoons is expected to increase demand for agriculture
credit. A growth of 13-15% is expected going ahead in agricultural financing in
India.
Oct 05, 2017
4
MAS Financials Services Ltd | IPO Note
Fairly strong AUM growth at 33.4% CAGR over FY2013-17: Focused approach
towards asset financing, the ability to find out gaps and the underserved sections
of the micro enterprise SME, Vehicle Finance segments has helped the company to
achieve a strong 33.4% CAGR in AUM over FY2013-17.
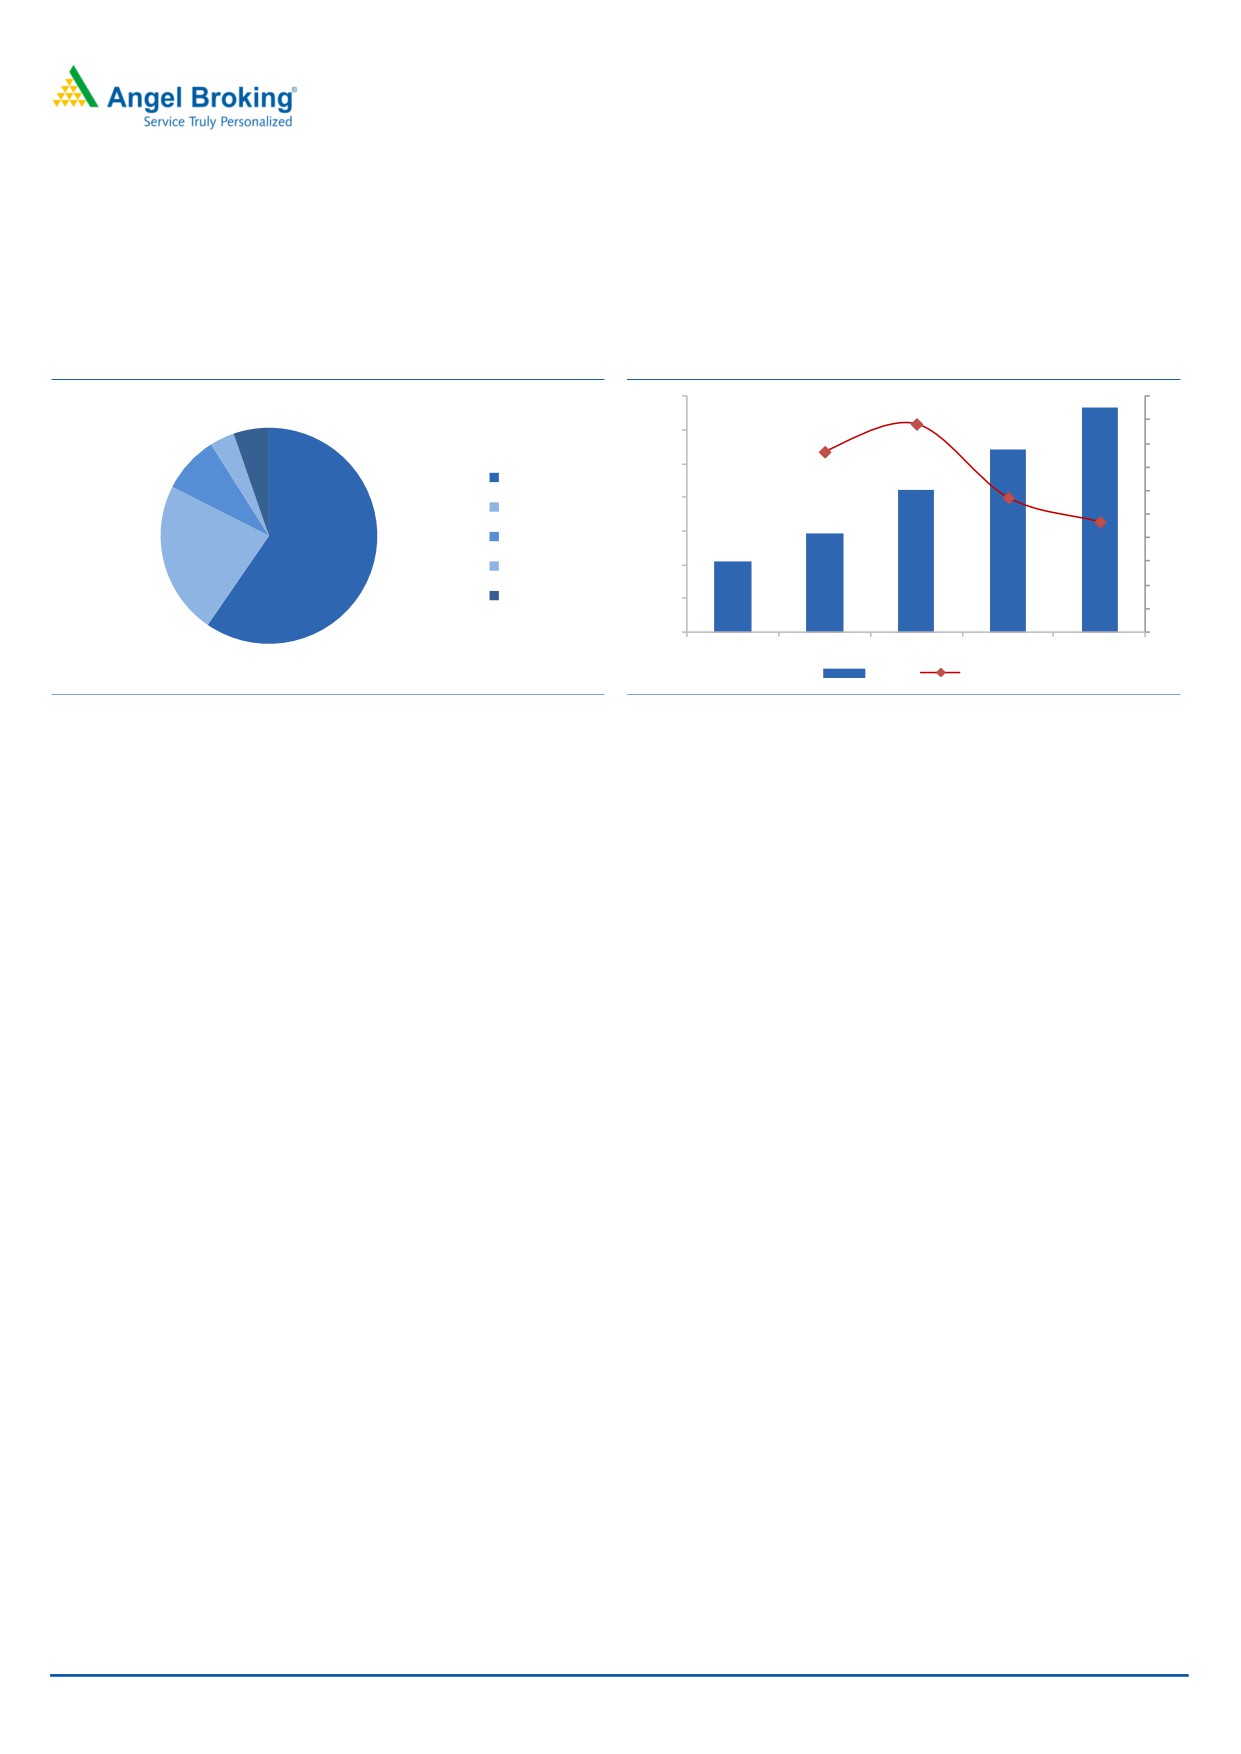
Exhibit 4: Loan Book Composition (%) FY17
Exhibit 5: AUM Growth Trend
3,500
44
50
45
4%
3,000
38
5%
40
2,500
35
9%
ME
29
30
2,000
23
SME
25
Two Wheeler
1,500
20
23%
60%
CV
1,000
15
10
Housing
500
5
1,053
1,456
2,100
2,700
3,333
0
0
FY13
FY14
FY15
FY16
FY17
AUM
% Growth YoY
Source: RHP
Source: RHP
Micro-financing is aimed at aiding the under-privileged in undertaking economic
activity, smoothening consumption and mitigating vulnerability to income shocks
(in times of illness and natural disasters), thereby increasing their savings. Focused
players like MAS, have been able to grow their book at healthy rate by catering to
these segments. Additionally, NBFCs have been gaining market share in the
growing credit market in India.
Oct 05, 2017
5
MAS Financials Services Ltd | IPO Note
Healthy return ratios: MAS has reported average ROE/ROA of 27.9%/3.2% over
last 5 years. Higher return ratios are largely driven by lower Cost to Income(C/I)
(33.5%) and lower provisioning expenses. C/I has declined from 43.7% in FY2013
to 33.5% in FY2017, and we believe C/I would continue to decline further.
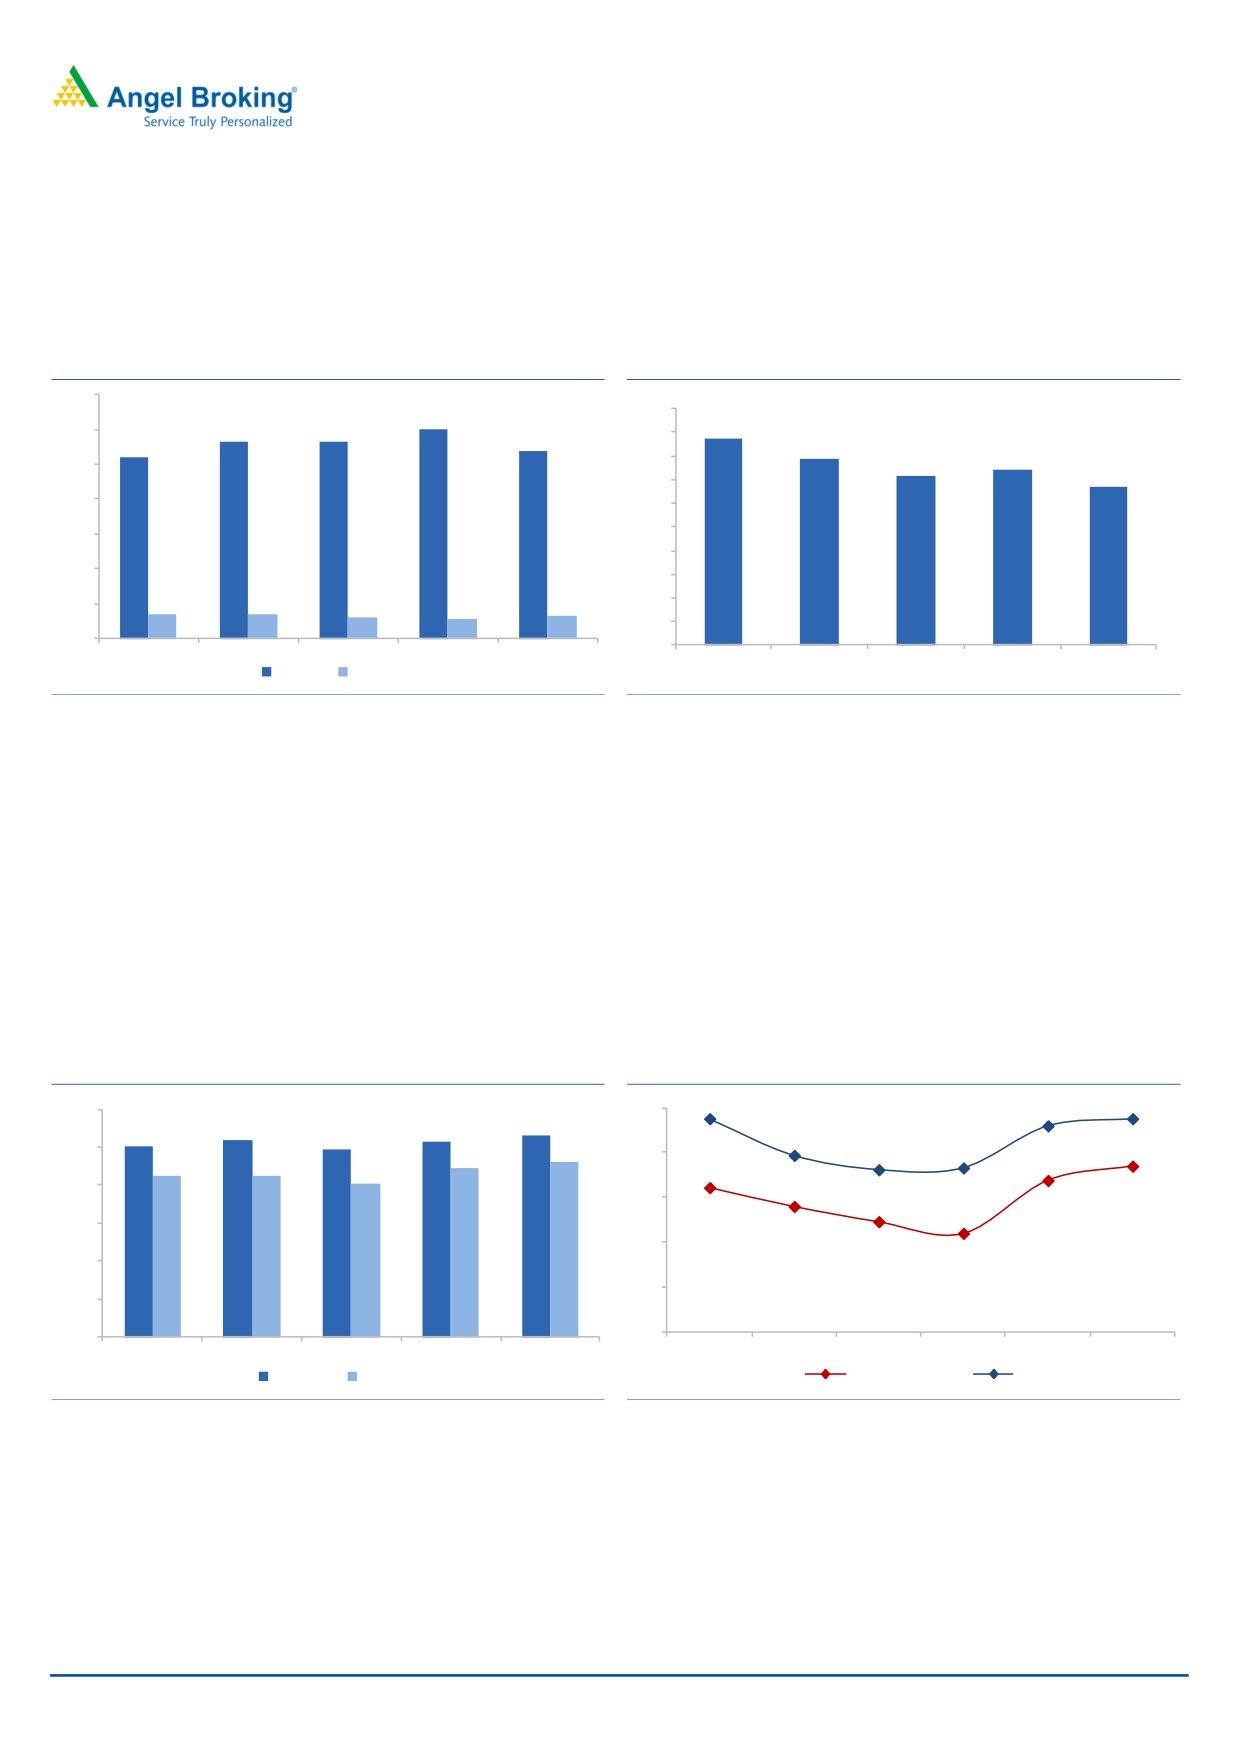
Exhibit 6: consistently delivering strong returns
Exhibit 7: Cost to Income ratio (%)
35
30
50
28
28
30
27
45
26
40
25
35
20
30
25
15
20
10
15
3.4
3.4
3.0
3.3
10
2.9
5
5
44
39
36
37
34
-
0
FY13
FY14
FY15
FY16
FY17
FY13
FY14
FY15
FY16
FY17
ROE (%) ROA (%)
Source: RHP
Source: RHP
Strong asset quality; sufficient CAR to support growth: Robust credit assessment
process and clever understanding of targeted market has helped the company to
keep GNPA at 1% over last 5 years. The Company has been strategically
expanding its footprint after understanding targeted market in detail. Presently, it
has very strong foothold in Gujarat & Maharashtra. As on 1QFY2018, CAR stood
at 23.8% and post IPO, CAR would further increase. With strong internal capital
generation ability, present high CAR and IPO proceeds, MAS would be able to
grow without dilution in the near term.
Exhibit 8: Robust Asset Quality
Exhibit 9: Capital Adequacy Ratio
1.2
25
23
1.0
1.0
1.1
1.0
1.0
23.8
19.7
23.8
1.0
0.9
18.1
18.3
0.9
20
0.9
0.9
0.8
0.8
18.5
15
16.9
16.1
0.6
14
10
12.3
0.4
11
5
0.2
0
-
FY13
FY14
FY15
FY16
FY17
Q1FY18
FY13
FY14
FY15
FY16
FY17
GNPA (%) NPA (%)
CRAR Tier -1(%)
CRAR (%)
Source: RHP
Source: RHP
Oct 05, 2017
6
MAS Financials Services Ltd | IPO Note
Outlook & Valuation
High valuations underpinned by high growth potential and profitability: Close
peers, Capital First and Shriram City Union Finance are trading at ~3x FY2017
book, however both the companies report moderate ROE of 11%. At the upper
end of the price band, MAS is valued at 6.85x of FY2017 book value (Pre-IPO)
and on post dilution basis at 4.1x of Book value. Although valuations are on the
higher side, looking at the strong and sustainable growth and ROE prospects of
the company, we recommend a Subscribe to the issue.
Exhibit 10: Relative comparison
Adv Growth
EPS Growth
Company
GNPA
NPA
ROE
ROA
P/B
PE
FY13-17
FY13-17
MAS
37.0
26.0
1.1
0.9
26.9
3.3
6.9
33.2
Capital First
27.0
40.0
1.7
1.0
11.9
1.6
3.1
22.9
Shriram City Union Finance
10.0
1.0
6.7
1.8
11.7
2.6
2.7
24.4
Source: Company, Angel Research, Valuation are based on FY17 numbers
Key risk
Risky Borrower
MAS’ operations involve transactions with relatively high risk borrowers. Any
default from the customers could adversely affect the business, results of
operations and financial condition.
Unsecured Portfolio
As of June 30, 2017, the unsecured loan portfolio was `5,10cr (22% of AUM) out
of On-book AUM of `2,276.2cr. These unsecured loans present a higher risk of
loss in case of a credit default as compared to loans to customers in other asset-
backed financing products.
Oct 05, 2017
7
MAS Financials Services Ltd | IPO Note
Income Statement
Y/E March (` cr)
FY13
FY14
FY15
FY16
FY17
NII
71
90
105
136
172
- YoY Growth (%)
27
16
30
27
Other Income
16
16
22
26
28
- YoY Growth (%)
1
34
20
8
Operating Income
87
106
126
162
200
- YoY Growth (%)
22
19
28
24
Operating Expenses
38
42
45
60
67
- YoY Growth (%)
10
8
32
12
Pre - Provision Profit
49
64
81
102
133
- YoY Growth (%)
31
26
26
31
Prov. & Cont.
8
15
19
24
27
- YoY Growth (%)
72
34
21
15
Profit Before Tax
41
50
62
79
106
- YoY Growth (%)
23
24
27
35
Exceptional Item
-
-
-
-
-
PBT Post Exceptional Item
41
50
62
79
106
Prov. for Taxation
13
17
21
27
37
- as a % of PBT
32
33
34
34
35
Reported PAT
27
33
41
51
69
Adj PAT
27
33
40
51
69
- YoY Growth (%)
19
23
27
35
Balance sheet
Y/E March (` cr)
FY13
FY14
FY15
FY16
FY17
Share Capital
53
59
59
59
90
Reserve & Surplus
53
68
101
124
242
Net Worth
106
128
160
183
332
Borrowings
514
723
1,031
1,308
1,264
- Growth (%)
41
43
27
(3)
Total Provisions
5
8
9
11
17
Other Liabilities
177
275
372
444
588
Total Liabilities
802
1,133
1,572
1,946
2,201
Cash and Cash equivalents
175
185
218
182
47
Investments
0
0
0
0
0
Total Loans & Advances
601
923
1,322
1,725
2,109
- Growth (%)
53
43
30
22
Fixed Assets
6
6
5
8
9
Other Assets
19
19
27
31
36
Total Assets
802
1,133
1,572
1,946
2,201
Oct 05, 2017
8
MAS Financials Services Ltd | IPO Note
Key Ratio
FY13
FY14
FY15
FY16
FY17
Profitability ratios (%)
NIMs
11.8
11.8
9.3
8.9
9.0
ROA
3.4
3.4
3.0
2.9
3.3
ROE
25.9
28.3
28.3
30.0
26.9
Cost to Income
43.7
39.4
35.8
36.9
33.5
Asset Quality (%)
Gross NPAs (cr)
104.8
151.2
208.1
279.1
352.7
Gross NPAs (AUM)
1.00
1.04
0.99
1.03
1.06
Net NPAs (cr)
89.3
122.2
170.9
239.3
305.5
Net NPAs (AUM)
0.85
0.85
0.81
0.89
0.92
Credit Cost
0.81
1.16
1.10
0.98
0.90
CAR
23.8
19.7
18.1
18.3
23.0
Tier1
16.1
14.0
12.3
11.0
16.9
Tier - 2
7.7
5.7
5.8
7.3
6.1
Per Share Data (`)
EPS
5.5
6.6
8.1
10.3
13.8
BVPS
21.4
25.8
32.3
36.9
67.0
DPS
0.5
0.8
1.3
4.3
3.2
Valuation Ratios
PER (x)
83.3
69.8
56.9
44.8
33.2
P/BVPS (x)
21.5
17.8
14.2
12.4
6.9
DuPont Analysis
NII
8.9
9.3
7.7
7.7
8.3
(-) Prov
1.1
1.5
1.4
1.3
1.3
Adj NII
7.8
7.8
6.3
6.4
7.0
Other Inc.
2.0
1.7
1.6
1.5
1.4
Total Income
9.8
9.5
7.9
7.9
8.4
Opex
4.7
4.3
3.3
3.4
3.2
PBT
5.1
5.1
4.6
4.5
5.1
Taxes
1.6
1.7
1.5
1.5
1.8
ROA
3.4
3.4
3.0
2.9
3.3
Leverage
7.6
8.3
9.4
10.3
8.1
ROE
25.9
28.3
28.3
30.0
26.9
Note- Valuation ratios based on pre-issue outstanding shares and at upper end of the price band
Oct 05, 2017
9
MAS Financials Services Ltd | IPO Note
Research Team Tel: 022 - 39357800
DISCLAIMER
Angel Broking Private Limited (hereinafter referred to as “Angel”) is a registered Member of National Stock Exchange of India Limited,
Bombay Stock Exchange Limited and Metropolitan Stock Exchange Limited. It is also registered as a Depository Participant with CDSL
and Portfolio Manager and investment advisor with SEBI. It also has registration with AMFI as a Mutual Fund Distributor. Angel Broking
Private Limited is a registered entity with SEBI for Research Analyst in terms of SEBI (Research Analyst) Regulations, 2014 vide
registration number INH000000164. Angel or its associates has not been debarred/ suspended by SEBI or any other regulatory
authority for accessing /dealing in securities Market. Angel or its associates/analyst has not received any compensation / managed or
co-managed public offering of securities of the company covered by Analyst during the past twelve months.
This document is solely for the personal information of the recipient, and must not be singularly used as the basis of any investment
decision. Nothing in this document should be construed as investment or financial advice. Each recipient of this document should
make such investigations as they deem necessary to arrive at an independent evaluation of an investment in the securities of the
companies referred to in this document (including the merits and risks involved), and should consult their own advisors to determine
the merits and risks of such an investment.
Reports based on technical and derivative analysis center on studying charts of a stock's price movement, outstanding positions and
trading volume, as opposed to focusing on a company's fundamentals and, as such, may not match with a report on a company's
fundamentals. Investors are advised to refer the Fundamental and Technical Research Reports available on our website to evaluate the
contrary view, if any.
The information in this document has been printed on the basis of publicly available information, internal data and other reliable
sources believed to be true, but we do not represent that it is accurate or complete and it should not be relied on as such, as this
document is for general guidance only. Angel Broking Pvt. Limited or any of its affiliates/ group companies shall not be in any way
responsible for any loss or damage that may arise to any person from any inadvertent error in the information contained in this report.
Angel Broking Pvt. Limited has not independently verified all the information contained within this document. Accordingly, we cannot
testify, nor make any representation or warranty, express or implied, to the accuracy, contents or data contained within this document.
While Angel Broking Pvt. Limited endeavors to update on a reasonable basis the information discussed in this material, there may be
regulatory, compliance, or other reasons that prevent us from doing so.
This document is being supplied to you solely for your information, and its contents, information or data may not be reproduced,
redistributed or passed on, directly or indirectly.
Neither Angel Broking Pvt. Limited, nor its directors, employees or affiliates shall be liable for any loss or damage that may arise from
or in connection with the use of this information.
Oct 05, 2017
10