IPO Note | Pharmaceuticals
December 3, 2016
Laurus Labs Limited
NEUTRAL
sue Open: December 06, 2016
Is
IPO Note - Valuations expensive; Neutral
Issue Close: December 08, 2016
Laurus Labs is a Hyderabad based company engaged in manufacturing of Active
Pharma Ingredients (API). Company derives 80% of its revenues from exports
Issue Details
while rest comes from the domestic markets. Its client base features companies
Face Value: `10
like Cipla, Natco, Mylan, etc. API is its largest segment which contributes 92% of
Present Eq. Paid up Capital: `98.7cr
the revenues while rest 8% comes from its Synthesis and Ingredients business.
(September 2016)
Investment rationale - 1) Company operates its API business model with a niche
Offer for Sale: 2.41cr Shares
focus on select therapeutic segments. This makes it a specialist API manufacturer
Fresh issue: *70.4 lakh -**70.1 lakh
shares
in a few therapeutic segments. 2) Laurus intends to enter in the US market with its
own products in FY2019E which is a right strategy considering most domestic
Post Eq. Paid up Capital: `105.8cr
pharma companies currently derive significant revenues from the US market. 3)
Issue size (amount): *`1,327cr -**1,332
Promoters strong entrepreneurial capability which is reflected in Laurus’ top line
cr (Up to `12.5cr of this offer is
reserved for employees)
CAGR of ~40% since inception 4) Company spends ~4-5% of sales on R&D
Price Band: `426-428
which may see a healthy product pipeline in future.
Lot Size: 35 shares and in multiple
Investment concerns - 1) Large portion (62%) of its business comes from supply of
thereafter
Anti Retroviral (ARV) APIs to pharma companies. These pharma companies
Post-issue implied mkt. cap:
receive contracts through competitive tenders every 3 years from govt. agencies
*`4,506.6cr - **`4,526.4cr
and one of its customers (Aspen) has indicted of lower prices of ARV tenders. We
Promoters holding Pre-Issue: 32.8%
believe that ARV is a volume based competitive business with no significant
Promoters holding Post-Issue: 30.6%
pricing power 2) Company has high client concentration risk with a top 10 and
top 3 clients contributing 80% and 40% of revenues respectively. 3) Laurus
*Calculated on lower price band
operates a low margin business with high working capital requirement and low
** Calculated on upper price band
asset turnover ratio which has impacted its return ratios. 4) Its current capacity
Book Building
utilization is at ~70% and company is undertaking capex to add new API facility
in CY2017 which may weaken its return ratios going ahead.
QIBs
50% of issue
Valuations and outlook: On FY2016’s PAT of `133.3cr, the issue, at its upper
Non-Institutional
15% of issue
band, is priced at P/E of 32x which looks expensive. Accounting for FY2017E PAT,
Retail
35% of issue
the valuation still looks high at P/E of 28x. We believe that this kind of valuation is
commanded by domestic pharma companies who have branded formulations
business, healthy product pipeline and strong return ratios. Considering Laurus’
Post Issue Shareholding Patter
1) high client concentration, 2) low pricing power 3) asset heavy model and 4)
Promoters Group
30.6
high valuation, we rate this IPO as Neutral.
DIIs/FIIs/Public & Others
69.4
Key Financials
Y/E March (` cr)
FY2014
FY2015
FY2016
1HFY17
Net Sales
1,160
1,327
1,784
930
% chg
14.4
34.5
-
Net Profit
97
68
133
77
% chg
(29.9)
95.3
-
OPM (%)
18.0
15.1
20.9
21.2
EPS (`)
9.8
6.9
13.4
7.6
P/E (x)
43.5
61.8
31.9
-
P/BV (x)
11.8
5.9
5.0
-
RoE (%)
27.1
9.4
15.6
-
RoCE (%)
20.5
9.5
15.6
-
Shrikant Akolkar
EV/Sales (x)
4.1
3.7
2.9
-
+91 22 39357800 Ext: 6846
EV/EBITDA (x)
22.5
24.5
13.8
-
Source: Company, Angel Research
Please refer to important disclosures at the end of this report
1
Laurus labs | IPO Note
Company background
Laurus Labs is an Active pharma ingredient (API) oriented leading research and
development driven pharmaceutical company in India. Company sells its products
in 32 countries and has 5 manufacturing capacities. Its clients are well known
names from the pharma industry such as Aspen Pharmacare, Aurobindo Pharma,
Cipla, Mylan, NATCO Pharma, Strides Shasun, etc. Top 10 / top 3 clients
contribute 80% / 30% of total revenues. Company has four business segments
namely Generics - APIs, Generics - FDFs (finished dosage forms), Synthesis and
Ingredients. API business contributes 92% of total revenues while company is yet to
record revenues in its FDF business. Synthesis business contributes 5% of total
revenues and rest 3% come from Ingredients Business. In its API business,
company has focus on Anti-retro Viral APIs (ARV), Oncology APIs (anti-cancer) and
Hepatitis-C APIs.
Company intends to move in formulations business and has made significant
investments in new facilities for the same. It has filed 2 ANDAs and expects to
generate revenues in the next two years (FY-2019E). Company currently operates
kilo lab (capacity of 4.6KL) and three manufacturing facilities (aggregate capacity
of 1,833.6 KL) in Visakhapatnam. Of these, 2 facilities manufacture APIs and
ingredients and third facility manufactures APIs and FDFs. Company through
acquisition of Sriam Labs, operates two other manufacturing facilities in Bibinagar
and Visakhapatnam for the manufacturing of APIs and intermediates. Company is
process of setting up two additional manufacturing facilities in Visakhapatnam of
which one will operational in December 2016 while construction will begin at the
other facility in CY2017.
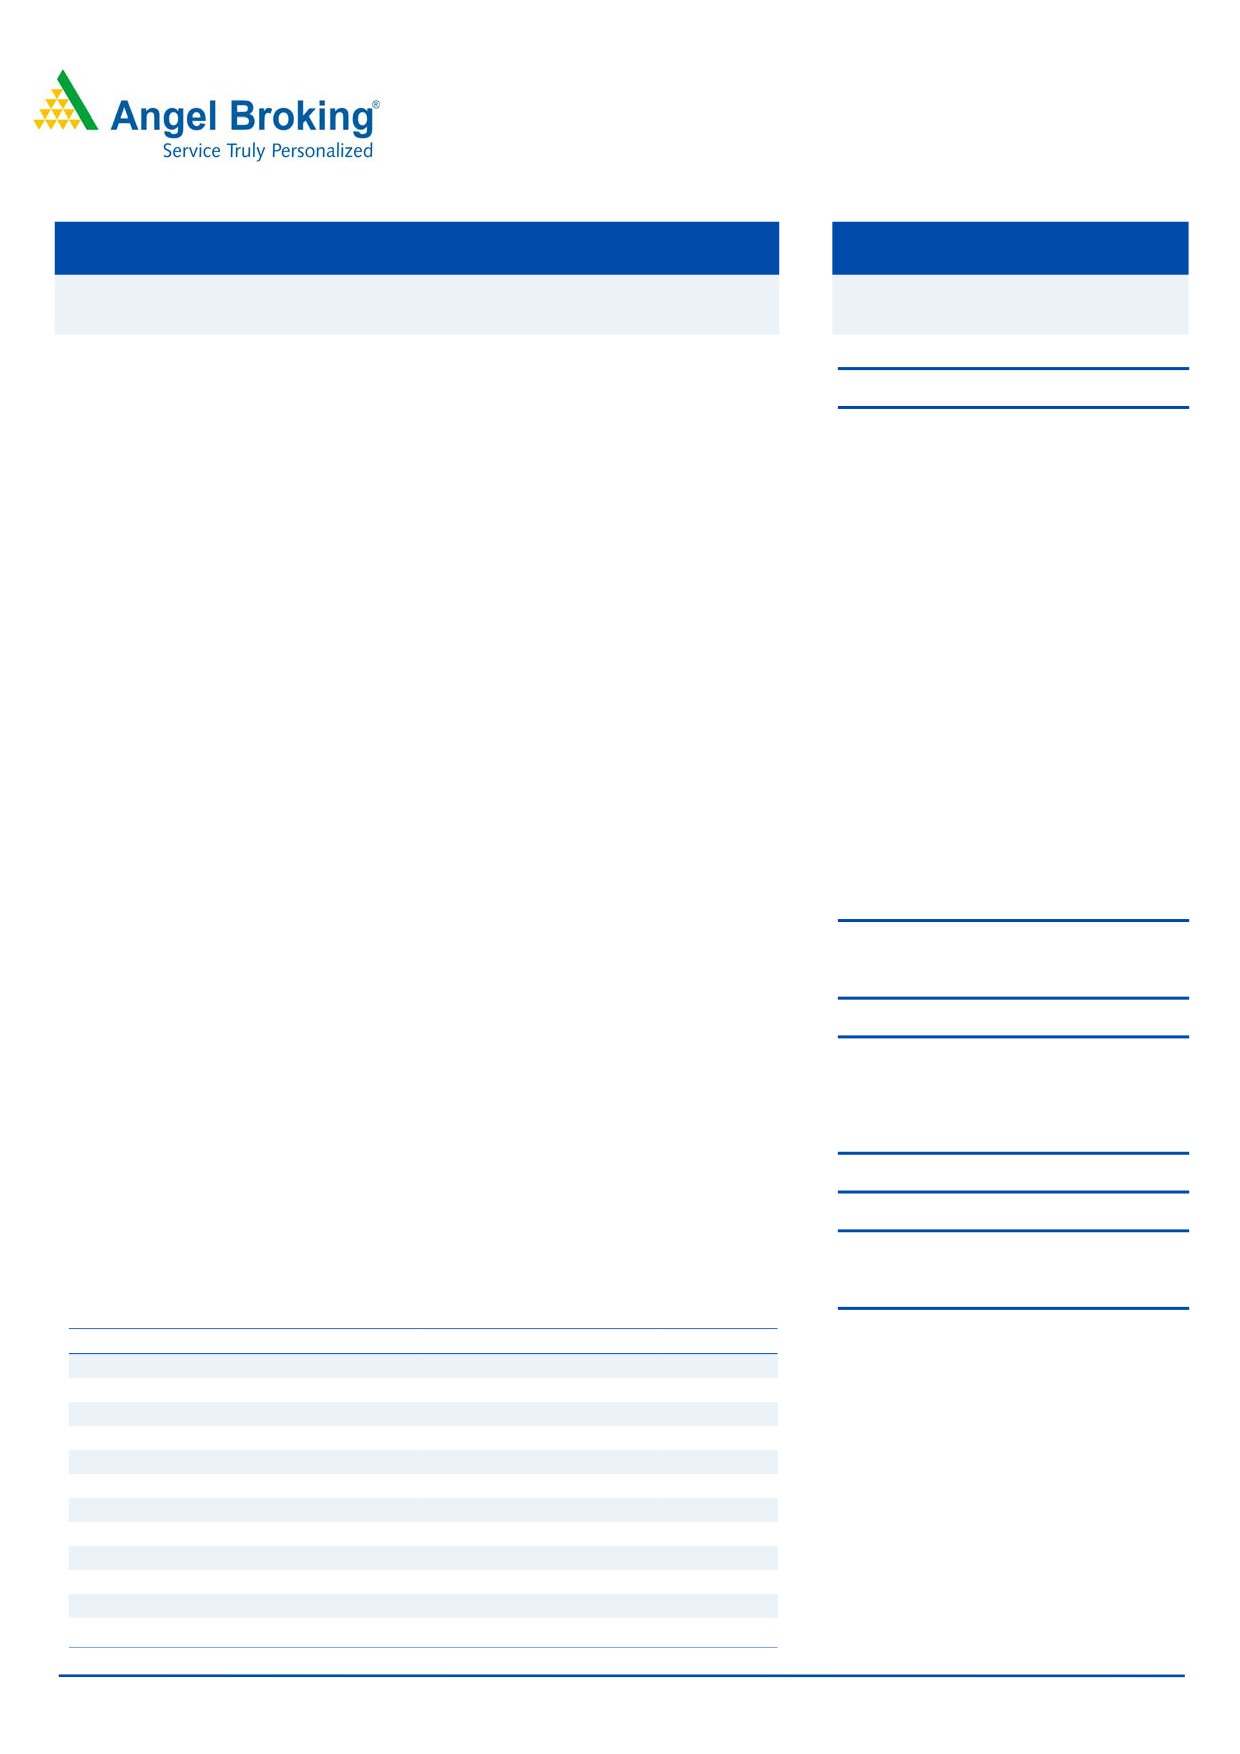
Exhibit 1: Revenue mix (%)
Exhibit 2: API mix (%)
3.0%
5%
7.5%
7.4%
67.8%
17.3%
92%
API
Synthesis business
Ingredients Business
ARV
Hepatitis C
Oncology
Other therapeutic areas
Source: Company, Angel Research
Source: Company, Angel Research
December 3, 2016
2
Laurus labs | IPO Note
Issue details
Through this IPO, some existing shareholders (Aptuit, Bluewater, FIL Capital
Management and Fidelity India Principals) are selling their stake in the company.
Aptuit is selling its entire shareholding while other shareholders are selling their
partial stake.
Company is also raising `300cr by selling fresh shares which will be used to repay
its debt and for general corporate purpose.
Exhibit 3: Pre and Post-IPO shareholding of selling shareholders
Selling shareholders
Pre-issue shares held
Percentage of pre-issue capital
Post issue
Percentage of post- issue capital
Aptuit
9,040,240
9.15%
0
0.00%
Bluewater
29,989,596
30.37%
20,989,596
19.85%
FIL Capital Management
18,265,612
18.50%
12,237,612
11.57%
Fidelity India Principals
118,752
0.12%
79,552
0.08%
Total
57,414,200
58.14%
33,306,760
31.49%
Source: Company, Angel Research
Objects of the offer
Achieve the benefits of listing of the equity shares on the stock exchanges
Pre-payment of term loans
General corporate purposes
December 3, 2016
3
Laurus labs | IPO Note
Investment Rationale
Operating in niche API segments: Laurus labs operates in a niche API segment with
focus on Anti Retroviral (ARV), Hepatitis C and Oncology therapeutics segment. API
segment contributes 92% of its total revenues. Within API segment, ARV is the
largest segment which contributes 68% of the total API segment’s revenues while
rest of the segment revenues come from Hepatitis C and Oncology APIs.
ARV segment has shown a 2 year CAGR of 16% from FY2014-FY2016. This is
mainly due to the increased Anti Retroviral therapies in the African region and
increase in number of patients undergoing treatment. At the end of 2015, ~17
million people were receiving Anti Retroviral therapy of the total 36.7 million
people living with HIV globally, representing approximately 46% of the total HIV
population. Company believes that there are near term opportunities for the US
and European markets.
The company also makes APIs for Hepatitis C which has exhibited strong growth
rates. The prevalence of Hepatitis C is mostly seen in the South Asia and North
Africa which makes nearly
80% of global Hepatitis C burden. Laurus has
arrangement to manufacture and sell Hepatitis C APIs with NATCO, who
commands a 38.5% share of the Indian Hepatitis C market. Company also has
agreement with Gilead Sciences and Bristol-Myers for Hepatitis C API supply in the
international markets.
In the Oncology API, its portfolio consists of 15 active DMFs and supplies
Oncology APIs to global generic multinational pharmaceutical companies.
Globally, Oncology is one of the largest therapeutic segments and is expected to
grow ~7% to 8% between 2015 and 2020E to reach a value of US$152 billion.
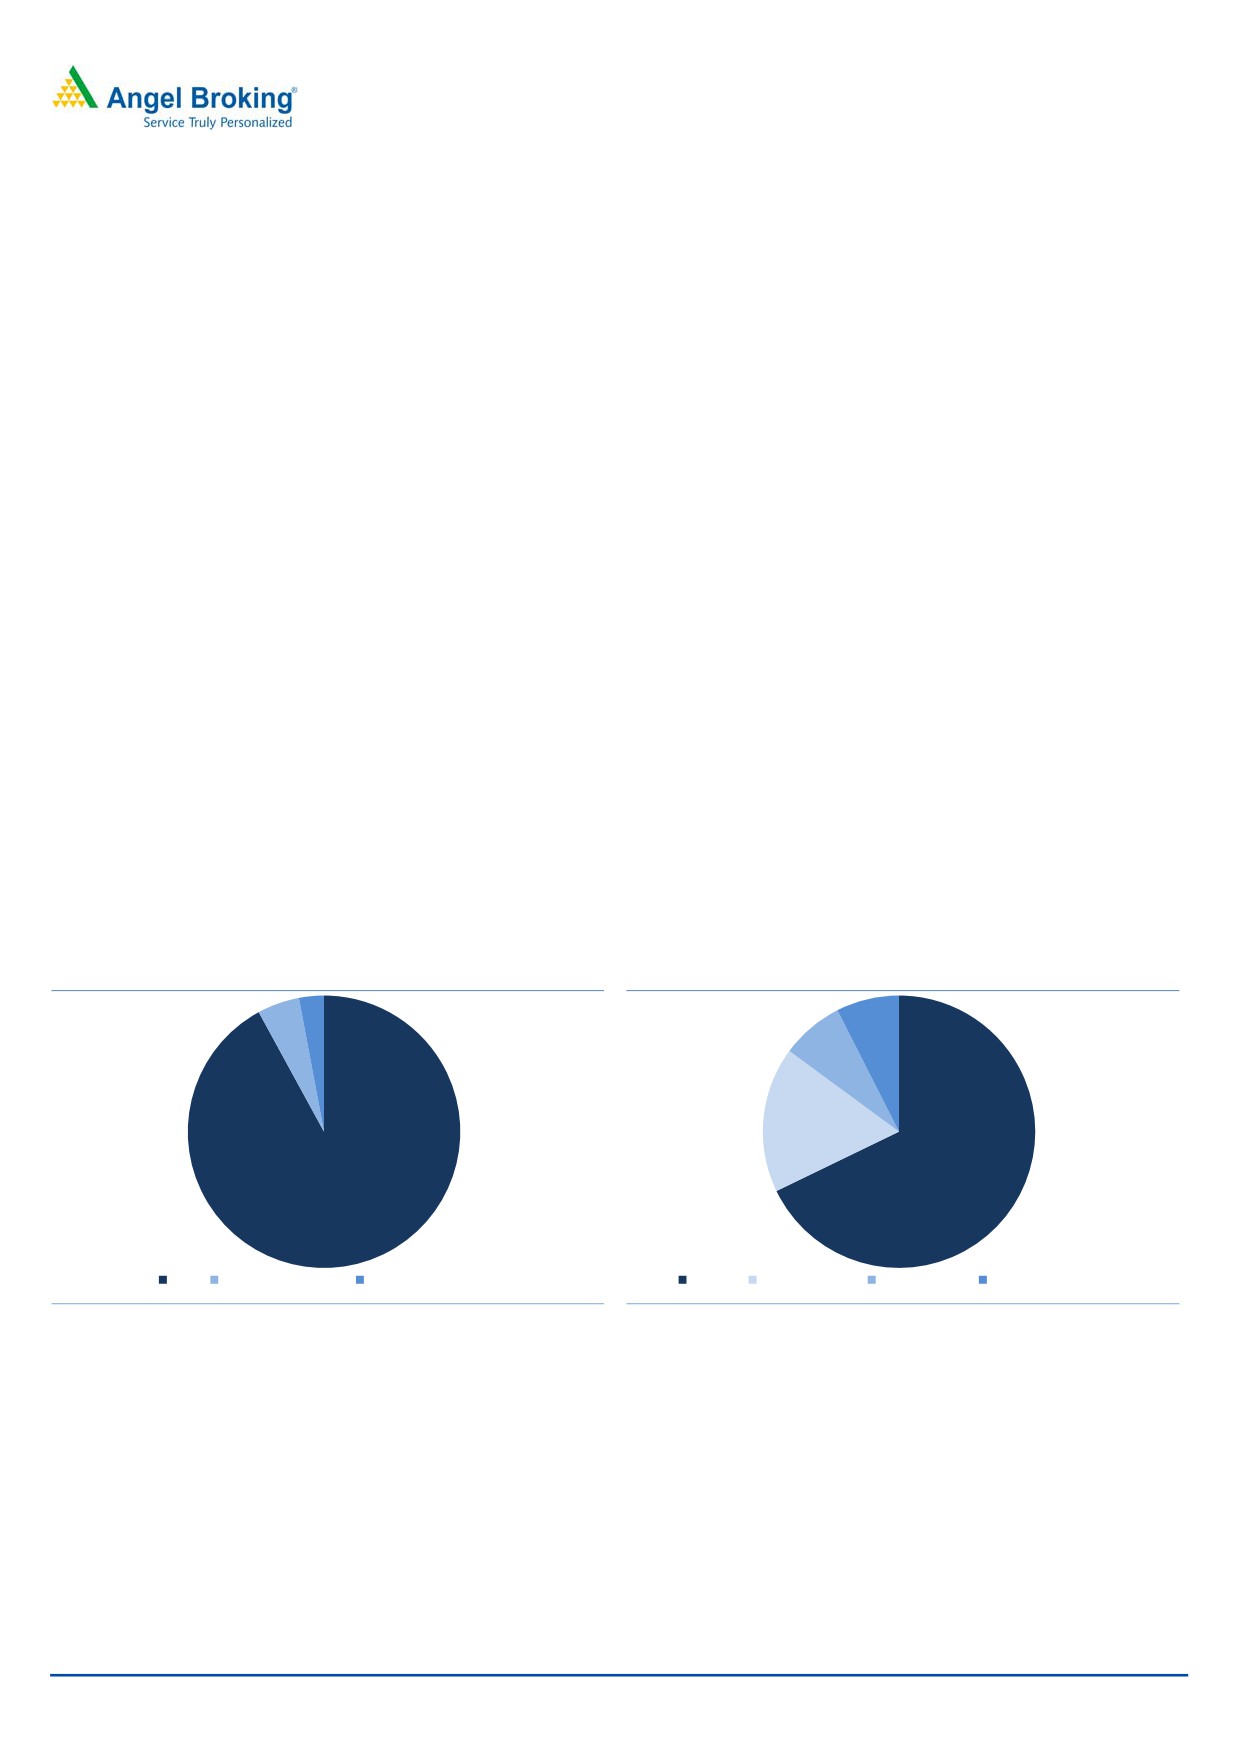
Exhibit 4: API business mix has changed over the years
120.0
100.0
14.7
14.0
23.6
32.2
80.0
60.0
85.3
86.0
40.0
76.4
67.8
20.0
0.0
FY2014
FY2015
FY2016
1HFY17E
ARV Therapeutic Area
Others Therapeutic Areas
Source: Company, Angel Research
December 3, 2016
4
Laurus labs | IPO Note
Possible formulations foray, but too early to price in: Company intends to move in
the formulations business and has started to research on possible ANDAs that it
may file and launch in future. As of now, company has 2 ANDAs filed and it
expects to receive USFDA approval in FY2018E and a possible launch in FY2019E.
However, this in our opinion is too early to price in. We also believe that lot of
Indian companies are already present in the USA with their own front ends and
huge operational scale. We believe most pharma companies which entered in the
US market have now moved towards complex products as low value ANDAs have
seen huge competition and steep price erosion.
The company’s one of the plant has recently undergone an USFDA audit and has
received minor process related observation. While management believes that this
can be resolved in few weeks, an escalation of the same may be negative for its
US plans in near term.
High working capital requirement: Laurus has seen rise in its working capital cycle
in last two years and the same has affected its return ratios. In FY2014 company’s
working capital cycle was ~110 days which increased to ~177 days in FY2016.
Most of this has come due to the rise in the inventories. Company has said that the
cycle is expected to remain at ~180 days going ahead. In our opinion, this is at an
elevated level and may impact its future return ratios.
Recent financial performance: In the first half of the current fiscal, Laurus reported
healthy set of numbers. In H1FY2017, Laurus reported `939.6cr in revenues vs.
`1,783.8cr in FY2016. The raw material costs as percent of sales stood at 53.3%
in H1FY2017 compared to 56.5% in FY2016 indicating decline in the input costs.
EBITDA came in at `196.7cr and EBITDA margins were at 21.2% vs. 20.9% in
FY2016. Its PAT stood at `75.1cr vs. `132.6cr in FY2016 indicating company
reported strong profitability in the first half the current fiscal.
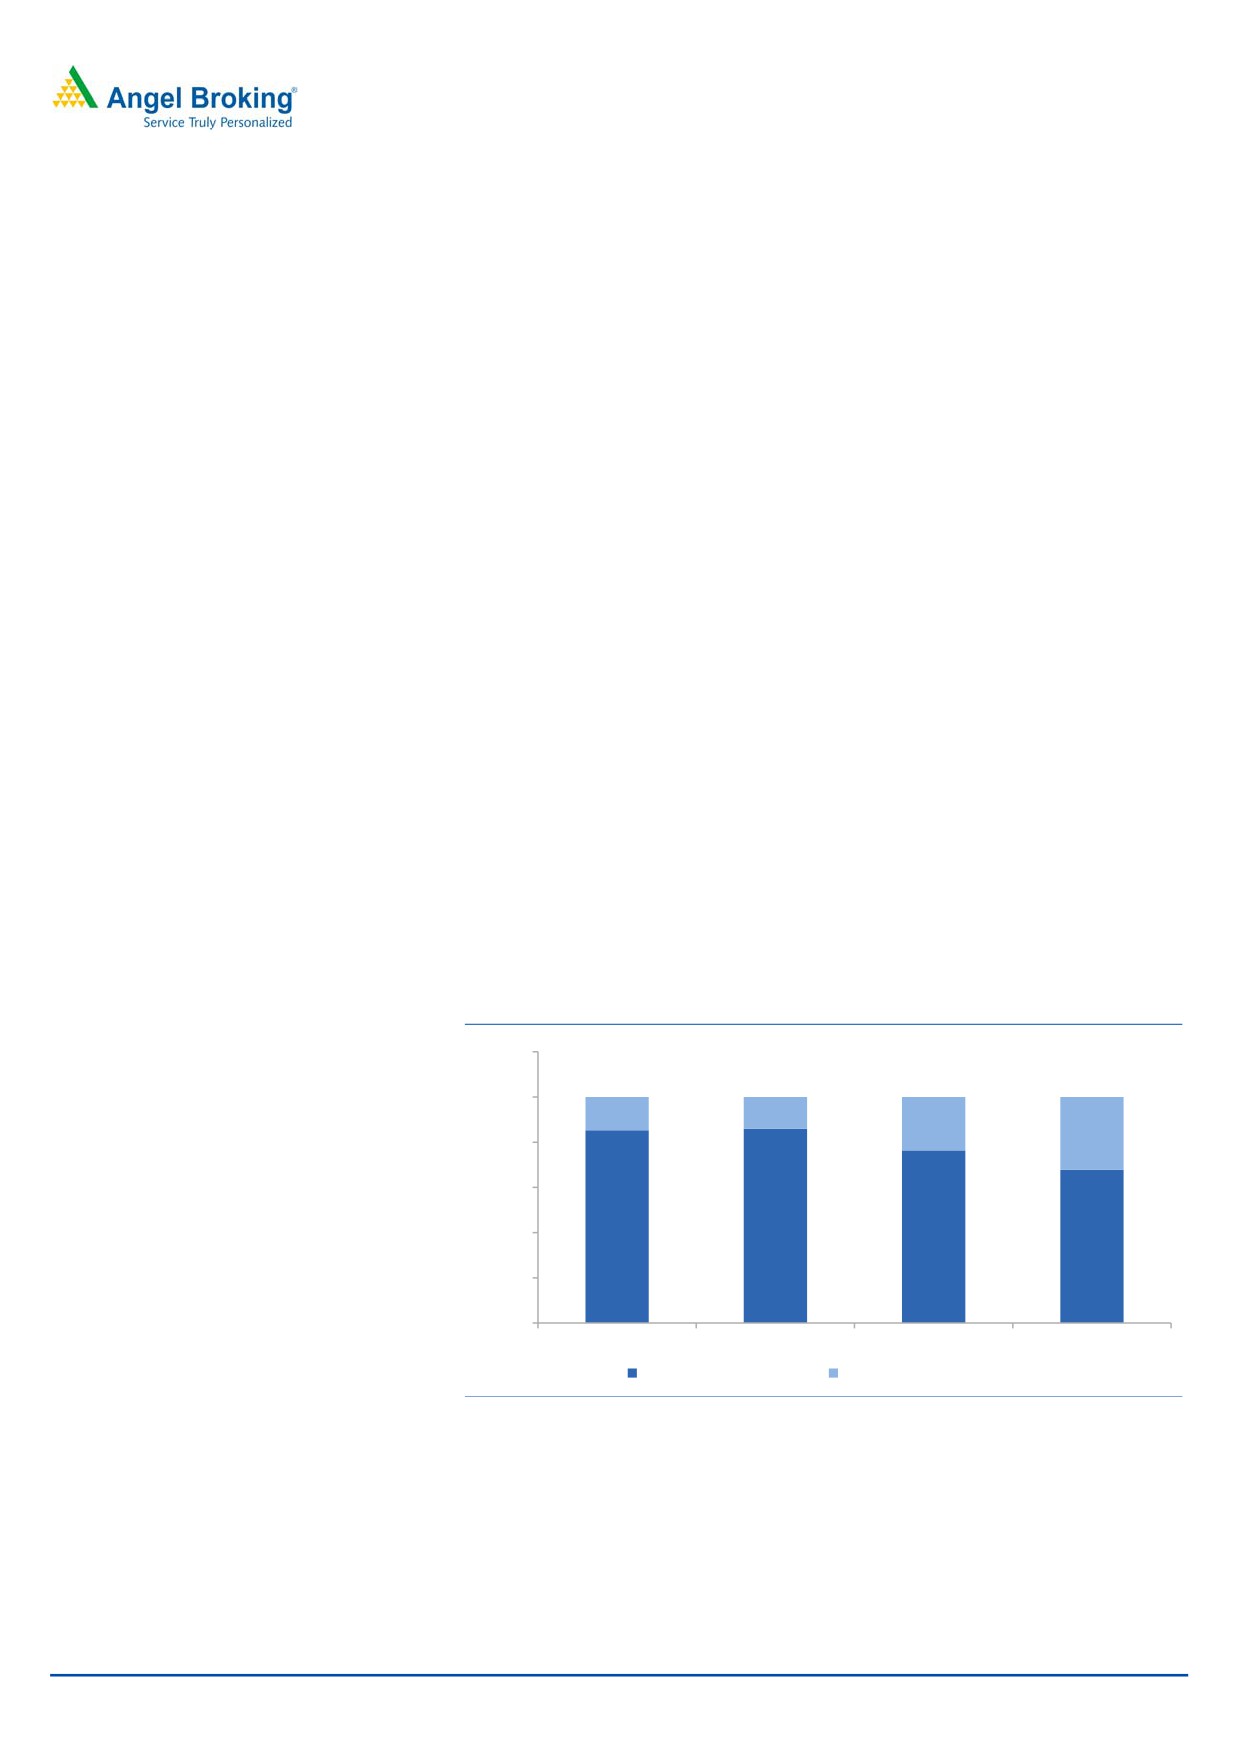
Overall, company has seen improvement in the profitability in the last three years
with EBITDA margins moving from 18.0% in FY2014 to 21.2% in H1FY2017.
Company indicates that ~20.0% EBITDA margin level is sustainable going ahead.
Its return on equity stood at 27.1% in FY2014 but decline in FY2015 to 9.4% but
has recovered to ~16% in H1FY2017.
Exhibit 5: EBITDA margins and RoE ratios since FY2014
30.0
25.0
20.0
15.0
10.0
5.0
0.0
FY2014
FY2015
FY2016
1HFY17E
EBITDA margins
RoE
Source: Company, Angel Research
December 3, 2016
5
Laurus labs | IPO Note
Outlook and Valuation:
On FY2016’s PAT of `133.3cr, the issue, at its upper band, is priced at P/E of 32x
which looks expensive. Accounting for FY2017E PAT, the valuation still looks high
at P/E of 28x. We believe that this kind of valuation is commanded by domestic
pharma companies who have branded formulations business, healthy product
pipeline and strong return ratios. Considering Laurus’ 1) high client concentration,
2) low pricing power 3) asset heavy model and 4) high valuation, we rate this IPO
as Neutral.
Upside risks
Early approval and launch of ANDAs: The increased momentum in the ANDA
filing may be positive for the company as the company will be able to start its
formulations business earlier than expected.
Improvement in working capital: If Laurus sees improvement in its working capital,
return ratios will also improve accordingly. This will be positive for the company.
December 3, 2016
6
Laurus labs | IPO Note
Income Statement
Y/E March (` cr)
FY2014
FY2015
FY2016
1HFY17
Total operating income
1,160
1,327
1,784
930
% chg
14.4
34.5
Total Expenditure
951
1,126
1,412
733
Cost of Materials
726
828
1,008
495
Personnel
104
133
190
118
Others Expenses
121
165
214
120
EBITDA
209
200
372
197
% chg
(4.2)
85.9
(47.2)
(% of Net Sales)
18.0
15.1
20.9
21.2
Depreciation& Amortisation
33
62
92
54
EBIT
176
139
280
143
% chg
(21.2)
101.9
(% of Net Sales)
15.2
10.5
15.7
15.4
Interest & other Charges
64
106
120
53
Other Income
9
34
8
12
(% of PBT)
7.3
51.2
4.5
11.9
Share in profit of Associates
-
-
-
-
Recurring PBT
121
67
168
102
% chg
(44.9)
151.7
Prior Period & Extraord Exp./(Inc.)
-
-
-
-
PBT (reported)
121
67
168
102
Tax
24
(2)
35
26
(% of PBT)
19.6
(2.3)
20.6
25.2
PAT (reported)
97
68
133
76.6
Add: Share of earnings of associate
-
0
(0)
(1.5)
Less: Minority interest (MI)
-
-
-
-
PAT after MI (reported)
97
68
133
75
ADJ. PAT
97
68
133
75
% chg
(29.7)
94.0
(% of Net Sales)
8.4
5.2
7.4
8.1
Basic EPS (`)
9.8
6.9
13.4
7.6
Fully Diluted EPS (`)
9.8
6.9
13.4
7.6
% chg
(29.7)
94.0
December 3, 2016
7
Laurus labs | IPO Note
Balance Sheet
Y/E March (` cr)
FY2014
FY2015
FY2016
1HFY17
SOURCES OF FUNDS
Equity Share Capital
78
82
82
99
Reserves& Surplus
281
640
769
830
Shareholders’ Funds
358
722
852
929
Minority Interest
-
-
-
-
Total Loans
500
735
942
859
Deferred Tax Liability
12
10
45
60
Total Liabilities
871
1,468
1,839
1,847
APPLICATION OF FUNDS
Net Block
494
795
1,079
1,052
Intangible assets
5
6
6
7
Capital Work-in-Progress
116
110
70
216
Goodwill on consolidation
0
-
-
-
Long-term loans and adv.
69
94
129
152
Investments
-
7
7
6
Other non-current assets
15
14
9
14
Current Assets
575
862
1,003
1,134
Inventories
328
475
487
521
Sundry Debtors
195
285
445
533
Cash
23
59
28
14
Loans & Advances
25
31
30
39
Other Assets
4
12
13
26
Current liabilities
403
421
464
733
Net Current Assets
172
442
539
401
Deferred Tax Asset
-
-
-
-
Mis. Exp. not written off
-
-
-
-
Total Assets
871
1,468
1,839
1,847
December 3, 2016
8
Laurus labs | IPO Note
Cash Flow Statement
Y/E March (` cr)
FY14
FY15
FY16
1H1FY17
Profit before tax
121
67
168
102
Depreciation
33
62
92
54
Change in Working Capital
(59)
(251)
(148)
(71)
Interest / Dividend (Net)
48
84
101
47
Direct taxes paid
(23)
(17)
(33)
(13)
Others
2
(9)
13
(1)
Cash Flow from Operations
121
(65)
193
119
(Inc.)/ Dec. in Fixed Assets
(309)
(383)
(337)
(177)
(Inc.)/ Dec. in Investments
(3)
(14)
12
1
Cash Flow from Investing
(312)
(397)
(325)
(176)
Issue of Equity
-
-
-
-
Inc./(Dec.) in loans
250
274
205
97
Finance costs
(51)
(84)
(103)
(47)
Others
12
315
18
8
Cash Flow from Financing
211
505
120
58
Inc./(Dec.) in Cash
21
44
(12)
1
Opening Cash balances
3
15
40
13
Closing Cash balances
23
59
28
14
December 3, 2016
9
Laurus labs | IPO Note
Key Ratios
Y/E March
FY2014
FY2015
FY2016
Valuation Ratio (x)
P/E (on FDEPS)
43.5
61.8
31.9
P/CEPS
32.5
32.6
18.8
P/BV
11.8
5.9
5.0
Dividend yield (%)
0.0
0.0
0.0
EV/Sales
4.1
3.7
2.9
EV/EBITDA
22.5
24.5
13.8
EV / Total Assets
3.69
2.59
2.23
Per Share Data (`)
EPS (Basic)
9.8
6.9
13.4
EPS (fully diluted)
9.8
6.9
13.4
Cash EPS
13.2
13.1
22.8
DPS
0.0
0.0
0.0
Book Value
36.3
73.1
86.3
Returns (%)
ROCE
20.5
9.5
15.6
Angel ROIC (Pre-tax)
21.1
10.0
15.9
ROE
27.1
9.5
15.6
Turnover ratios (x)
Asset Turnover (Net Block)
2.3
1.7
1.7
Inventory / Sales (days)
165
210
176
Receivables (days)
61
78
91
Payables (days)
114
102
90
WC cycle (ex-cash) (days)
112
186
177
December 3, 2016
10
Laurus labs | IPO Note
Research Team Tel: 022 - 39357800
DISCLAIMER
Angel Broking Private Limited (hereinafter referred to as “Angel”) is a registered Member of National Stock Exchange of India Limited,
Bombay Stock Exchange Limited and Metropolitan Stock Exchange Limited. It is also registered as a Depository Participant with CDSL
and Portfolio Manager with SEBI. It also has registration with AMFI as a Mutual Fund Distributor. Angel Broking Private Limited is a
registered entity with SEBI for Research Analyst in terms of SEBI (Research Analyst) Regulations, 2014 vide registration number
INH000000164. Angel or its associates has not been debarred/ suspended by SEBI or any other regulatory authority for accessing
/dealing in securities Market. Angel or its associates/analyst has not received any compensation / managed or co-managed public
offering of securities of the company covered by Analyst during the past twelve months.
This document is solely for the personal information of the recipient, and must not be singularly used as the basis of any investment
decision. Nothing in this document should be construed as investment or financial advice. Each recipient of this document should
make such investigations as they deem necessary to arrive at an independent evaluation of an investment in the securities of the
companies referred to in this document (including the merits and risks involved), and should consult their own advisors to determine
the merits and risks of such an investment.
Reports based on technical and derivative analysis center on studying charts of a stock's price movement, outstanding positions and
trading volume, as opposed to focusing on a company's fundamentals and, as such, may not match with a report on a company's
fundamentals. Investors are advised to refer the Fundamental and Technical Research Reports available on our website to evaluate the
contrary view, if any.
The information in this document has been printed on the basis of publicly available information, internal data and other reliable
sources believed to be true, but we do not represent that it is accurate or complete and it should not be relied on as such, as this
document is for general guidance only. Angel Broking Pvt. Limited or any of its affiliates/ group companies shall not be in any way
responsible for any loss or damage that may arise to any person from any inadvertent error in the information contained in this report.
Angel Broking Pvt. Limited has not independently verified all the information contained within this document. Accordingly, we cannot
testify, nor make any representation or warranty, express or implied, to the accuracy, contents or data contained within this document.
While Angel Broking Pvt. Limited endeavors to update on a reasonable basis the information discussed in this material, there may be
regulatory, compliance, or other reasons that prevent us from doing so.
This document is being supplied to you solely for your information, and its contents, information or data may not be reproduced,
redistributed or passed on, directly or indirectly.
Neither Angel Broking Pvt. Limited, nor its directors, employees or affiliates shall be liable for any loss or damage that may arise from
or in connection with the use of this information.
December 3, 2016
11