IPO note | IT Consulting & Software
September 9, 2016
L&T Technology Services Limited
SUBSCRIBE
Issue Open: September 12, 2016
Issue competitively priced - Subscribe
Issue Close: September 15, 2016
IPO note
Company background: L&T Technology Services Limited (LTTS) is subsidiary of
Issue Details
Engineering giant, L&T and was incorporated in Jun-2012. Post transfer of
Product Engineering Services (PES) and Integrated Engineering Services (IES)
Face Value: `2
division and 2 acquisitions in 2014-15, LTTS emerged as leading pure play
Present Eq. Paid up Capital: `20.3cr
Engineering Research & Development (ER&D) player. Zinnov recognizes LTTS in
“leadership zone” in 8 Industry verticals (Industrial Automation, Construction and
Fresh Issue: 0.0cr Shares
Heavy Machinery, Medical Devices, Aerospace, Automotive, Rail and Marine,
Offer for Sale: 1.04cr Shares
Telecom, Energy and Utilities) & 2 horizontal offerings (Embedded Systems and
Mechanical). LTTS has 12 Global Delivery Centres (GDCs), 27 sales offices
Post Eq. Paid up Capital: `20.3cr
globally and 31 Labs in India. As of Jun-2016, LTTS has 9,419 Engineers from
Issue size (amount): `884-894.4cr
9 nationalities serving 200+ customers, including >50 of Fortune 500 customers.
Positives: (1) LTTS, a leading global pure-play ER&D company is likely to benefit
Price Band: `850-860
from (a) under-penetration, (b) expected increase in India’s market share in
Lot Size: 16 shares and in multiple there-of
outsourced ER&D space, and (c) strong 13% industry CAGR during FY2015-20E,
Post-issue implied mkt. cap:
(2) pursue multi-pronged growth strategy, which includes (a) Focus on key
`8,643.7cr- 8,745.4cr
Segments, Verticals and Geographies, (b) mine existing customers and add new
Promoters holding Pre-Issue: 100.0%
customers, (c) Focus on Solutions-oriented Engineering services, (d) continued
Promoters holding Post-Issue: 89.8%
investment towards innovation labs, (e) pursue selective acquisitions, (f) Attract
and retain employees, and (3) Operational levers (improvement in Utilization,
better onshore-offshore mix) to aid margin expansion, and (4) strong historical
financial performance.
Book Building
Risks & Concerns: (1) LTTS could lose business volumes if large clients set-up their
QIBs
50% of issue
own captive R&D centers, (2) LTTS is dependent to large extent on limited clients.
Non-Institutional
15% of issue
Loss of a major client could impact the revenues of LTTS.
Valuation: LTTS trades at 21.0x FY2016 EPS at upper-end of issue price band. On
Retail
35% of issue
considering (1) strong growth potential of LTTS, which is ahead of some of the
industry peers, coupled with (2) 38%+ RoE levels in FY2016, (3) FY2015-16
average cash flow from operations of `446cr, (4) strong ~64% dividend payout
Post Issue Shareholding Pattern
(translating to ~4% dividend yield), we are of view that LTTS stock has the
potential to trade at premium to the peers. However, if we consider the average
Promoters Group
89.8
of the 3 peers, then LTTS stock has been priced at 19% discount. Given that the
DIIs/FIIs/Public & Others
10.2
LTTS IPO has been priced at discount, we advise SUBSCRIBE.
Key Financial
Y/E March (` cr)
FY15
FY16
Net Sales
2,619
3,067
% chg
17.1
Net Profit
311
417
% chg
33.8
EBITDA (%)
15.2
17.0
EPS (`)
31
41
P/E (x)
28.1
21.0
P/BV (x)
8.3
8.0
RoE (%)
29.6
38.9
RoCE (%)
33.3
42.2
Yellapu Santosh
EV/Sales (x)
1.8
2.2
022 - 3935 7800 Ext: 6811
EV/EBITDA (x)
11.6
12.8
Source: Company, Angel Research; Note: Considered Upper price band of ` 860/share; For EPS
and other valuation purposes, we have considered 10.2cr shares o/s
Please refer to important disclosures at the end of this report
1
L&T Technology Services | IPO note
Issue Details
LTTS is offering 1.04cr equity shares of `2 each via book building route in price
band of `850-860/share, entirely comprising offer for sale by current promoters
L&T.
Exhibit 1: Shareholding Pattern
Pre-Issue
Post-Issue
Particulars
No. of Shares
(%)
No. of Shares
(%)
Promoter Group
101,690,392 100.0
91,290,392
89.8
Retail & HNI Investors
0
0.0
5,200,000
5.1
Institutional Investors
0
0.0
5,200,000
5.1
Source: Company, Angel Research
Objects of the Offer
Objects of the Offer are to achieve benefits of listing equity shares on stock
exchanges and to carry out the offer for sale. Listing of equity shares will
enhance LTTS’s brand name and provide liquidity to existing shareholders.
The listing will also provide a public market for the equity shares in India.
September 9, 2016
2
L&T Technology Services | IPO note
About the Company
LTTS, subsidiary of Engineering giant, L&T was incorporated in Jun-2012.
Thereafter in Jan-2014, Product Engineering Services (PES) division was transferred
from L&T Infotech (LTIL) to LTTS. In Apr-2014, Integrated Engineering Services (IES)
division was transferred from the parent to LTTS. As part of restructuring, LTTS
brought together engineers with domain expertise in product and process industry
from IES and PES to create specialized talent pool in ER&D services. In FY2015,
LTTS acquired majority of equity of TSIPL, a company engaged in the business of,
software development, IT consulting, software evaluation, design, implementation,
research and training in relation to computer software. Further, in FY2015, LTTS
also acquired certain of assets and liabilities of Dell Product and Process
Innovation Services, Engineering services division of Dell U.S.A., and also acquired
its operations in India from Dell India.
Exhibit 2: L&T Background
Larsen & Toubro Ltd.
Transferred in
Apr-2014
Others
IES
L&T Technology Services
L&T Infotech Ltd.
Transferred in
Others
PES
Jan-2014
Source: Company, Angel Research
If we look at FY2016 region-wise revenue split then 80% of LTTS revenues were
from North America and Europe (NA- 60%, Europe- 20%), 2 large regions of
corporate ER&D spend. These 2 regions a/c’ed for 73+% of $1,007bn corporate
ER&D services spend in 2015.
Notably, Top 100 spenders contributed 66% of G500 ER&D spend and LTTS’ key
global customers include 43 of the top 100 global ER&D spenders.
LTTS mainly operates in
5 key Industry segments, namely, Transportation,
Industrial Products, Telecom and Hi-tech, Process Industry and Medical Devices,
each represent significant component of G500 ER&D spend.
50% of FY2016 revenues were derived from Industrial Products, Process Industry
and Medical Devices. These segments represent $205bn of the G500 ER&D spend
and have low penetration by India based third-party ER&D service providers, which
gives LTTS competitive advantage.
September 9, 2016
3
L&T Technology Services | IPO note
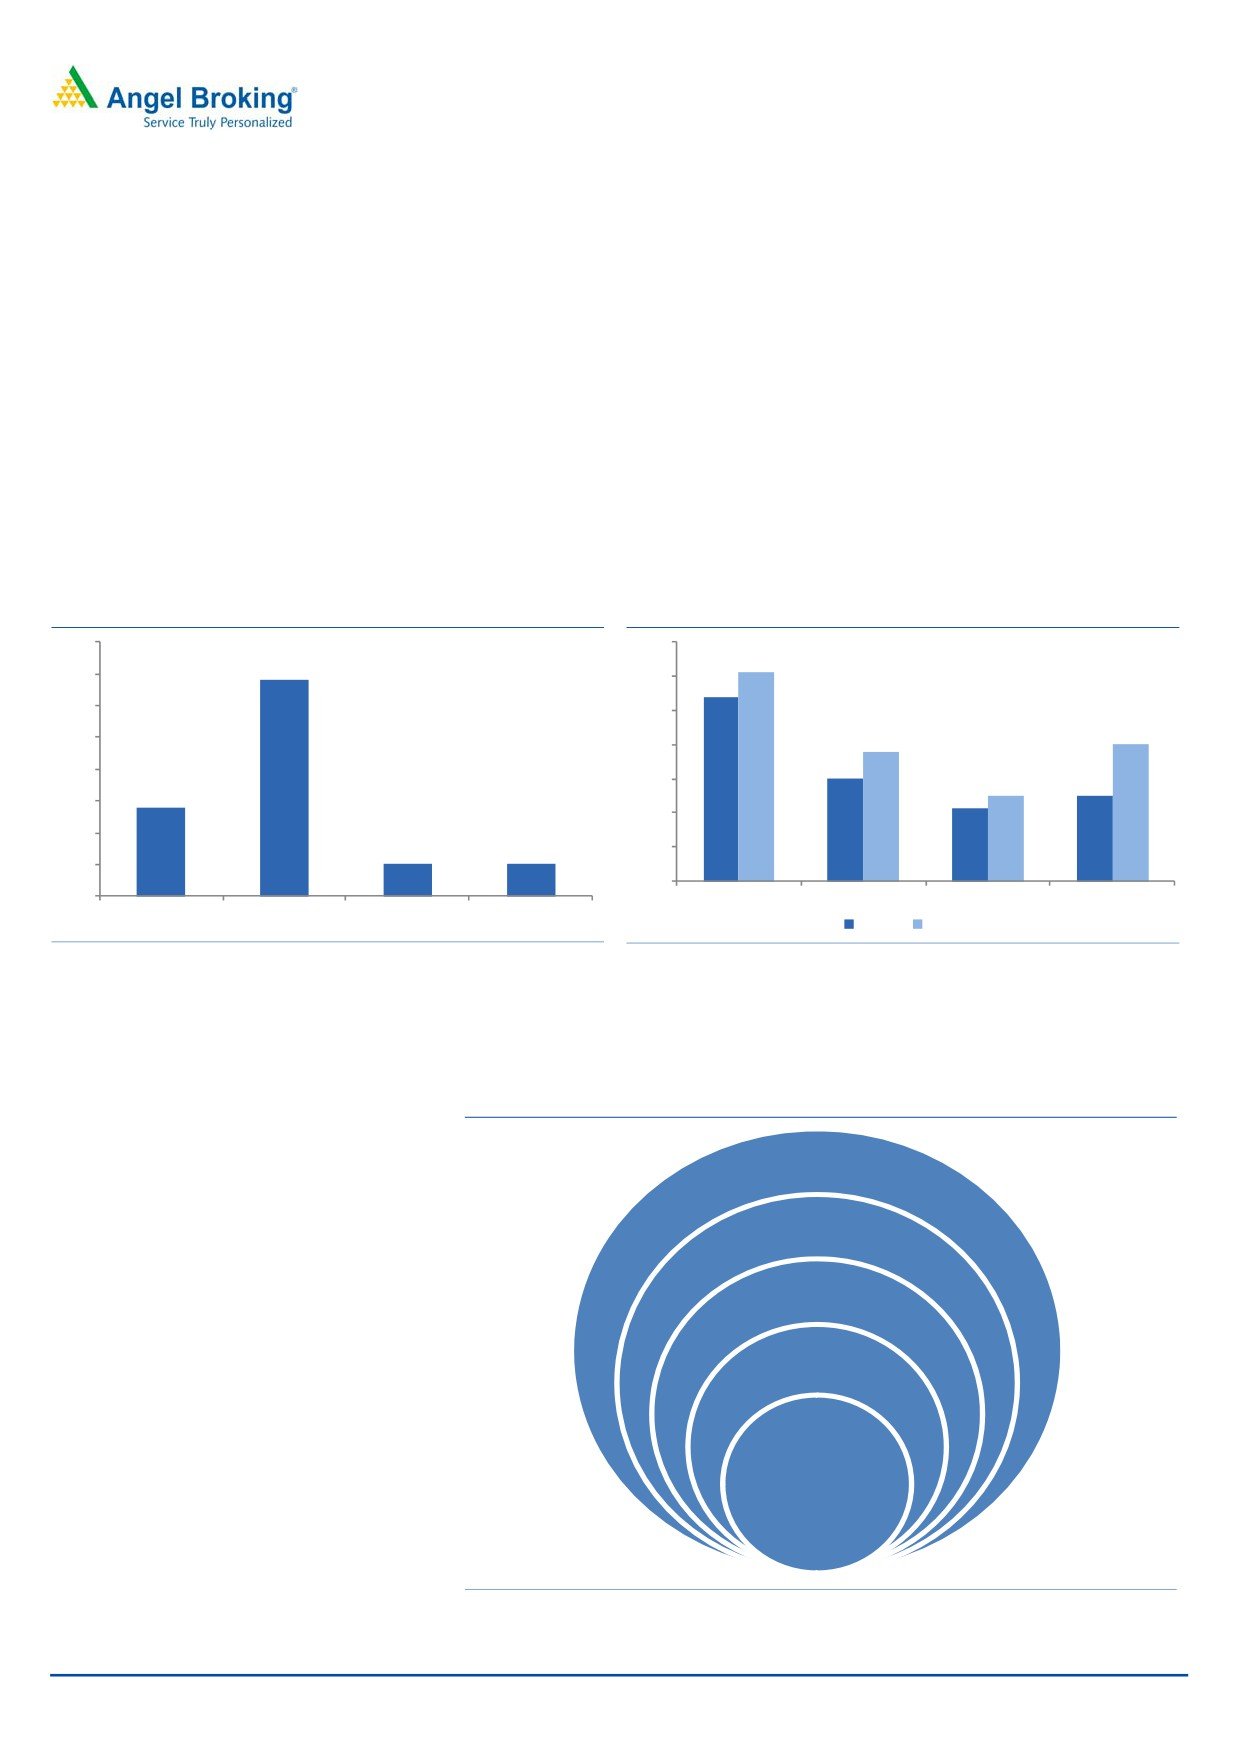
Exhibit 3: Segment-wise FY2016 revenue mix
Exhibit 4: Industry-wise FY2016 revenue mix
6%
12%
30%
8%
19%
20%
60%
20%
25%
North America Europe India Rest of World
Med. Devices Process Eng. Telecom & Hitech Ind. Products
Transport.
Source: Company, Angel Research
Source: Company, Angel Research
LTTS is considered as one of the world’s leading global pure play ER&D Services
Company. As an ER&D service provider, LTTS offers design, development solutions
throughout product development chain, provides solutions in areas of Mechanical
and Manufacturing Engineering, Embedded Systems, Software Engineering and
Process Engineering. For “new” technologies, LTTS provides services and solutions
in areas of Product Lifecycle Management (PLM), Engineering Analytics, Power
Electronics, M2M connectivity and IoT.
LTTS has invested in IoT, digital technologies (smart products, smart services, smart
manufacturing, smart operations) and Lab Infrastructure to strengthen its position
in these areas. Key decision makers of LTTS customers belong to Engineering/
Product Development/ R&D departments, which tend to have distinct budgets,
where industry domain knowledge and focus on R&D is highly critical in the choice
of outsourcing ER&D service provider. LTTS is of the view that customers value it as
pure-play services provider focused solely on ER&D services, giving them edge
over generalist IT service providers who also provide ER&D services.
LTTS is recognized by Zinnov in “leadership zone” in 8 Industry verticals (Industrial
Automation, Construction and Heavy Machinery, Medical Devices, Aerospace,
Automotive, Rail and Marine, Telecom, Energy and Utilities) & 2 horizontal
offerings (Embedded Systems and Mechanical). LTTS is ranked “high” by ARC
Advisory Group for deep capabilities in Consumer IoT, Industrial IoT, and Smart
Manufacturing.
LTTS currently has 12 Global Delivery Centres (GDCs) in India and overseas,
27 Sales offices in India, North America, Europe, Middle East and Asia and
31 Labs in India. LTTS has filed 35 proprietary patents, 134 patents have been
filed by our customers along with our employees. As of Jun-2016, LTTS has 9,419
Engineers from 9 nationalities serving 200+ customers, including more than 50 of
the Fortune 500 customers.
September 9, 2016
4
L&T Technology Services | IPO note
Investment rationale
ER&D is a large and growing market…
We see huge opportunity for Indian Engineering Research & Development (ER&D)
business going forward, on the back of (1) under-penetration seen (as only
2% of global ER&D is outsourced against 14% in IT Services and 34% in BPM) and
(2) India’s 22% market share of outsourced ER&D portion (against 61% in IT
Services and 38% in BPM). Zinnov Consulting highlights that India addresses
40% of the total outsourced Internet of Things (IoT) Technology market and
globally the IoT market is expected to grow at 16% CAGR during FY2016-21 to
$253bn. Value addition by Indian vendors and exposure to IoT and Analytics have
increased value proposition for the Indian vendors.
Exhibit 5: Share of sourcing in the global spend (%)
Exhibit 6: India's share in global sourcing (%)
40%
70%
61%
34%
35%
60%
54%
50%
30%
40%
25%
38%
40%
30%
20%
30%
25%
25%
14%
21%
15%
20%
10%
5%
5%
10%
5%
0%
0%
IT Services
BPM
ER&D
IOT
IT Services
BPM
ER&D
IOT
FY2013
FY2015
Source: Company, Zinnov. NASSCOM, Angel Research
Source: Company, Zinnov. NASSCOM, Angel Research
As per Zinnov only 2% of $1,007bn of Corporate ER&D spend is being addressed
from India, indicating huge growth potential. Zinnov identifies that of the $365bn
Exhibit 7: Large untapped market
Corporate ER&D spend
$1,007bn
G500 ER&D apend
$614bn
Addressable Engi.
Oustsourcing
$365bn
Global
addressed
market $67bn
Market
addressed from
India $20bn
Source: Company, Zinnov, Angel Research
September 9, 2016
5
L&T Technology Services | IPO note
of addressable engineering outsourcing potential, $215bn is from Product Eng.
Services & $150bn is from Process Eng. Services. Notably, of the $67bn global
addressable market, $36bn is related to Service Providers and $31bn is related to
Global in-house Centres. Within the $20bn identified Indian market opportunity,
$7.8bn is for Indian Service Providers.
Following are some of the advantages Indian Service Providers have over global
peers:
(1) Diversified range of service offerings across verticals (unlike
European/NA/ Chinese players who are specialized in Automotive, Aerospace,
Software, Internet, Telecom and Energy), (2) Skilled offering at low blended billing
rates of $40-50k/year (vs. $70-110k/year in NA & Europe).
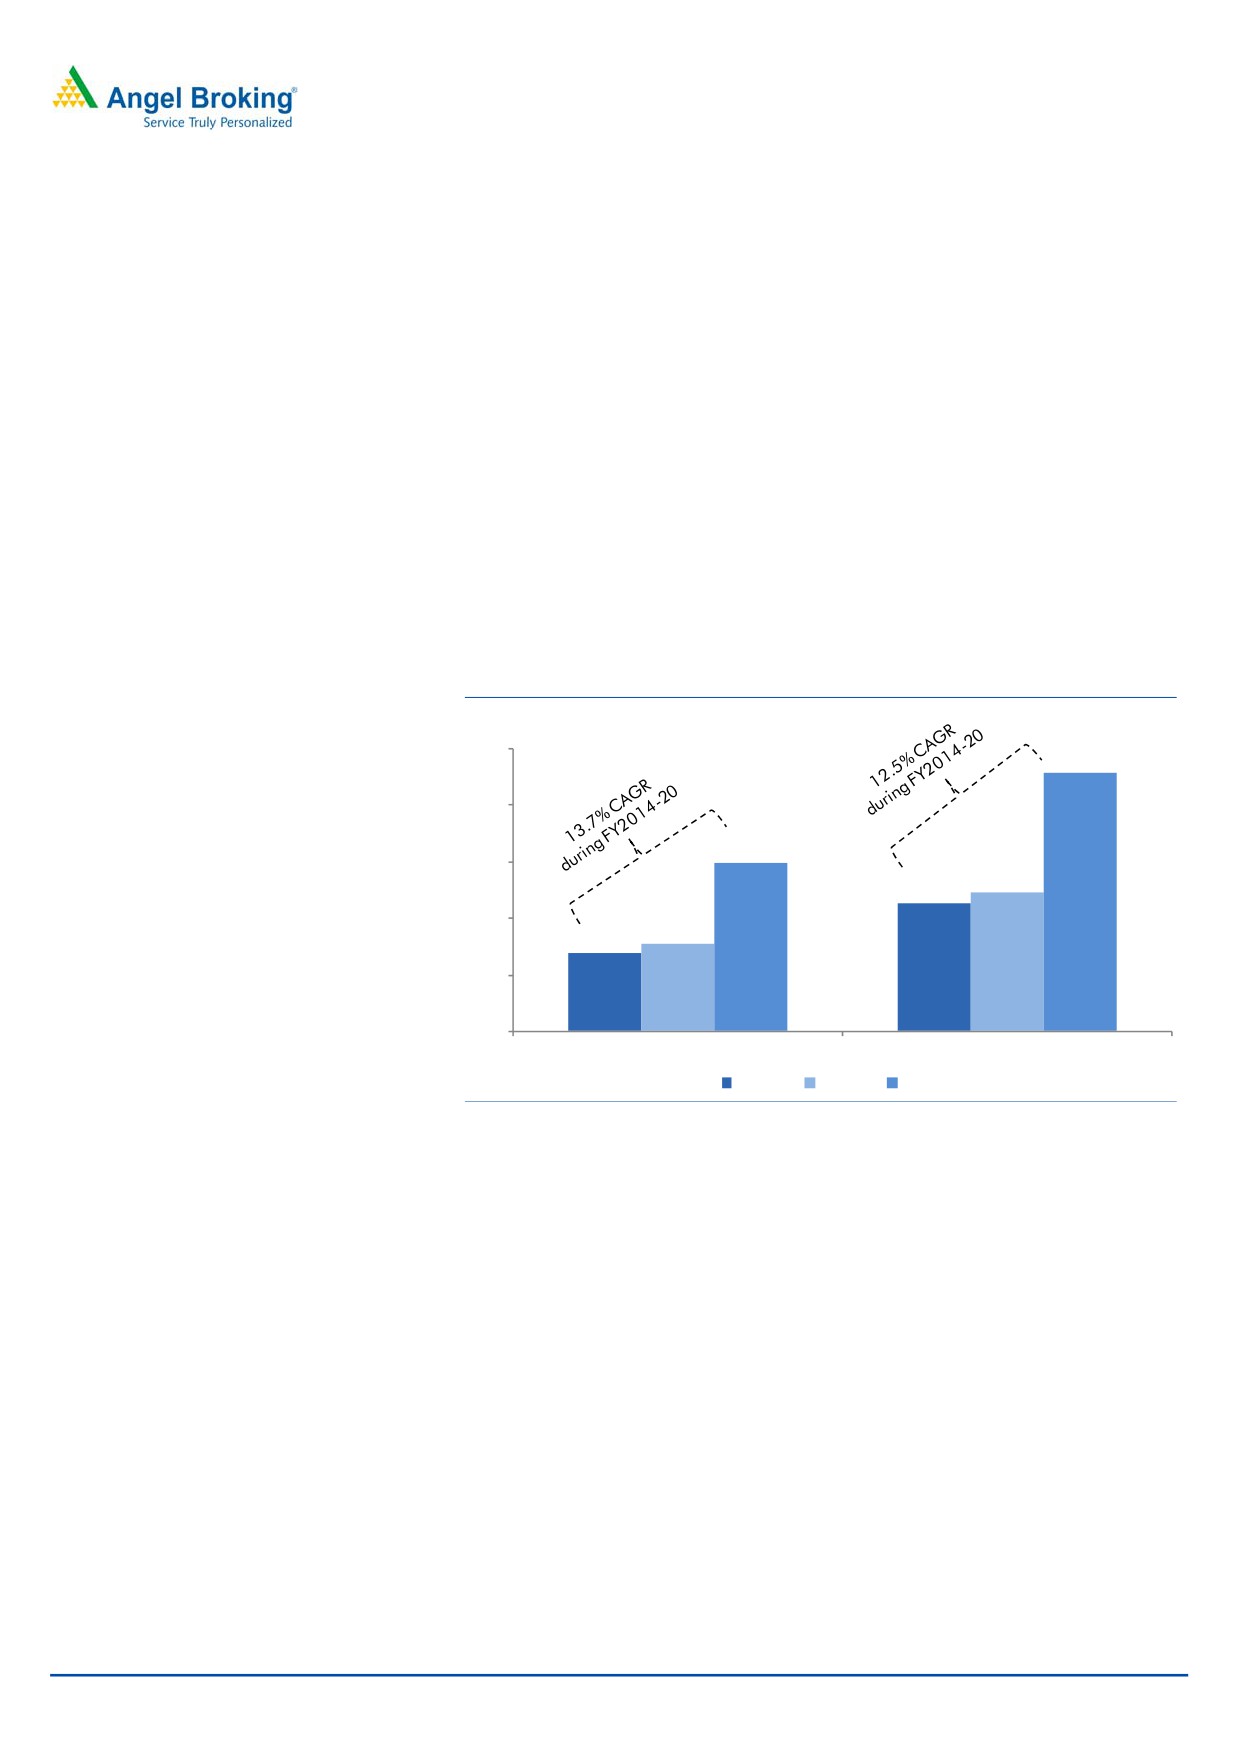
Indian ER&D market is expected to report 13% CAGR during FY2015-20E to
$38bn. Within Indian ER&D space, Service Providers are likely to report 13.7%
CAGR during FY2014-20 to $14.9bn, faster than 12.5% CAGR expected from
In-house R&D centers during the same time period.
Exhibit 8: Service Providers to report 13.7% CAGR during FY2014-20
25
22.9
20
14.9
15
12.3
11.3
10
7.8
6.9
5
0
Service Providers
In-house R&D Centres
FY2014
FY2015
FY2020
Source: Company, Zinnov, Angel Research
LTTS, a leading global pure-play ER&D player…
LTTS in last 3 years has emerged as one of the largest pure-play ER&D players in
India with a delivery model having strong offshore presence in India. LTTS has built
a global delivery model, with ~80% of its revenues booked from 2 of the largest
global markets, i.e. US and Europe.
Despite having presence across diversified verticals, strong market positioning
across low competitive verticals like, Industrial, Process has helped the company
scale operations, which can be seen from their FY2016 turn-over of `3,067cr, and
manpower of 9,419 Engineers who are serving 200+ customers.
September 9, 2016
6
L&T Technology Services | IPO note
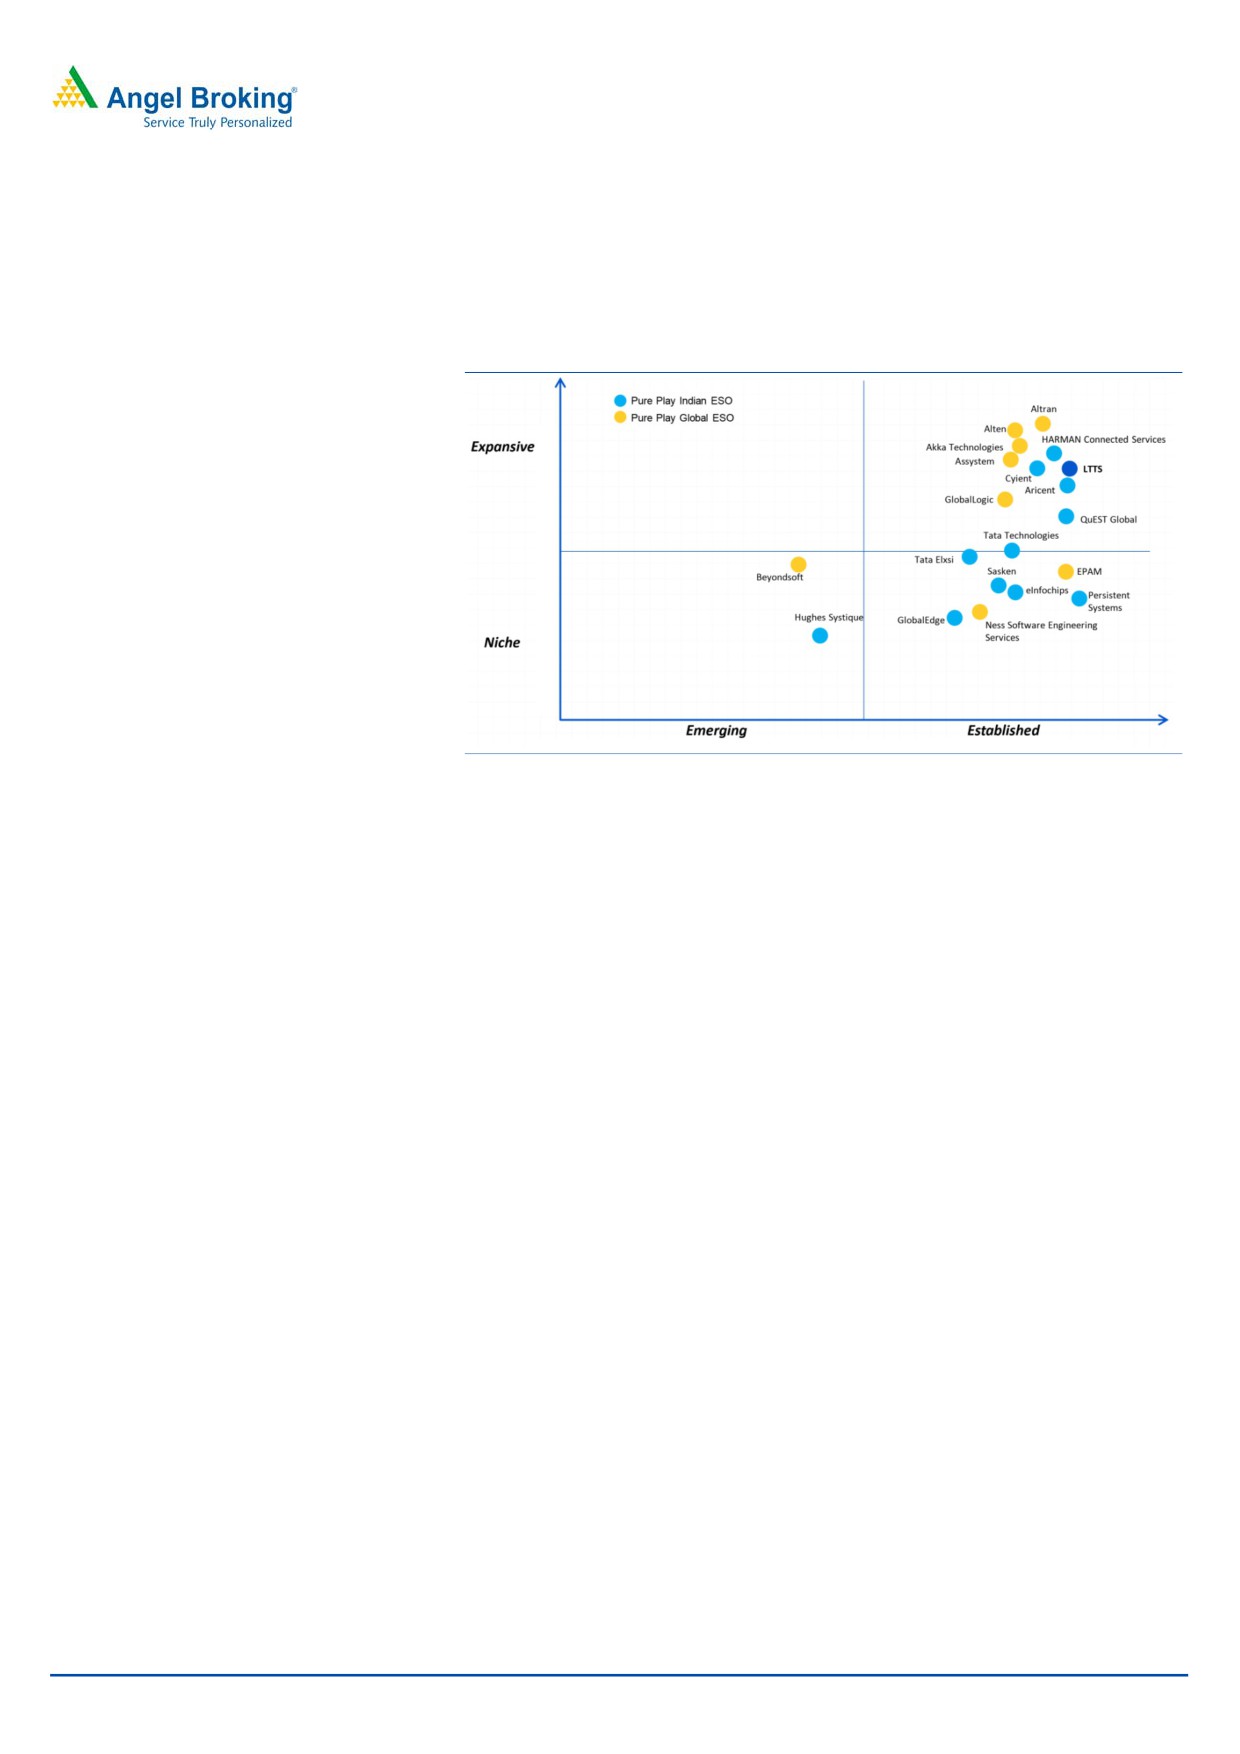
Zinnov in its 2015 report, has recognized LTTS in “leadership zone” in 8 Industry
verticals (Industrial Automation, Construction and Heavy Machinery, Medical
Devices, Aerospace, Automotive, Rail and Marine, Telecom, Energy & Utilities) and
2 horizontal Service offerings (Embedded systems and Mechanical).
Exhibit 9: Leading global pure-play ER&D company
Source: Company, Zinnov, Angel Research
LTTS end-to-end engineering expertise backed by its parent's engineering heritage
of 75+ years provides it with competitive edge over other ER&D players. Strong
parentage has helped (1) LTTS in attracting and retaining quality talent (reported
lower than industry attrition of 12-13%), (2) benefit from parents global network in
exploring business opportunities and getting direct access to senior decision
makers in potential end customers (~95% of business is repeat business).
LTTS, to pursue Multi-pronged growth strategy…
LTTS has been carved out of L&T’s IES and L&T Infotech’s PES division in 2014. If
we just take segmental revenues from both entities, before LTTS was carved out,
then LTTS reported 23.1% revenue CAGR during FY2013-16 to `3,066cr. This
growth is after reducing `111cr of revenues in FY2016 for some non-performing
accounts. LTTS is pursuing multi-pronged growth approach, which in our view
could possibly drive the earnings growth, going forward.
LTTS is pursuing multi-pronged growth strategy, which includes (a) Focus on
key Segments, Verticals and Geographies, (b) mine existing customers and
add new customers, (c) Focus on Solutions-oriented Engineering services, (d)
continued investment towards innovation labs, (e) pursue selective acquisitions,
and (f) Attract and retain employees
Focus on key Segments, Verticals and Geographies
LTTS focuses to pursue growth strategies to expand its market share across key
segments, verticals, geographies and solutions.
Currently LTTS is focusing on (1) Automotive (reported under Transportation) and
(2) all verticals categorized under Industrial Products, Consumer Electronics and
Product software (forms part of Telecom, Hi-tech) segment.
September 9, 2016
7
L&T Technology Services | IPO note
In Automotive vertical, LTTS would focus on software-based engineering solutions,
which will supplement its traditional strength in Auto-mechanics area. Area which
LTTS intends to expand in Automotive space include, Telematics, Advance
driver assist systems, V2X communication (includes vehicle-to-vehicle and
vehicle-to-infrastructure intelligent control and connectivity systems), Green
Technologies (hybrid vehicles, battery management systems), Infotainment and
Body electronics.
In Industrial products segment, LTTS plans to expand its offerings in IoT-enabled
smart products, Renewable Energy space with focus on storage, Grid connectivity,
Energy efficiency for Buildings. In Customer Electronics vertical, LTTS would focus
on Wearables, Connected Homes (Smart Homes), Camera and Security devices.
Geographically LTTS would continue to focus on North America and Europe, which
happen to be the 2 largest markets. Also, LTTS is working on setting-up Labs/
Development Centres in close proximity to its customers' offices. LTTS is keen to
focus on Austria, Switzerland markets and also establish a Delivery centre at East
Europe. LTTS is also keen to expand its operations in Japan, as number of its
existing and prospective Automotive customers are based in Japan.
Mine existing customers, develop new Customer relationships
Top 20 customers of LTTS contributed ~54% of FY2016 revenues (vs. ~56% in
FY2015). LTTS boasts to serve 43 of top 100 global ER&D spenders, representing
66% of G500 ER&D corporate spending budget (Source: Zinnov). This indicates
huge opportunity awaiting for the pure play ER&D companies.
Exhibit 10: Sourcing share in global spend (%)
Exhibit 11: Customer Concentration details...
No. of
No. of
Customer Revenue
Customers-
Customers-
Customer Concentration
FY2016
FY2015
($ mn)
FY2016
FY2015
20+
3
2
New customers added
36
8
10-20
8
8
Revenue from new customers (%)
5.4
1.3
5-10
17
16
Repeat business (%)
94.6
98.7
>1-5
44
41
Source: Company, Zinnov. NASSCOM, Angel Research
Source: Company, Zinnov. NASSCOM, Angel Research
Over the next few years, Top 100 ER&D spending is expected to grow in to a large
market opportunity for LTTS. With majority of LTTS clients belonging to the
sub-$5mn category (61% of the clients as of FY16), there exists scope for increase
in client mining, which could contribute to the long-term growth of LTTS. Also,
36 of these total 72 clients added in FY2016, contributed only 5.4% of the total
FY2016 revenues of `3,067cr.
LTTS is implementing a “T30:A3” model, whereby top customer a/c’s (contributing
in $10mn revenue bracket) have been identified under T30 model and are
developing relationships with adjacent customers, which are identified under A3
model (those with potential to be scaled to $5mn of yearly revenues). Here, LTTS is
identifying potential opportunities from within the same verticals and engage them
in cross-selling of solutions. Further, LTTS seeks to provide value-added solutions
by leveraging its in-depth industry expertise and then expanding the breadth of
services offered to them beyond those in the initial engagement.
September 9, 2016
8
L&T Technology Services | IPO note
Also LTTS aims to leverage its employee’s domain expertise in different services to
offer their customers multiple services and solutions under single engagement. For
example, one of their strategies is to structure large, long term deals with
customers, with defined time periods for execution. These deals would help the
company to improve their productivity and provide better revenue visibility.
Focus on Solutions-oriented Engineering services…
Based on its experience of having served clients in Digital Engineering, Mobile
Internet, IoT (IIoT, mBIoT), Knowledge Automation, Advanced Robotics,
Autonomous and near-autonomous Vehicles, Energy efficiency and Imaging and
Video solutions space, the company as a natural progression is building its
portfolio of Solutions-Oriented Engineering Services across verticals.
A logical extension of their strategy in our view is to develop industry-specific use
cases and then customize these solutions as per specific individual customer
requirements. In order to achieve this goal, LTTS is already in the process of
building and strengthening its alliances with the technology companies.
Higher investment towards Innovation labs…
LTTS has been continuously investing in innovation labs since its establishment and
currently has 31 such labs (located in Bengaluru, Mumbai, Mysore, Vadodara and
Chennai). LTTS also intends increase the scope of its existing labs by adding
space/ equipment to its existing labs to broaden their capabilities and address
customer needs. LTTS has highlighted that it would continue to invest towards the
innovation labs, which would help them provide competitive advantage to its
peers.
Expand business through selective acquisitions…
LTTS has pursued the inorganic growth strategy to grow its business. To-date it has
done 2 acquisitions. In Jun-2014, LTTS acquired 74% stake in TSIPL (Indian
subsidiary of Thales) to further strengthen its expertise in Transportation segment,
especially in the embedded avionics. Thereafter in Jul-2014, LTTS acquired certain
assets and liabilities of Dell India and in Nov-2014, acquired certain assets and
liabilities of Dell USA, which added 3 delivery centers in US to LTTS’s portfolio.
These acquisitions strengthened LTTS’s global ER&D position in Transportation
segment, widened the reach through local delivery centers and enhanced the
talent pool with addition of 200+ engineers to the workforce.
LTTS has further indicated that it would pursue selective acquisitions, strategic
alliances that provide it access to better infrastructure, industry knowledge,
technology expertise, geographical reach and allows it to expand to their vertical
offerings and customer base.
LTTS also intends to pursue acquisitions outside India in order to expand their
global footprint by leveraging low cost offshore delivery model and move greater
portion of their work offshore to India.
LTTS at FY2016-end is sitting on Debt of `195.5cr, reflecting Debt/Equity ratio of
0.2x. During FY2015-16, LTTS generated `822cr of Cash flow from operations.
Considering BS strength, cash generating potential from the current business, LTTS
September 9, 2016
9
L&T Technology Services | IPO note
is well positioned to pursue mid to small size acquisitions, without putting much of
stress on the balance sheet.
Attract, retain highly-skilled employees…
As of Jun-2016, LTTS has 9,419 Engineers with average age of 31 years,
serving 200+ customers. LTTS runs various programs and has been proactive
in attracting, retaining quality talent (reported lower than industry attrition of
12-13%).
Company pursuing multi-pronged growth strategy augurs well for its long-term
growth prospects.
Operational levers to aid Margin expansion…
We sense LTTS has multiple operating levers, which could aid its margin
expansion, going forward.
Exhibit 12: Utilization rates on uptrend...
Exhibit 13: Onshore-Offshore mix to improve...
78%
76%
76%
74%
47%
72%
71%
53%
70%
70%
68%
66%
FY15
FY16
1QFY17
Onsite
Offsite
Source: Company, Angel Research
Source: Company, Angel Research
Revenues from 36 clients added contributed just 5.4% to FY2016 revenues,
indicating that there exists possibility for further client mining from these newly
acquired customers. As a result, we expect Utilization rates in next few quarters to
improve from the 76% reported in 1QFY2017.
At FY2016-end, LTTS reported onshore-offshore mix of 53%:47%. With company
focusing on more of client mining, and maturity in the processes to be attained
going forward from these projects, there again exists possibility of favourable
movement in the onshore-offshore mix.
Further, LTTS has drawn strategy to focus on Solutions Oriented Engineering
services approach. As a result, it could focus on cross-selling existing offerings to
newer customers with some customization (as per requirement). This strategy in the
long-run would aid in gradual margin expansion.
Another margin expansion lever, LTTS has in its kitty is focus on the fast growing,
low competition verticals, like Industrial Products, Process Engineering, and
Medical Devices. Usually billing rates across these segment tend to stand higher
than other verticals, where more competition exists. Favourable shift in the mix
towards high billing and margin business could aid LTTS’s margin expansion
strategy in the long-run.
September 9, 2016
10
L&T Technology Services | IPO note
Strong Financials and Balance Sheet Strength…
LTTS reported 17.1% yoy top-line growth in FY2016, driven by higher repeat
business. Shift in business mix (higher contribution from the high margin business),
improvement in yoy utilization rates (from 69.5% in FY2015 to 71.4% in FY2016)
and better onshore-offshore mix (from 48%:52% in FY2015 to 47%:53% in
FY2016) helped the company report 174 bps improvement in its EBITDA margins
to 17% in FY2016.
We expect such strong performance to continue on the back of LTTS’s leadership
position in the higher growth ER&D verticals, and operating levers to continue to
aid the margin expansion.
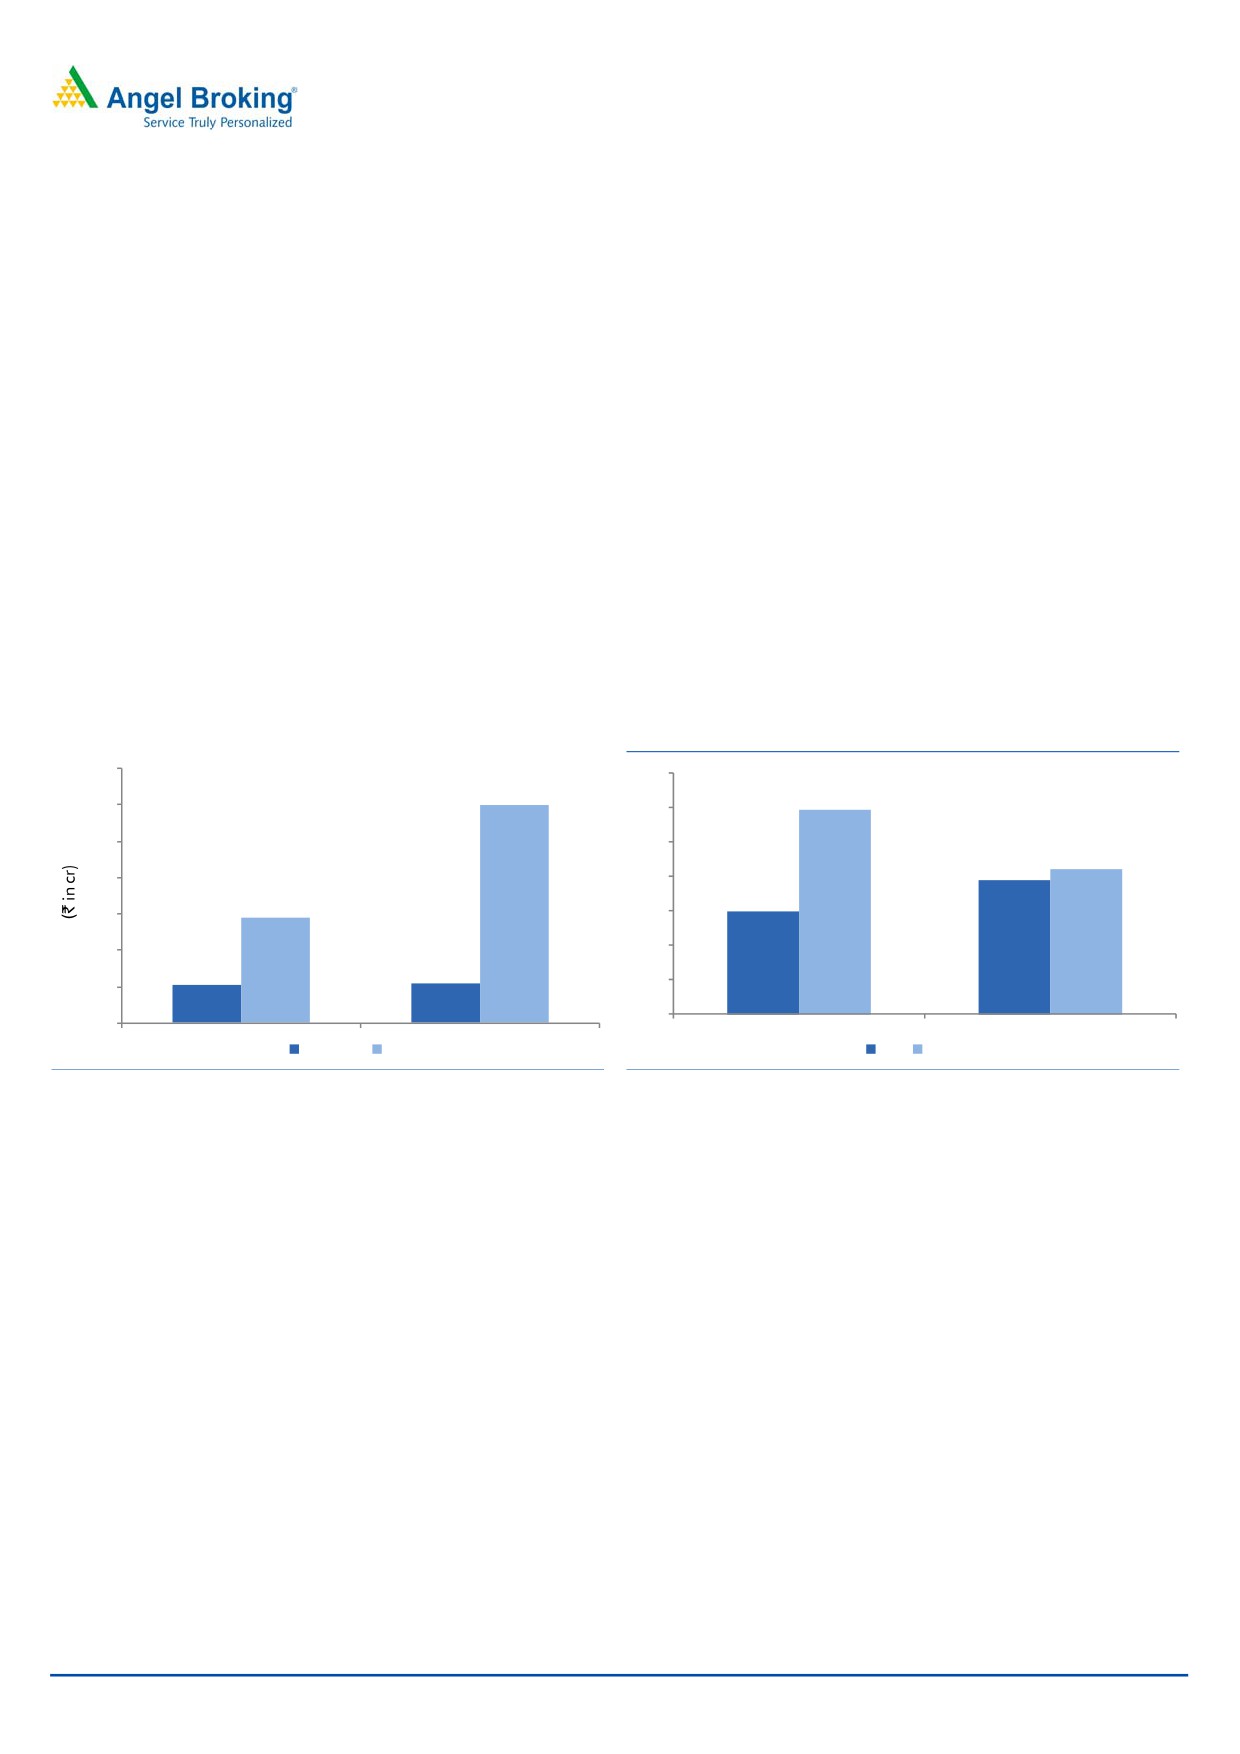
LTTS has an unlevered balance sheet as of FY2016, given their D/E ratio at 0.2x
(with debt o/s at `195cr). LTTS in last 2 years generated cash flow from operations
to the tune of `822cr (average for FY2015-16 at `411cr). Comfortable balance
sheet, strong cash flow generating potential of the business suggests that LTTS
could go ahead with small to mid size strategic acquisitions.
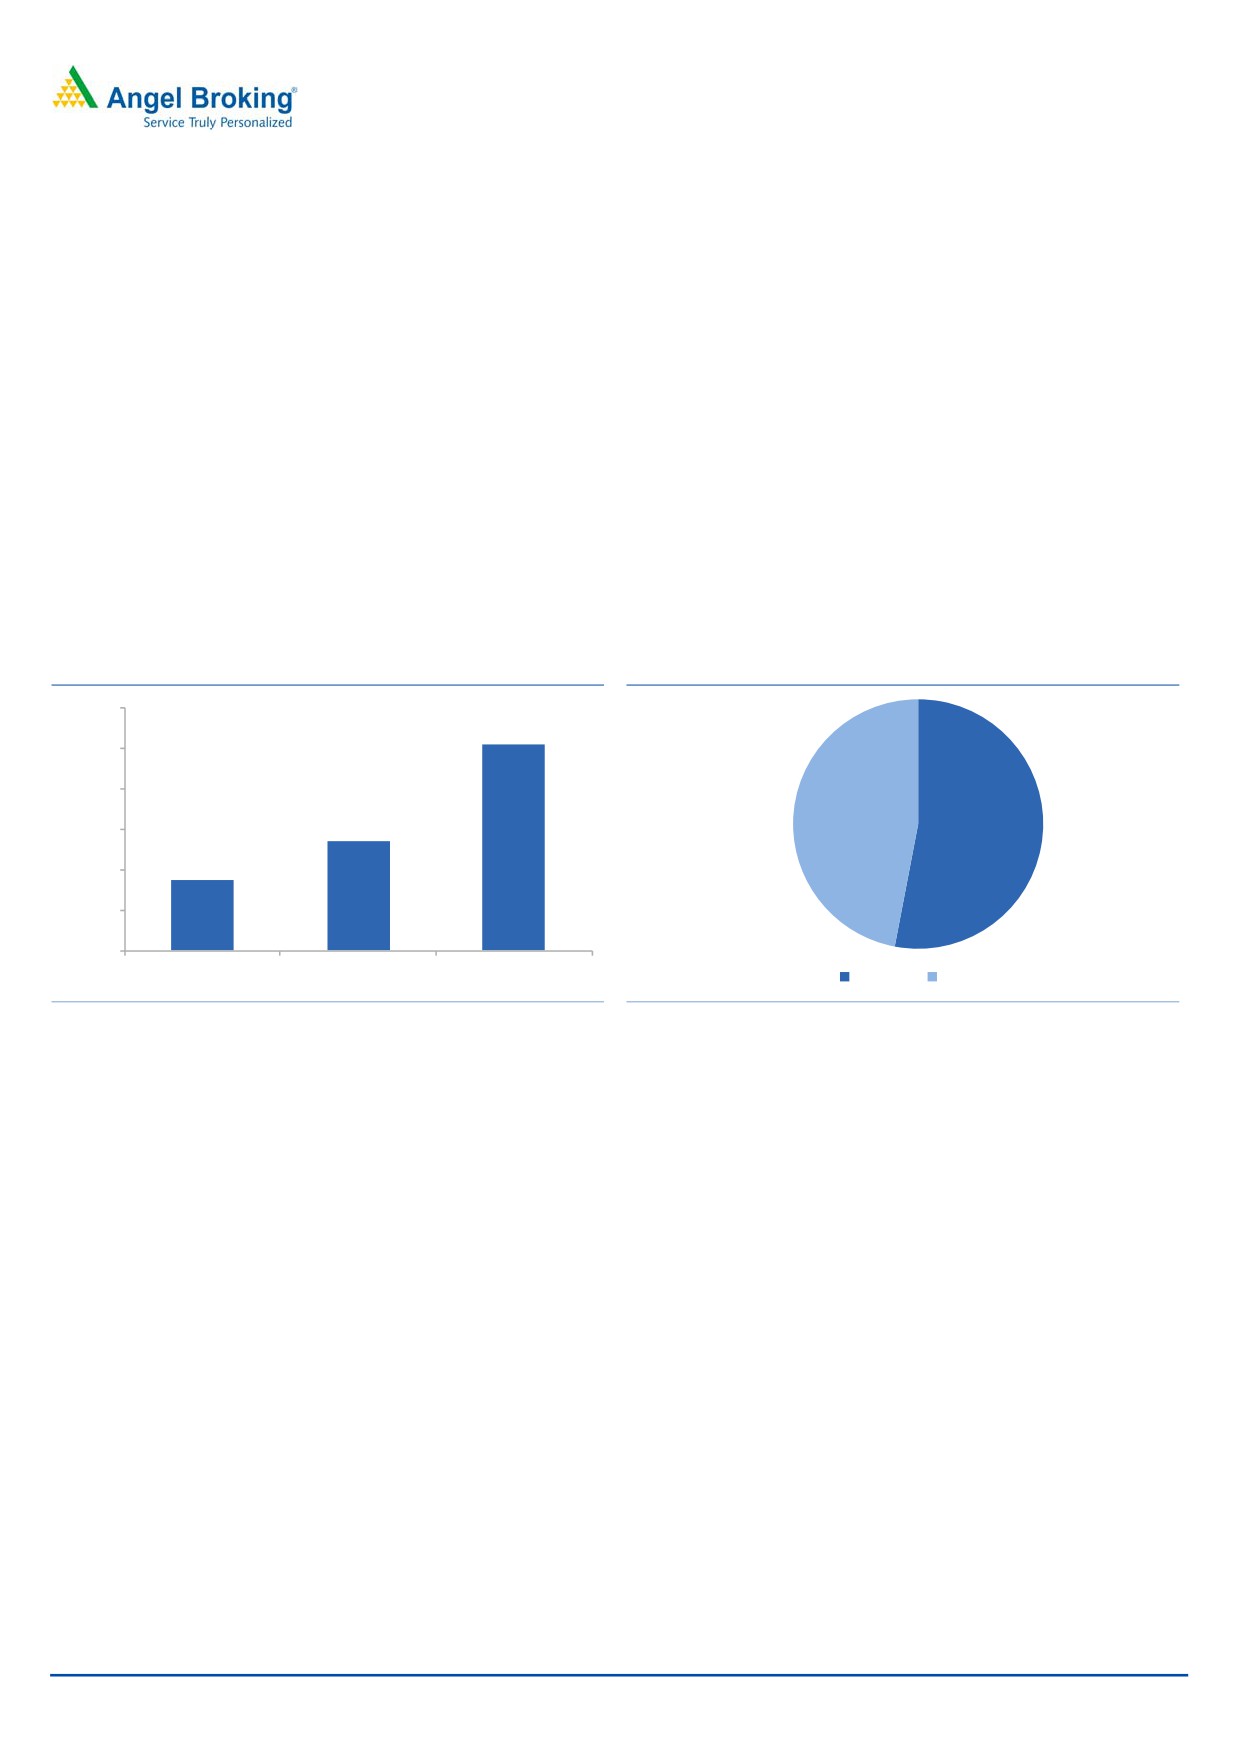
Exhibit 14: Strong Cash Flow from Operations potential
Exhibit 15: Impressive RoEs...
70
700
600
59.1
600
60
50
500
42.0
38.9
400
40
291
29.6
300
30
200
20
103
109
10
100
0
0
FY15
FY16
FY15
FY16
Net Debt
CFO
RoE RoCE
Source: Company, Angel Research
Source: Company, Angel Research
Risks & Concerns
1. For large clients willing to set-up their own captive R&D centers could act as a
big threat to company’s business. This could also lead to loss of business.
2. LTTS is dependent to large extent on limited number of customers. On loss of
a major client, LTTS could see decline in the company’s revenues.
September 9, 2016
11
L&T Technology Services | IPO note
Outlook and Valuation
LTTS reported 17.1% yoy top-line growth in FY2016, driven by higher repeat
business. LTTS is pursuing multi-pronged growth strategy of (1) focusing on key
segments, verticals and geographies, (2) mining the existing customers, add new
customers, (3) Focus on Solutions-oriented engineering, (4) continued investment
towards innovation labs, (5) expand business through selective acquisitions, and
(6) retain skilled employees, all augur well for long-term growth prospects of the
company. LTTS on the back of its leadership position in the high growth ER&D
space should be able to report strong revenue growth, going forward.
Continued shift in business mix (with high contribution from high margin business),
likely improvement in yoy utilization rates, better onshore-offshore mix should help
LTTS continue to report EBITDA margin expansion.
For comparison purposes, we have considered Tata Elexsi, Geometric, and Cyient.
Tata Elexsi generates >70% of revenues from Embedded product development
and the remaining from Systems Integration, Industrial design, Visual Effects and
Animation business (this segment’s contribution to the total revenues over the years
has been declining). Tata Elexsi is highly dependent on Transportation vertical,
especially Automotives segment. During FY2014-16, Tata Elexsi reported 18.0%
top-line CAGR to `1,075cr. High contribution from high margin Embedded
product development segment, better onshore-offshore mix helped the company
report 210bps EBITDA margin improvement during the same period to 23.0% and
46.4% PAT CAGR to `155cr.
Exhibit 16: Peer group comparison
Sales
Adj. PAT
Rev. CAGR PAT CAGR
EBITDA %
PAT %
RoE %
P/E
FY15
FY16
FY15
FY16
(FY14-16)
(FY14-16)
FY15
FY16
FY15
FY16
FY15
FY16
FY16
LTTS
2,619
3,067
311
417
20.0%
NA
15.2
17.0
11.9
13.6
29.6
38.9
21.0
Tata Elexsi
849
1,075
102
155
18.0%
46.4%
20.9
23.0
12.0
14.4
36.0
40.1
46.9
Geometric
1,105
1,234
55
105
6.1%
51.0%
12.1
14.3
5.0
8.5
13.5
22.2
14.4
Cyient
2,736
3,096
353
333
18.4%
11.9%
13.9
13.3
12.9
10.8
19.2
17.4
16.2
Average
15.6
16.9
10.0
11.2
22.9
26.6
25.8
Source: Company, Angel Research; Note: NA - Not available
Geometric offers a portfolio of Global Engineering Services, Product Lifecycle
Management (PLM) Solutions, Embedded System Solutions, and Digital Technology
Solutions. Software services a/c for >60% of revenues, with remaining from
Engineering Services. Geometric is pre-dominantly focused on 3 verticals namely,
Automotive, Industrial Heavy Equipment and Aerospace and Defense. During
FY2014-16, Geometric reported 6.1% top-line CAGR to `1,234cr. Shift in business
mix towards high realization areas, improvement in utilization, helped Geometric
report 224bps EBITDA margin expansion during the same period to 14.3% and
report 51% PAT CAGR to `105cr.
Cyient, one of the closest competitor to LTTS is the market leader in Engineering
Services space (accounted for >60% of revenues), especially in Aerospace and
September 9, 2016
12
L&T Technology Services | IPO note
Railways verticals. Data Transformation, Network & Operations (DNO) for
Communication Service Providers and Utilities account for remaining revenues.
During FY2014-16, Cyient reported 18.4% top-line CAGR during to `3,096cr, led
by 3 acquisitions. Revenue growth from organic business has been flat owing to
client specific issues. Pricing pressure, shift in business mix (towards low margin
business), re-investment in restructuring, acquisition of low margin business led to
61bps EBITDA margin decline during the same period to 13.3% and just 11.9%
PAT CAGR to `333cr.
LTTS fares better on all the above-mentioned metrics, given the 20.0% revenue
CAGR seen during FY2014-16, and strong earnings growth. Such strong financial
performance is driven by (1) new client additions, (2) mining of existing clients, and
(3) improvement in the utilization and onshore-offshore mix.
Again on considering Zinnov’s view of leadership position in 8 verticals, and more
operating levers in place, we are optimistic about LTTS continuing to perform
strongly, going forward (glimpse of it is already seen in the 1QFY2017 numbers,
EBITDA/ PAT margins were at 19.3%/14.8% in 1QFY2017 vs. 17.0%/13.6% in
FY2016).
On the back of strong financial performance, LTTS reported impressive RoE’s of
29.6%/38.9% for FY2015/16. This is against peers FY2016 RoE’s in the range of
13.5% (Geometric)-40.1% (Tata Elexsi).
LTTS trades at
21.0x FY2016 EPS at upper-end of issue price band. On
considering (1) strong growth potential of LTTS, which is ahead of some of the
industry peers, coupled with
(2)
38%+ RoE levels in FY2016, (3) FY2015-16
average cash flow from operations of `446cr, (4) strong ~64% dividend payout
(translating to ~4% dividend yield), we are of view that LTTS stock has the potential
to trade at premium to the peers. However, if we consider the average of the 3
peers, then LTTS stock has been priced at 19% discount. Given that the LTTS IPO
has been priced at discount, we advise SUBSCRIBE.
September 9, 2016
13
L&T Technology Services | IPO note
Profit & Loss Statement (Consolidate)
Y/E March (` cr)
FY15
FY16
Net Sales
2,619
3,067
% Chg
17.1
Total Expenditure
2,220
2,546
Operating Expenses
230
266
Employee benefits Expense
1,487
1,723
Other Expenses
503
557
EBITDA
399
520
% Chg
30.5
EBIDTA %
15.2
17.0
Depreciation
48
59
EBIT
350
462
% Chg
31.7
Interest and Financial Charges
3
2
Other Income
25
76
EBT & exceptional items
372
535
Exceptional Items
0
0
EBT
372
535
Tax Expenses
61
119
% of PBT
16.4
22.2
PAT
311
417
Minority Interest loss/ (Income)
(0)
0
PAT after MI
311
417
% Chg
33.8
PAT %
11.9
13.6
Diluted EPS
30.6
41.0
% Chg
33.8
September 9, 2016
14
L&T Technology Services | IPO note
Balance Sheet (Consolidate)
Y/E March (` cr)
FY15
FY16
Sources of Funds
Equity Capital
1,050
1,050
Reserves & Surplus
2
43
Networth
1,052
1,093
Total Debt
219
195
Deferred Tax Liabilities (net)
0
0
Other Long-term Liabilities & Prov.
7
19
Total Liabilities
1,278
1,307
Application of Funds
Gross Block
562
628
Accumulated Depreciation
61
120
Net Block
1,064
1,160
Goodwill
8
8
Investments
0
56
Current Assets
Inventories
175
147
Sundry Debtors
685
727
Cash and Bank Balance
115
86
Loans & Advances
232
234
Other Current Asset
0
0
Current Liabilities
537
614
Net Current Assets
671
581
Deferred Tax Assets
37
36
Total Assets
1,278
1,307
September 9, 2016
15
L&T Technology Services | IPO note
Cash Flow Statement (Consolidate)
Y/E March (` cr)
FY15
FY16
Profit before tax
372
535
Depreciation & Other Non-cash Charges
48
59
Change in Working Capital
(64)
151
Interest & Financial Charges
2
(1)
Direct taxes paid
(67)
(145)
Cash Flow from Operations
291
600
(Inc)/ Dec in Fixed Assets
(53)
(127)
(Inc)/ Dec in Investments & Oth. Adj.
(614)
(52)
Cash Flow from Investing
(667)
(179)
Issue/ (Buy Back) of Equity
547
0
Inc./ (Dec.) in Borrowings
170
(23)
Dividend Paid (Incl. Tax)
(250)
(358)
Interest Expenses & Oth. Adj.
(3)
(2)
Cash Flow from Financing
464
(383)
Inc./(Dec.) in Cash & forex translation
86
(29)
Opening Cash balances
29
115
Closing Cash balances
115
86
September 9, 2016
16
L&T Technology Services | IPO note
Ratio Analysis
Y/E March
FY15
FY16
Valuation Ratio (x)
Adj. P/E (on FDEPS)
28.1
21.0
Adj. P/CEPS
24.3
18.4
Dividend yield (%)
4.9
4.7
EV/Sales
1.8
2.2
EV/EBITDA
11.6
12.8
EV / Total Assets
0.4
0.6
Per Share Data (`)
Adj. EPS (fully diluted)
30.6
41.0
Cash EPS
35.4
46.8
DPS
41.8
40.3
Book Value
103
107
Returns (%)
RoCE (Pre-tax)
33.3
42.2
Angel RoIC (Pre-tax)
27.3
35.3
RoE
29.6
38.9
Turnover ratios (x)
Total Asset Turnover (x)
2.0
2.3
Inventory / Sales (days)
24
18
Receivables (days)
96
87
Payables (days)
75
73
WC (days)
45
31
Leverage Ratios (x)
D/E ratio (x)
0.2
0.2
Source: Company, Angel Research; Note: Considered Upper price band of `860/share; For EPS
and other valuation purposes, we have considered 10.2cr shares o/s
September 9, 2016
17
L&T Technology Services | IPO note
Research Team Tel: 022 - 39357800
DISCLAIMER
Angel Broking Private Limited (hereinafter referred to as “Angel”) is a registered Member of National Stock Exchange of India Limited,
Bombay Stock Exchange Limited and Metropolitan Stock Exchange Limited. It is also registered as a Depository Participant with CDSL
and Portfolio Manager with SEBI. It also has registration with AMFI as a Mutual Fund Distributor. Angel Broking Private Limited is a
registered entity with SEBI for Research Analyst in terms of SEBI (Research Analyst) Regulations, 2014 vide registration number
INH000000164. Angel or its associates has not been debarred/ suspended by SEBI or any other regulatory authority for accessing
/dealing in securities Market. Angel or its associates/analyst has not received any compensation / managed or co-managed public
offering of securities of the company covered by Analyst during the past twelve months.
This document is solely for the personal information of the recipient, and must not be singularly used as the basis of any investment
decision. Nothing in this document should be construed as investment or financial advice. Each recipient of this document should
make such investigations as they deem necessary to arrive at an independent evaluation of an investment in the securities of the
companies referred to in this document (including the merits and risks involved), and should consult their own advisors to determine
the merits and risks of such an investment.
Reports based on technical and derivative analysis center on studying charts of a stock's price movement, outstanding positions and
trading volume, as opposed to focusing on a company's fundamentals and, as such, may not match with a report on a company's
fundamentals. Investors are advised to refer the Fundamental and Technical Research Reports available on our website to evaluate the
contrary view, if any.
The information in this document has been printed on the basis of publicly available information, internal data and other reliable
sources believed to be true, but we do not represent that it is accurate or complete and it should not be relied on as such, as this
document is for general guidance only. Angel Broking Pvt. Limited or any of its affiliates/ group companies shall not be in any way
responsible for any loss or damage that may arise to any person from any inadvertent error in the information contained in this report.
Angel Broking Pvt. Limited has not independently verified all the information contained within this document. Accordingly, we cannot
testify, nor make any representation or warranty, express or implied, to the accuracy, contents or data contained within this document.
While Angel Broking Pvt. Limited endeavors to update on a reasonable basis the information discussed in this material, there may be
regulatory, compliance, or other reasons that prevent us from doing so.
This document is being supplied to you solely for your information, and its contents, information or data may not be reproduced,
redistributed or passed on, directly or indirectly.
Neither Angel Broking Pvt. Limited, nor its directors, employees or affiliates shall be liable for any loss or damage that may arise from
or in connection with the use of this information.
September 9, 2016
18