3QFY2016 Result Update | Capital Goods
February 2, 2016
Kirloskar Oil Engines
NEUTRAL
CMP
`235
Performance Highlights
Target Price
-
Y/E March (` cr)
3QFY16
3QFY15
% chg. (yoy)
2QFY15
% chg. (qoq)
Investment Period
-
Net Sales
601
612
(1.8)
590
1.8
EBITDA
49
58
(15.9)
48
1.3
Stock Info
EBITDA margin (%)
8.1
9.5
(137)
8.2
(4)
Sector
Capital Goods
PAT
29
34
(14.9)
36
(18.7)
Market Cap (` cr)
3,404
Source: Company, Angel Research (Standalone)
Net debt (` cr)
(866)
Beta
0.4
Kirloskar Oil Engines (KOEL) reported a disappointing set of numbers for
52 Week High / Low
348 / 218
3QFY2016. Its top-line for the quarter declined by 1.8% yoy to `601cr. Employee
Avg. Daily Volume
14,232
expense as a percentage of sales increased by 34bp yoy to 8.5%, and other
Face Value (`)
2
expenses as a percentage of sales increased by 181bp yoy to 19.6% of sales. This
BSE Sensex
24,825
resulted in the EBITDA margin contracting by 137bp yoy to 8.1%. There was an
Nifty
7,556
exceptional expense of `10.4cr during the quarter related to Voluntary Retirement
Reuters Code
KIRO.BO
Scheme (VRS) for employees. Adjusting for the VRS expense, the net profit
Bloomberg Code
KOEL IN
declined by 14.9% yoy to `29cr.
Outlook to remain subdued in the near term: In the near term, we expect the
Shareholding Pattern (%)
company to witness some pressure on account of overall slowdown in the Genset
Promoters
59.3
industry. In addition, the absence of NPCIL orders in large engines segment has
MF / Banks / Indian Fls
8.8
been impacting the top-line and profitability. The company has guided that
FII / NRIs / OCBs
12.2
although the near term outlook remains muted, it is hopeful about the longer
Indian Public / Others
19.7
term prospects. KOEL has expanded its capacity in the past and is positioned to
successfully cater to improvement in demand once the operating environment
changes in the longer run. KOEL also has taken measures to increase its focus on
Abs.(%)
3m 1yr
3yr
exports which should aid growth.
Sensex
(6.5)
(14.8)
25.5
Cash rich position: KOEL is a debt free company with cash and cash equivalents
KOEL
(13.5)
(12.4)
15.4
of ~`835cr as of 1HFY2016. With ample capacity in place, there is no major
capex expected in the near future. Consequently depreciation expense is also expected to
remain low which will aid the bottom-line. We expect KOEL’s cash and cash equivalents to
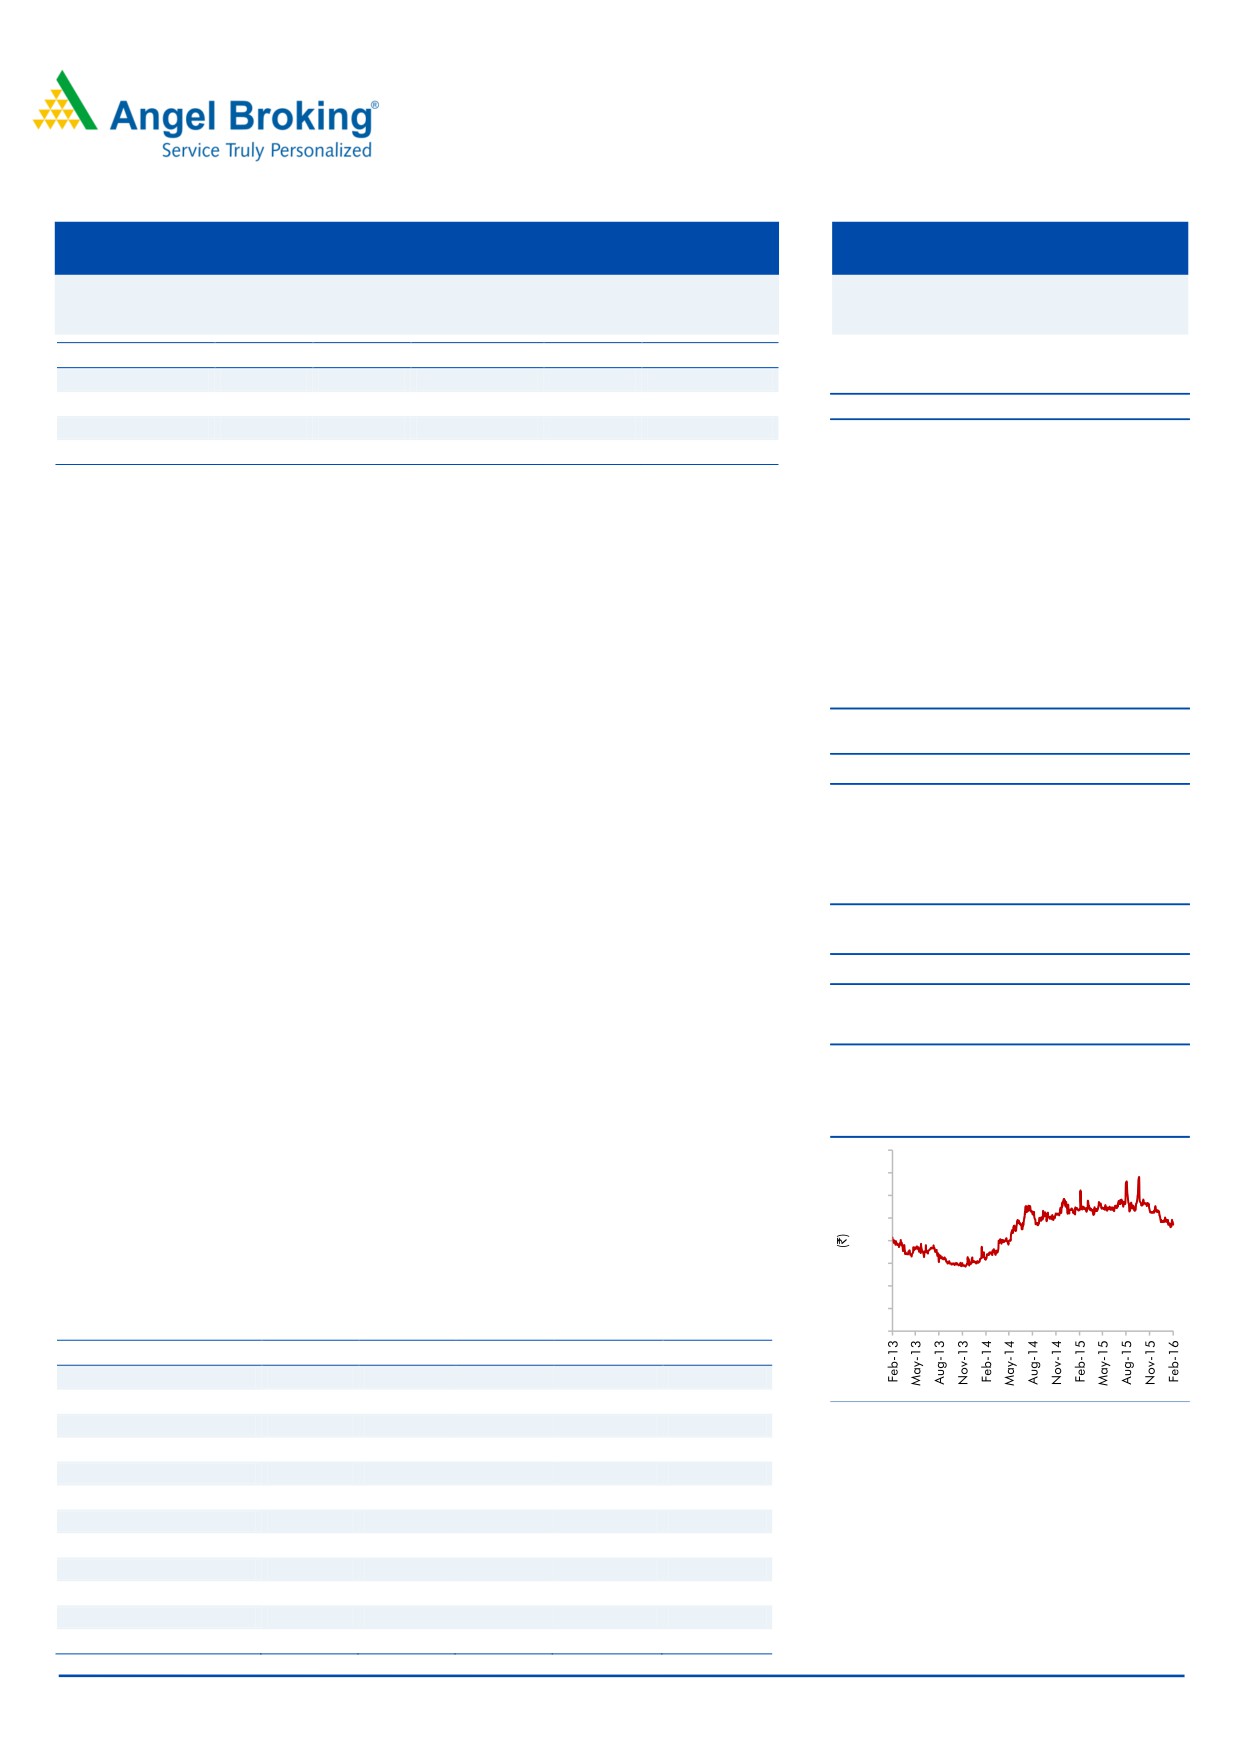
3 Year price chart
be at ~`1,038cr in FY2018E which is ~30% of the current market cap.
400
Outlook and Valuation: We expect KOEL’s revenue to recover post FY2016, ie to
350
300
`2,800cr in FY2018E. With recovery in the top-line, we expect the EBITDA margin
250
to recover to 10.0% in FY2018E. Consequently the profit is expected to grow to
200
`175cr in FY2018E. At the current market price, the stock trades at 19.5x its
150
FY2018E earnings. We maintain our Neutral view on the stock.
100
50
Key financials
0
Y/E March (` cr)
FY2014
FY2015
FY2016E
FY2017E
FY2018E
Net Sales
2,319
2,507
2,403
2,554
2,800
% chg
(1.6)
8.1
(4.1)
6.3
9.6
Source: Company, Angel Research
Adj. Net Profit
178
143
133
152
175
% chg
(15.9)
(19.8)
(7.2)
14.2
15.2
OPM (%)
13.1
9.9
8.6
9.9
10.0
EPS (`)
12.3
9.9
9.2
10.5
12.1
P/E (x)
19.1
23.8
25.6
22.4
19.5
P/BV (x)
2.7
2.5
2.5
2.3
2.2
RoE (%)
14.7
11.0
9.7
10.7
11.7
RoCE (%)
16.4
10.9
7.2
9.5
10.4
Milan Desai
EV/Sales (x)
1.2
1.0
1.1
1.0
0.8
022 4000 3600 Ext: 6846
EV/EBITDA (x)
9.0
10.1
12.3
9.8
8.4
Source: Company, Angel Research, Note: CMP as of February 1, 2016
Please refer to important disclosures at the end of this report
1
Kirloskar Oil Engines | 3QFY2016 Result Update
Exhibit 1: 3QFY2016 performance highlights
Y/E March (` cr)
3QFY16
3QFY15
% chg. (yoy) 2QFY15
% chg. (qoq)
9MFY2016
9MFY2015
% chg
Net Sales
601
612
(1.8)
590
1.8
1,772
1,879
(5.7)
Net raw material
383
395
(3.0)
368
4.2
1,124
1,220
(7.9)
(% of Sales)
63.8
64.6
(79)
62.3
148
63.4
64.9
(2.3)
Employee Cost
51
50
2.4
50
1.4
149
144
3.3
(% of Sales)
8.5
8.1
34
8.5
(3)
8.4
7.7
9.5
Other Expenses
118
109
8.2
124
(5.0)
350
317
10.2
(% of Sales)
19.6
17.8
181
21.0
(141)
19.7
16.9
16.9
Total Expenditure
552
554
(0.3)
542
1.9
1,622
1,681
(3.5)
Operating Profit
49
58
(15.9)
48
1.3
150
197
(24.1)
OPM (%)
8.1
9.5
(137)
8.2
(4)
8.4
10.5
(205)
Interest
0
0
(50.0)
0
(50.0)
0
0
(76.9)
Depreciation
27
26
5.6
27
1.2
80
76
5.5
Other Income
18
16
13.1
20
(5.7)
57
42
35.4
Exceptional Item
10
-
-
PBT
30
49
(38.7)
41
(27.1)
117
164
(28.7)
(% of Sales)
5.0
8.0
7.0
6.6
8.7
Tax
8
15
(44.6)
5
52.4
23
47
(50.4)
(% of PBT)
27.4
30.3
13.1
19.9
28.7
Reported PAT
22
34
(36.2)
36
(39.1)
93
117
(20.0)
Extraordinary Expense/(Inc.)
7
-
-
7
-
Adjusted PAT
29
34
(14.9)
36
(18.7)
101
117
(13.8)
PATM
4.8
5.6
6.1
5.7
6.2
Source: Company, Angel Research
Exhibit 2: Actual vs. Angel estimates (3QFY2016)
Y/E March (` cr)
3QFY16
Angel est.
% diff
Net sales
601
630
(4.7)
EBITDA
49
58
(15.1)
EBITDA margin (%)
8.1
9.1
(99)
Adj. PAT
29
34
(15.3)
Source: Company, Angel Research
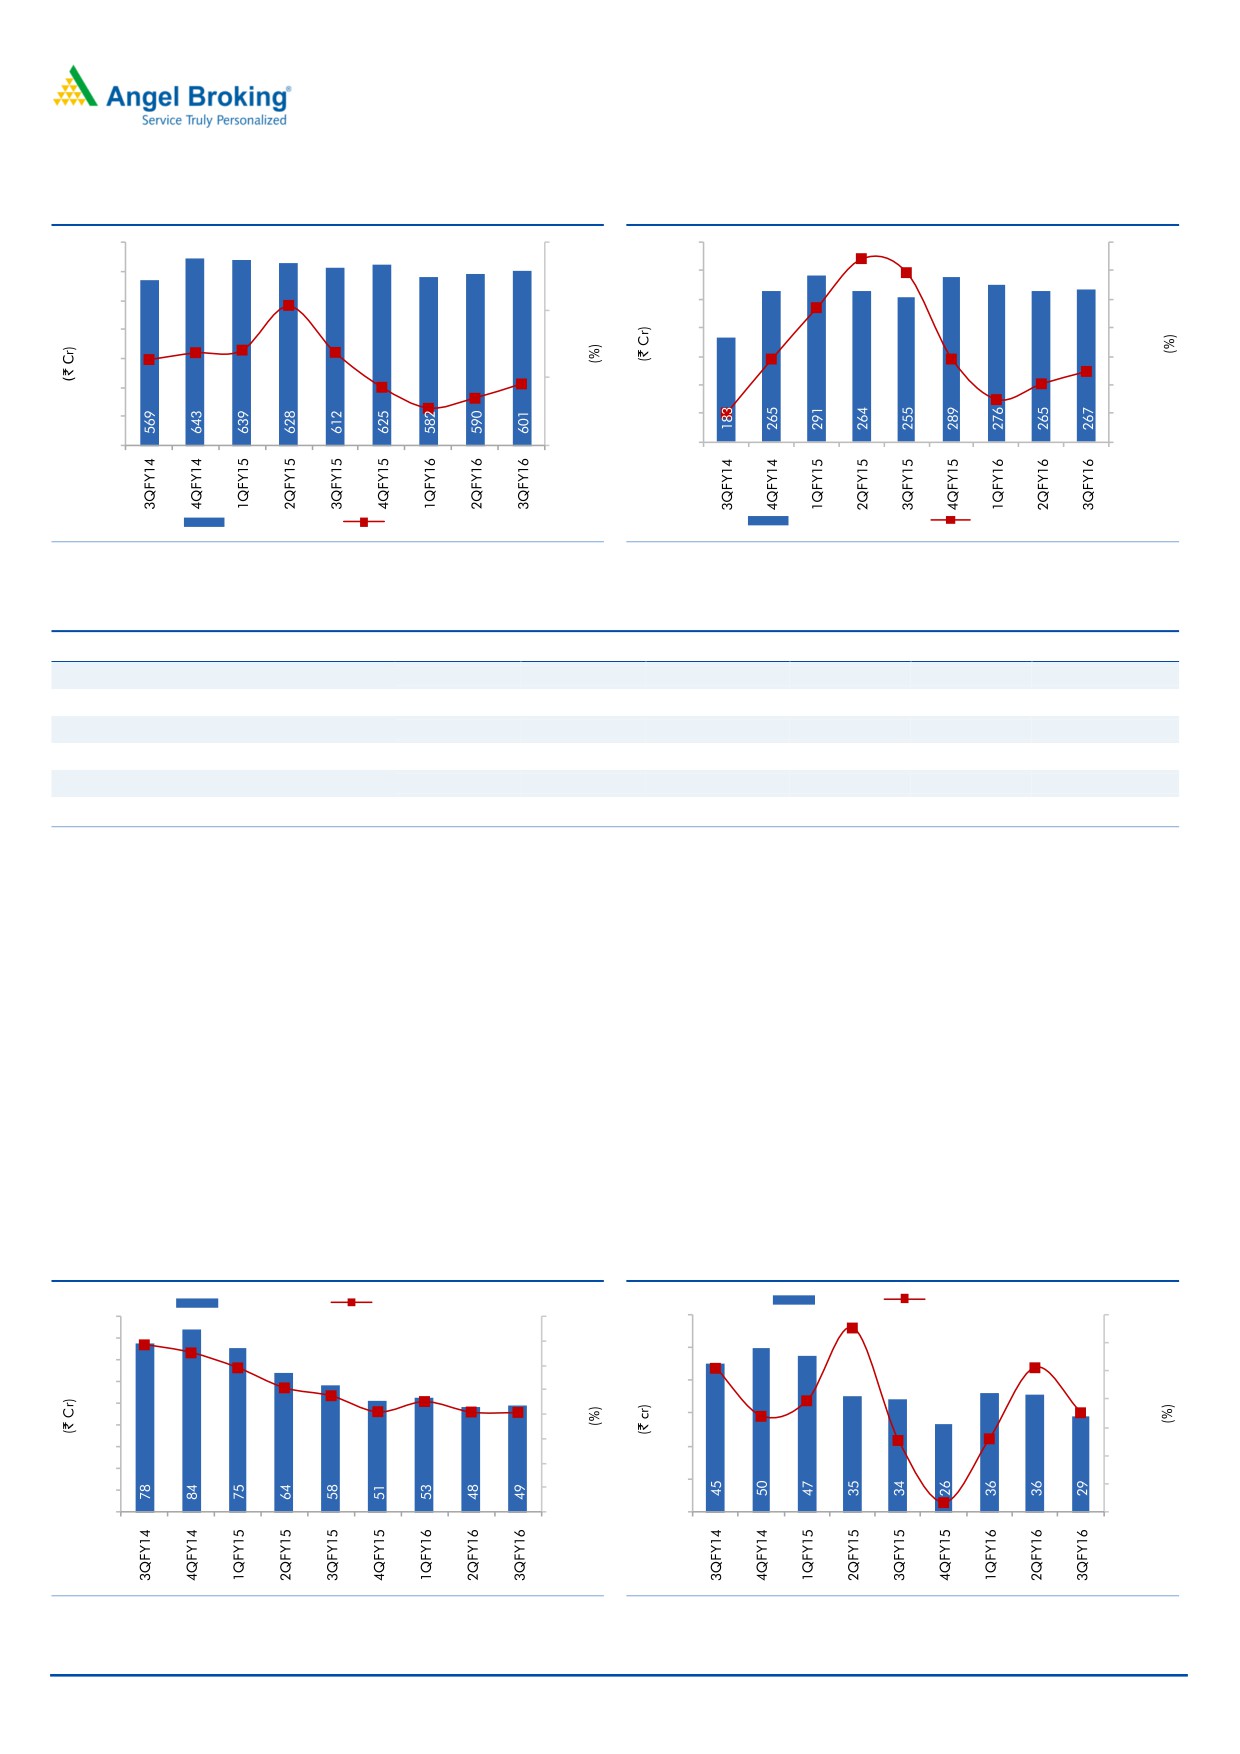
Top-line growth remains subdued
KOEL’s top-line for the quarter declined by 1.8% yoy to `601cr against our
estimate of `630cr. The decline was mainly on account of decline in large engines
business (post the execution of final portion of NPCIL order). The power gen
segment which accounts for ~45% of total revenue grew by 5% yoy to `267cr,
while the agricultural segment grew by 23% yoy to `129cr. Industrial and customer
support remained flat while large engines business declined by 62% yoy to `26cr.
February 2, 2016
2
Kirloskar Oil Engines | 3QFY2016 Result Update
Exhibit 3: Top-line remains subdued
Exhibit 4: PowerGen Segment growth
700
40.0
350
50.0
44.3
39.3
600
300
40.0
500
250
27.1
30.0
8.2
21.4
20.0
400
200
20.0
5.4
7.4
7.5
150
9.1
10.0
300
9.1
4
.7
(6.0)
(2.8)
200
(1
.8)-
100
-
(9.0)
0.4
(5.2)
100
50
(10.0)
(9.9)
-
(20.0)
-
(20.0)
Revenue (LHS)
yoy growth (RHS)
PowerGen (LHS)
yoy growth (RHS)
Source: Company, Angel Research
Source: Company, Angel Research
Exhibit 5: Segmental Performance 3QFY2016
(` Cr)
3QFY16
3QFY15
% chg. (yoy)
9MFY16
9MFY15
% chg. (yoy)
PowerGen
267
255
4.7
808
809
(0.2)
Agricultural
129
105
22.9
335
310
7.9
Industrial
92
93
(1.7)
282
286
(1.6)
Customer Support
81
82
(1.3)
253
258
(2.1)
Large Engines
26
68
(61.8)
78
190
(59.1)
Total
595
604
1,756
1,856
Source: Company, Angel Research
EBITDA Margin contracts on account of higher other expenses
The raw material cost declined by 79bp yoy to 63.8% of sales, employee expense
increased by 34bp yoy to 8.5% of sales, while other expenses increased by 181bp
yoy to 19.6% of sales. This resulted in the EBITDA margin contracting by 137bp
yoy to 8.1% (against our estimate of 9.1%). The weak performance was on account
of decline in high margin large engines business and on account of CSR expenses
that are being spread out evenly in each quarter this year against being incurred in
the last quarter of the previous year. There was an exceptional expense of `10.4cr
during the quarter related to the Voluntary Retirement Scheme (VRS). Adjusting for
the VRS expense, the net profit declined by 14.9% yoy to `29cr (against our
estimate of `34cr).
Exhibit 6: EBITDA margin
Exhibit 7: Net profit trend
EBITDA (LHS)
EBITDA Margin (RHS)
PAT (LHS)
yoy growth (RHS)
90
13.0
16.0
60
20.0
13.7
15.2
80
11.8
14.0
10.0
50
70
10.2
12.0
9.5
0.9
1.1
-
60
9.0
40
8.2
8.2
8.1
10.0
50
(10.0)
8.0
30
(10.6)
(14.9)
40
(16.1)
(20.0)
6.0
(24.1)
30
20
(24.7)
(30.0)
4.0
20
10
(40.0)
10
2.0
(46.7)
-
-
-
(50.0)
Source: Company, Angel Research
Source: Company, Angel Research
February 2, 2016
3
Kirloskar Oil Engines | 3QFY2016 Result Update
Conference Call Highlights
The Power Gen business was muted on account of overall sluggishness in the
market. Power deficit remained at sub-2% levels and the surge witnessed in
the last quarter on account of Telecom normalized in the current quarter. The
Management has guided that the power gen business’ performance will be
muted over the next few quarters.
There are more price cuts likely in the near future for lower KVA segments. As
for higher KVAs, 750KVAs (aiming at 10% market share) are performing well
and getting a favourable response. The company has set March as the date
for field launch of 1,000KVA gen sets. Its market share for higher KVA DV
series (250-750KVA) stands at ~25%.
Telecom is expected to see some traction over the next 12-18 months on back
of ~4,000 towers coming up (by 4G operators).
Power tillers remain a key monitorable in the near future with the company
having received approvals from the states of West Bengal, Odissa, Bihar and
Tamil Nadu and is awaiting disbursement of subsidy. An additional variant will
be launched to suit varying geographical needs.
The company has good standing in Middle East and Africa (market share of
~10% in Saudi Arabia and South Africa) and is exploring newer territories. It is
aiming for 20-30% growth in exports over the next few years. Export sales
were up by 23% yoy to `176cr.
The Industrial engines segment was flat during the quarter. Construction
equipment showed marginal growth while fluid handling is showing early
positive trend.
The Large engines business orders are in the negotiation phase, with finalizing
expected to take longer. We expect the company to report `70-80cr orders
from Defense and Marine in FY2016E and cross `100cr in FY2017E.
February 2, 2016
4
Kirloskar Oil Engines | 3QFY2016 Result Update
Investment arguments
Near term performance to be subdued; to improve over the
longer run
The generator set industry in general is facing headwinds on account of delay in
pickup in economic recovery. In the past, the industrial and infrastructure segment
witnessed persistent headwinds such as inflationary pressures, slow order inflows,
high interest rates and policy paralysis, which has resulted in slower execution and
dip in demand for gensets. The PowerGen segment accounts for ~45% of total
revenues and is currently impacted by the above mentioned reasons. Although the
recovery has been slower than expected, the expected improvement in the
economic scenario would impact KOEL positively as it has the necessary capacity
in place to cater to an improving scenario.
Debt free and cash rich company
KOEL is a debt free company with cash and cash equivalents of ~`835cr. With
ample capacity in place, there is no major capex expected in the near future.
Consequently depreciation expense is also expected to remain low which will add
to the bottom-line. We expect KOEL’s cash and cash equivalents to be at
~`1,038cr in FY2018E which is ~30% of the current market cap. This is on the
back of measures taken by the company to significantly reduce its debtor days
from 45 in FY2013 to 17 in FY2015.
Increasing focus on exports - a long term growth driver
In order to balance out any slowdown in the domestic economy, the company is
focusing on the export market. The company’s major export markets are Middle
East and Africa along with USA, Europe and South Asia/South East Asia. The
company is upping its focus on exports and plans to enter new markets while also
increasing its market share in existing markets. The company expects Middle East
and Africa to be larger contributors to the international business of the company
and is taking steps to increase its presence in USA and Europe where it has less of
a presence.
February 2, 2016
5
Kirloskar Oil Engines | 3QFY2016 Result Update
Financials
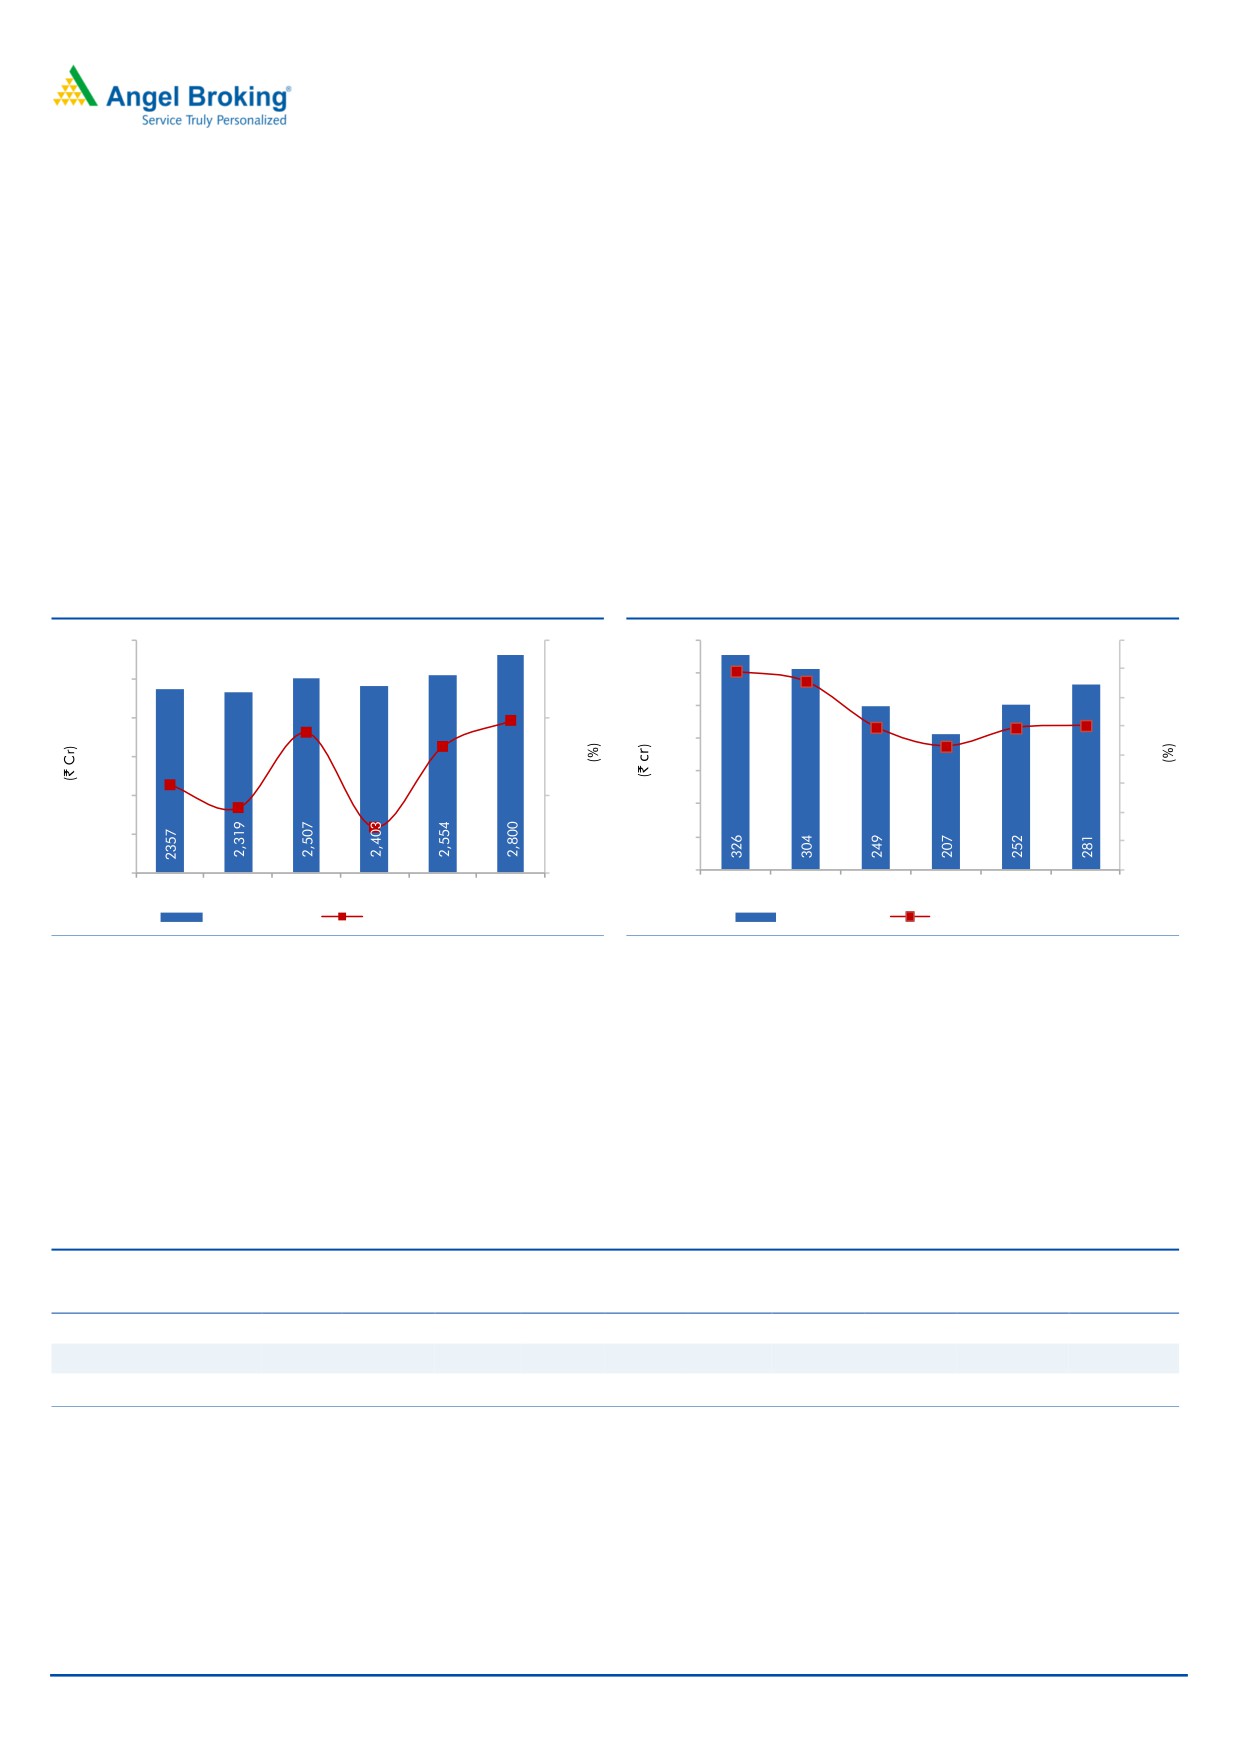
Slow recovery in top-line
On account of overall slowdown in the PowerGen and Industrial segment along
with absence of NPCIL orders in large engines segment, we expect the top-line to
regress in FY2016E and recover from FY2017E onwards. We expect the top-line to
post a CAGR of 3.8% over FY2105-18E to `2,800cr. The margins are expected to
remain under pressure for the current year on account of lower sales and on
account of some one-time expenses in the current year (shifting to Kagal plant and
consultancy fees). We expect the EBITDA margin to improve on account of
operating leverage and also due to higher-margin large engine orders coming in
FY2017E onwards.
Exhibit 8: Revenue growth to improve going forward
Exhibit 9: EBITDA margin to recover
3,000
20.0
350
16.0
13.8
13.1
300
10.0
14.0
2,500
9.9
9.9
12.0
250
2,000
10.0
9.6
8.6
10.0
8.1
200
6.3
1,500
8.0
150
1.3
6.0
1,000
-
(1.6)
100
4.0
(4.1)
500
50
2.0
-
(10.0)
-
-
FY2013
FY2014
FY2015
FY2016E FY2017E FY2018E
FY2013
FY2014
FY2015
FY2016E FY2017E FY2018E
Revenue (LHS)
Revenue growth (RHS)
EBITDA (LHS)
EBITDA Margin (RHS)
Source: Company, Angel Research
Source: Company, Angel Research
The depreciation expense is expected to be more of less flat as the company has
undertaken capacity expansion in the past to position itself to best cater to the
future uptick in demand. With no significant capex in sight, the negligible
depreciation expense increase is expected to add directly to the bottom-line. The
cash position is expected to remain strong and as per our estimates, the cash and
cash equivalents are expected to be at `1,038cr in FY2018E. On account of
operating leverage, the PAT for FY2018E is expected to improve to `175cr.
Exhibit 10: Relative valuation (FY2018E)
Mcap
Sales
OPM
PAT
EPS
ROE
P/E
P/BV EV/EBITDA
EV/ Sales
Company
(` cr)
(` cr)
(%)
(` cr)
(`)
(%)
(x)
(x)
(x)
(x)
KOEL
3,404
2,800
10.0
175
12.1
11.7
19.5
2.2
8.4
0.8
Cummins India
26,215
6,952
17.5
1,126
40.8
28.3
23.3
6.6
21.1
3.7
Greaves Cotton Consol.
3,119
2,293
16.5
253
10.4
22.7
12.3
2.8
6.9
1.1
Source: Bloomberg, Angel Research
Outlook and valuation: We expect KOEL’s revenue to recover post FY2016E to
`2,800cr in FY2018E. With recovery in top-line, we expect the EBITDA margin to
recover to 10.0% in FY2018E. Consequently the profit is expected to grow to
`175cr in FY2018E. At the current market price, the stock trades at 19.5x its
FY2018E earnings. We have a Neutral rating on the stock.
February 2, 2016
6
Kirloskar Oil Engines | 3QFY2016 Result Update
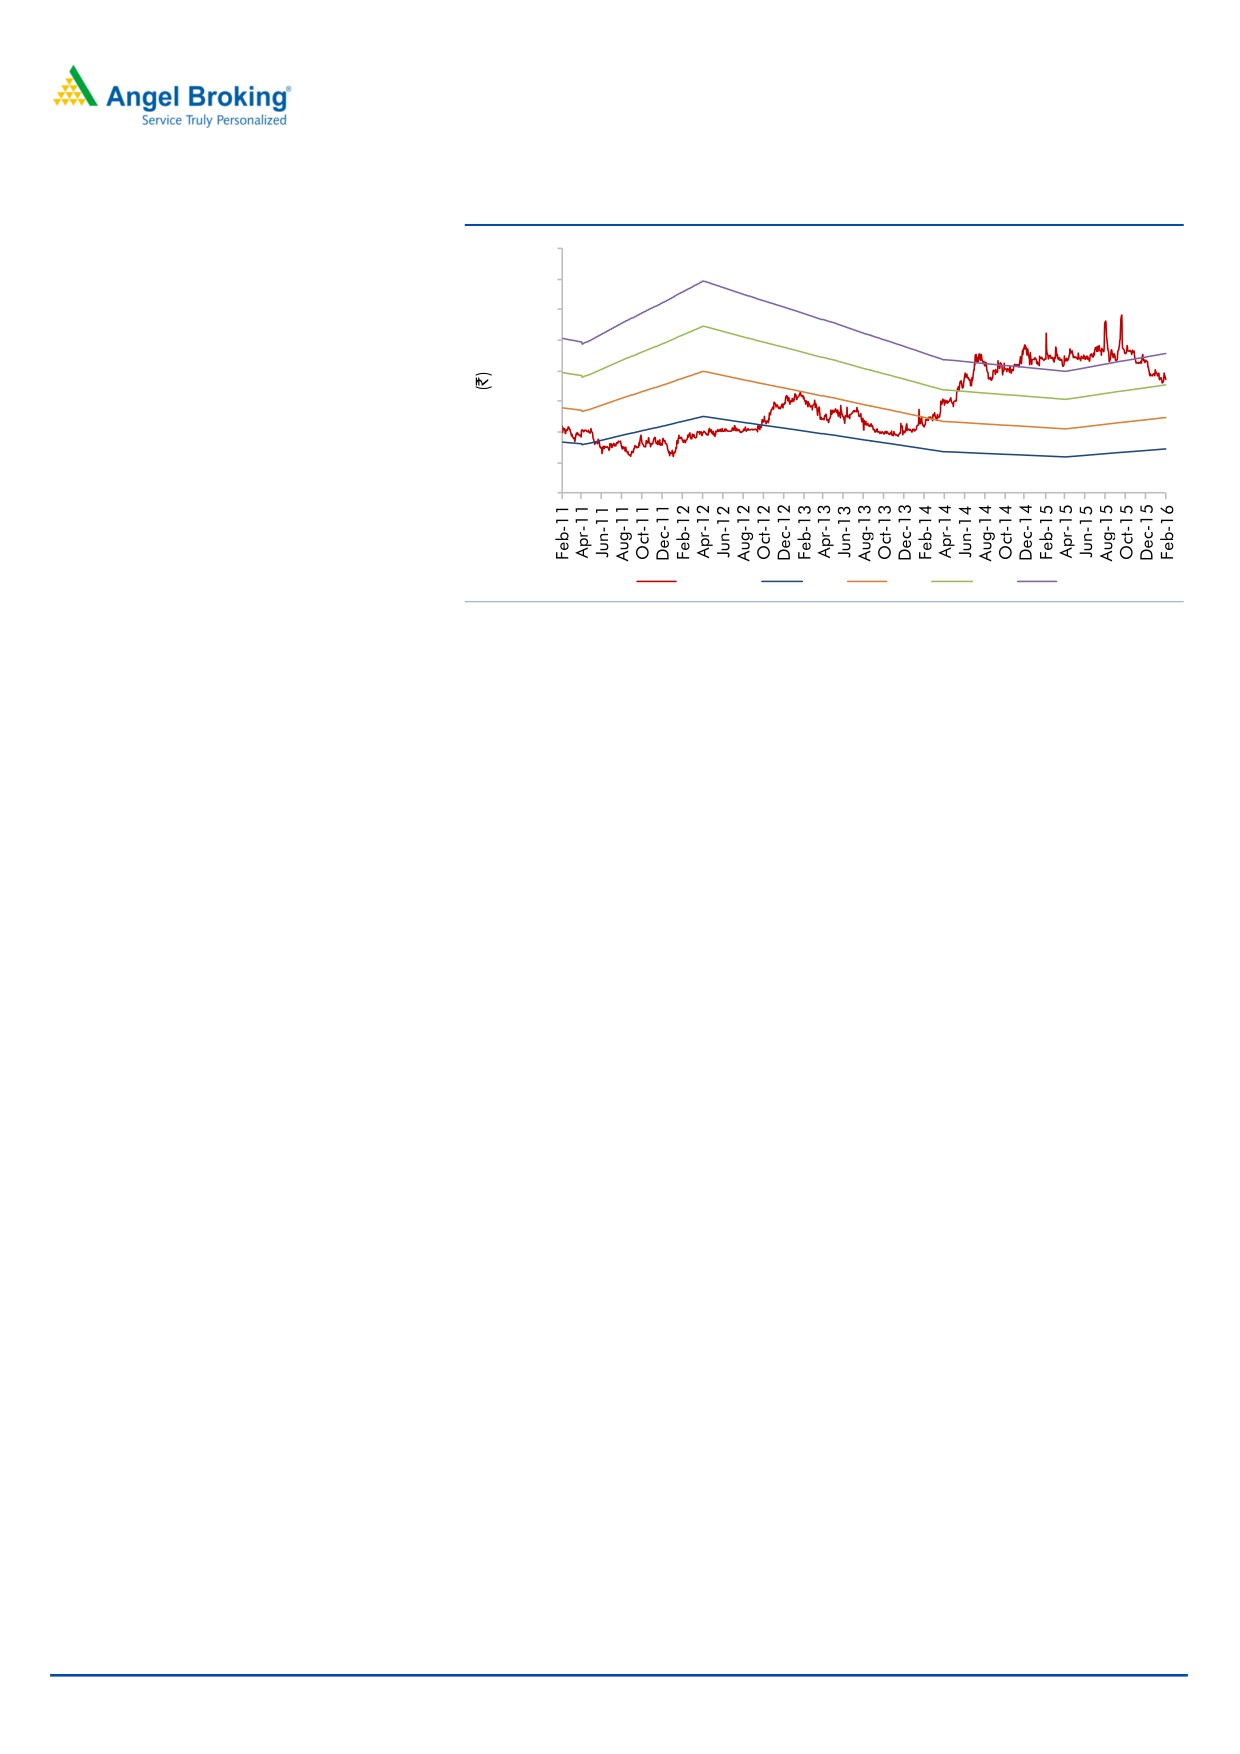
Exhibit 11: One-year forward P/E band
450
400
350
300
250
200
150
100
50
Price (`)
12x
17x
22x
27x
Source: Company, Angel Research
Concerns
Continued slowdown in the economy: Any continued slowdown will adversely
affect the company’s performance.
Surplus electricity scenario: Contracting demand supply gap will be an adverse
situation for the company to some extent.
Fluctuations in Steel price: Any substantial fluctuation in the steel price can lead to
margin compression of the company.
Increasing imports from China: Low cost Chinese imports will continue to pose a
threat to the company.
Company background
KOEL is the flagship company of the Kirloskar group, one of India’s largest
engineering conglomerates. It is one of the world’s largest generating set
manufacturers, specializing in manufacturing of both air-cooled and water-cooled
engines (2.5HP to 740HP) and diesel generating sets across a wide range of
power output from 5kVA to 3,000kVA. It has four manufacturing plants - at Kagal,
Pune, Nashik and Rajkot. It has a sizable presence in international markets, with
offices in Dubai, South Africa, and Kenya, and representatives in Indonesia and
Nigeria. KOEL also has a strong distribution network throughout the Middle East
and Africa. It caters to Power Generation, Agriculture and Industrial and machinery
sectors.
February 2, 2016
7
Kirloskar Oil Engines | 3QFY2016 Result Update
Profit and loss statement
Y/E March (` cr)
FY2014
FY2015
FY2016E
FY2017E
FY2018E
Total operating income
2,319
2,507
2,403
2,554
2,800
% chg
(1.6)
8.1
(4.1)
6.3
9.6
Net Raw Materials
1444
1626
1525
1613
1788
% chg
(0.2)
12.6
(6.2)
5.8
10.9
Power and Fuel
21
21
17
15
17
% chg
(9.0)
0.6
(18.5)
(8.9)
9.6
Personnel
163
188
201
199
210
% chg
(6.3)
15.9
6.5
(0.7)
5.4
Other
388
424
454
475
504
% chg
(0.3)
9.1
7.3
4.5
6.1
Total Expenditure
2015
2259
2197
2302
2519
EBITDA
304
249
207
252
281
% chg
(6.6)
(18.3)
(16.9)
21.9
11.5
(% of Net Sales)
13.1
9.9
8.6
9.9
10.0
Depreciation& Amortisation
98
102
106
113
122
EBIT
206
147
101
139
159
% chg
(11.7)
(28.8)
(31.1)
37.1
15.0
(% of Net Sales)
8.9
5.9
4.2
5.4
5.7
Interest & other Charges
0
0
0
0
0
Other Income
38
59
75
69
80
(% of Net Sales)
1.6
2.4
3.1
2.7
2.9
Recurring PBT
206
147
101
138
159
% chg
(11.1)
(28.8)
(31.1)
37.1
15.1
Exceptional Item
-
-
10
-
-
PBT (reported)
243
205
165
208
239
Tax
65
62
40
56
65
(% of PBT)
26.7
30.3
24.0
27.0
27.0
PAT (reported)
178
143
126
152
175
Extraordinary Expense/(Inc.)
-
-
7
-
-
ADJ. PAT
178
143
133
152
175
% chg
(15.9)
(19.8)
(7.2)
14.2
15.2
(% of Net Sales)
7.7
5.7
5.5
5.9
6.2
Basic EPS (`)
12.3
9.9
9.2
10.5
12.1
Fully Diluted EPS (`)
12.3
9.9
9.2
10.5
12.1
% chg
(15.9)
(19.8)
(7.2)
14.2
15.2
February 2, 2016
8
Kirloskar Oil Engines | 3QFY2016 Result Update
Balance sheet
Y/E Mar. (` cr)
FY2014
FY2015
FY2016E
FY2017E
FY2018E
SOURCES OF FUNDS
Equity Share Capital
29
29
29
29
29
Reserves& Surplus
1,238
1,313
1,358
1,423
1,511
Shareholders’ Funds
1,267
1,341
1,387
1,452
1,540
Total Loans
-
-
-
-
-
Other Long Term Liabilities
13
17
17
17
17
Long Term Provisions
25
24
24
24
24
Deferred Tax (Net)
30
29
29
29
29
Total liabilities
1,335
1,412
1,457
1,522
1,610
APPLICATION OF FUNDS
Gross Block
1,179
1,249
1,339
1,442
1,541
Less: Acc. Depreciation
636
736
841
955
1,076
Net Block
543
514
498
487
465
Capital Work-in-Progress
42
21
22
13
14
Goodwill
-
-
-
-
-
Investments
608
876
824
824
824
Long Term Loans and adv.
96
108
108
108
108
Other Non-current asset
29
32
32
32
32
Current Assets
534
381
473
582
739
Cash
52
25
43
107
214
Loans & Advances
102
100
101
107
118
Inventory
167
172
180
211
238
Debtors
177
53
119
126
138
Other current assets
35
31
31
31
31
Current liabilities
516
521
500
524
573
Net Current Assets
18
(140)
(26)
58
167
Misc. Exp. not written off
-
-
-
-
-
Total Assets
1,335
1,412
1,457
1,522
1,610
February 2, 2016
9
Kirloskar Oil Engines | 3QFY2016 Result Update
Cash flow statement
Y/E Mar. (` cr)
FY2014
FY2015
FY2016E
FY2017E
FY2018E
Profit before tax
243
205
173
208
239
Depreciation
98
102
106
113
122
Change in Working Capital
122
131
(96)
(20)
(1)
Direct taxes paid
(65)
(64)
(40)
(56)
(65)
Others
(60)
(35)
(75)
(69)
(80)
Cash Flow from Operations
338
339
67
175
216
(Inc.)/Dec. in Fixed Assets
(61)
(49)
(90)
(94)
(101)
(Inc.)/Dec. in Investments
(190)
(269)
53
-
-
(Incr)/Decr In LT loans & adv.
(33)
(16)
-
-
-
Others
59
52
75
69
80
Cash Flow from Investing
(224)
(282)
37
(24)
(21)
Issue of Equity
-
-
-
-
-
Inc./(Dec.) in loans
-
4
-
-
-
Dividend Paid (Incl. Tax)
(85)
(87)
(87)
(87)
(87)
Others
(1)
(1)
-
-
-
Cash Flow from Financing
(86)
(84)
(87)
(87)
(87)
Inc./(Dec.) in Cash
28
(27)
17
64
108
Opening Cash balances
25
52
25
43
107
Closing Cash balances
52
25
43
107
214
February 2, 2016
10
Kirloskar Oil Engines | 3QFY2016 Result Update
Key ratios
Y/E Mar.
FY2014
FY2015
FY2016E
FY2017E
FY2018E
Valuation Ratio (x)
P/E (on FDEPS)
19.1
23.8
25.6
22.4
19.5
P/CEPS
12.3
13.9
14.3
12.8
11.5
P/BV
2.7
2.5
2.5
2.3
2.2
EV/Net sales
1.2
1.0
1.1
1.0
0.8
EV/EBITDA
9.0
10.1
12.3
9.8
8.4
EV / Total Assets
2.1
1.8
1.8
1.7
1.5
Per Share Data (`)
EPS (Basic)
12.3
9.9
9.2
10.5
12.1
EPS (fully diluted)
12.3
9.9
9.2
10.5
12.1
Cash EPS
19.1
16.9
16.5
18.3
20.5
DPS
5.0
5.0
5.0
5.0
5.0
Book Value
87.6
92.8
95.9
100.4
106.5
Returns (%)
ROCE (Pre-tax)
16.4
10.9
7.2
9.5
10.4
Angel ROIC (Pre-tax)
30.8
27.6
20.2
25.4
29.6
ROE
14.7
11.0
9.7
10.7
11.7
Turnover ratios (x)
Asset TO (Gross Block)
2
2
2
2
2
Inventory / Net sales (days)
28
25
27
28
29
Receivables (days)
37
17
18
18
18
Payables (days)
92
84
83
83
83
WC cycle (ex-cash) (days)
4
(15)
(18)
(8)
(6)
Solvency ratios (x)
Net debt to equity
(0.5)
(0.7)
(0.6)
(0.6)
(0.7)
Net debt to EBITDA
(2.2)
(3.6)
(4.2)
(3.7)
(3.7)
Int. Coverage (EBIT/ Int.)
686.5
733.5
505.5
692.9
797.2
February 2, 2016
11
Kirloskar Oil Engines | 3QFY2016 Result Update
Research Team Tel: 022 - 39357800
DISCLAIMER
Angel Broking Private Limited (hereinafter referred to as “Angel”) is a registered Member of National Stock Exchange of India Limited,
Bombay Stock Exchange Limited and Metropolitan Stock Exchange of India Limited. It is also registered as a Depository Participant with
CDSL and Portfolio Manager with SEBI. It also has registration with AMFI as a Mutual Fund Distributor. Angel Broking Private Limited is
a registered entity with SEBI for Research Analyst in terms of SEBI (Research Analyst) Regulations, 2014 vide registration number
INH000000164. Angel or its associates has not been debarred/ suspended by SEBI or any other regulatory authority for accessing
/dealing in securities Market. Angel or its associates including its relatives/analyst do not hold any financial interest/beneficial
ownership of more than 1% in the company covered by Analyst. Angel or its associates/analyst has not received any compensation /
managed or co-managed public offering of securities of the company covered by Analyst during the past twelve months. Angel/analyst
has not served as an officer, director or employee of company covered by Analyst and has not been engaged in market making activity
of the company covered by Analyst.
This document is solely for the personal information of the recipient, and must not be singularly used as the basis of any investment
decision. Nothing in this document should be construed as investment or financial advice. Each recipient of this document should
make such investigations as they deem necessary to arrive at an independent evaluation of an investment in the securities of the
companies referred to in this document (including the merits and risks involved), and should consult their own advisors to determine
the merits and risks of such an investment.
Reports based on technical and derivative analysis center on studying charts of a stock's price movement, outstanding positions and
trading volume, as opposed to focusing on a company's fundamentals and, as such, may not match with a report on a company's
fundamentals.
The information in this document has been printed on the basis of publicly available information, internal data and other reliable
sources believed to be true, but we do not represent that it is accurate or complete and it should not be relied on as such, as this
document is for general guidance only. Angel Broking Pvt. Limited or any of its affiliates/ group companies shall not be in any way
responsible for any loss or damage that may arise to any person from any inadvertent error in the information contained in this report.
Angel Broking Pvt. Limited has not independently verified all the information contained within this document. Accordingly, we cannot
testify, nor make any representation or warranty, express or implied, to the accuracy, contents or data contained within this document.
While Angel Broking Pvt. Limited endeavors to update on a reasonable basis the information discussed in this material, there may be
regulatory, compliance, or other reasons that prevent us from doing so.
This document is being supplied to you solely for your information, and its contents, information or data may not be reproduced,
redistributed or passed on, directly or indirectly.
Neither Angel Broking Pvt. Limited, nor its directors, employees or affiliates shall be liable for any loss or damage that may arise from
or in connection with the use of this information.
Note: Please refer to the important ‘Stock Holding Disclosure' report on the Angel website (Research Section). Also, please refer to the
latest update on respective stocks for the disclosure status in respect of those stocks. Angel Broking Pvt. Limited and its affiliates may
have investment positions in the stocks recommended in this report.
Disclosure of Interest Statement
Kirloskar Oil Engines
1. Analyst ownership of the stock
No
2. Angel and its Group companies ownership of the stock
No
3. Angel and its Group companies' Directors ownership of the stock
No
4. Broking relationship with company covered
No
Note: We have not considered any Exposure below ` 1 lakh for Angel, its Group companies and Directors
Ratings (Based on expected returns
Buy (> 15%)
Accumulate (5% to 15%)
Neutral (-5 to 5%)
over 12 months investment period):
Reduce (-5% to -15%)
Sell (< -15)
February 2, 2016
12