Initiating Coverage | Banks
March 31, 2017
Karur Vysya Bank
BUY
CMP
`110
Easing troubles to pave way for growth
Target Price
`140
Karur Vysya Bank (KVB) is one of the oldest private sector banks with strong presence in
Investment Period
12 Months
the Southern parts of India. More than 53% of KVB’s 706 branches are located in
Tamil Nadu, however it is gradually branching out in other parts of India also.
Stock Info
Sector
Banks
Loan growth trajectory should pick up: KVB’s loan book reported a healthy CAGR
of 17% over FY2011-16. However, FY2017 has been a lackluster year so far with loan
Market Cap (` cr)
6,730
growth of only 3.3%. Nevertheless, we expect the growth trajectory to pick up from
Beta
0.5
FY2018 onwards. While the bank is still largely dependent upon corporate loans for its
52 Week High / Low
112/80
growth, it has been scaling up its presence in the retail loans segment gradually. Retail
Avg. Daily Volume
150,460
as a % of total loans has gone up to 16% at the end of 3QFY17 as compared to 8% in
FY2012, and this is likely to see further improvement in the years to come.
Face Value (`)
2
BSE Sensex
29,647
Fairly stable deposit growth further boosted by demonetization: KVB’s deposits
have reported a healthy 15.2% CAGR over FY2011-16. The growth in deposits
Nifty
9,174
got a further boost owing to demonetization. During demonetization the bank
Reuters Code
KARU.BO
received strong flows in the low cost CASA base and the share of CASA in total
Bloomberg Code
KVB@IN
deposits thus went up to 30.8% at the end of 3QFY2017 v/s 23.3% in FY2016
end. Though incrementally the growth in CASA could taper down, we expect
overall deposits to grow at a CAGR of 9% over FY2017-19.
Shareholding Pattern (%)
Asset quality issues to subside gradually: KVB had maintained a fairly stable asset
Promoters
2.1
quality in a challenging economic environment, however prolonged slowdown in the
MF / Banks / Indian Fls
28.9
core sector took a toll on its asset quality and GNPAs went up from 1.30% (FY2016)
FII / NRIs / OCBs
19.8
to 2.66% at the end of 3QFY2017, while NNPAs went up to 1.68% v/s 0.55% over
Indian Public / Others
49.3
the same period. We expect NPAs issues to subside in the quarters to come.
Moderate credit costs will lead to earnings pick up and gradual recovery in RoE:
Historically KVB had maintained a moderate credit cost of 40-45 bps, which
Abs.(%)
3m 1yr 3yr
jumped in FY2014/15 to 130/133 bps. However, it has moderated subsequently
Sensex
11.3
17.0
32.7
and we expect this to further moderate to 70 bps by FY2019. Lower incremental
KVB
35.0
28.6
52.1
slippages, pick up in business growth and moderate credit cost should help
earnings to grow by 12% & 26 % in FY2018 &19 respectively.
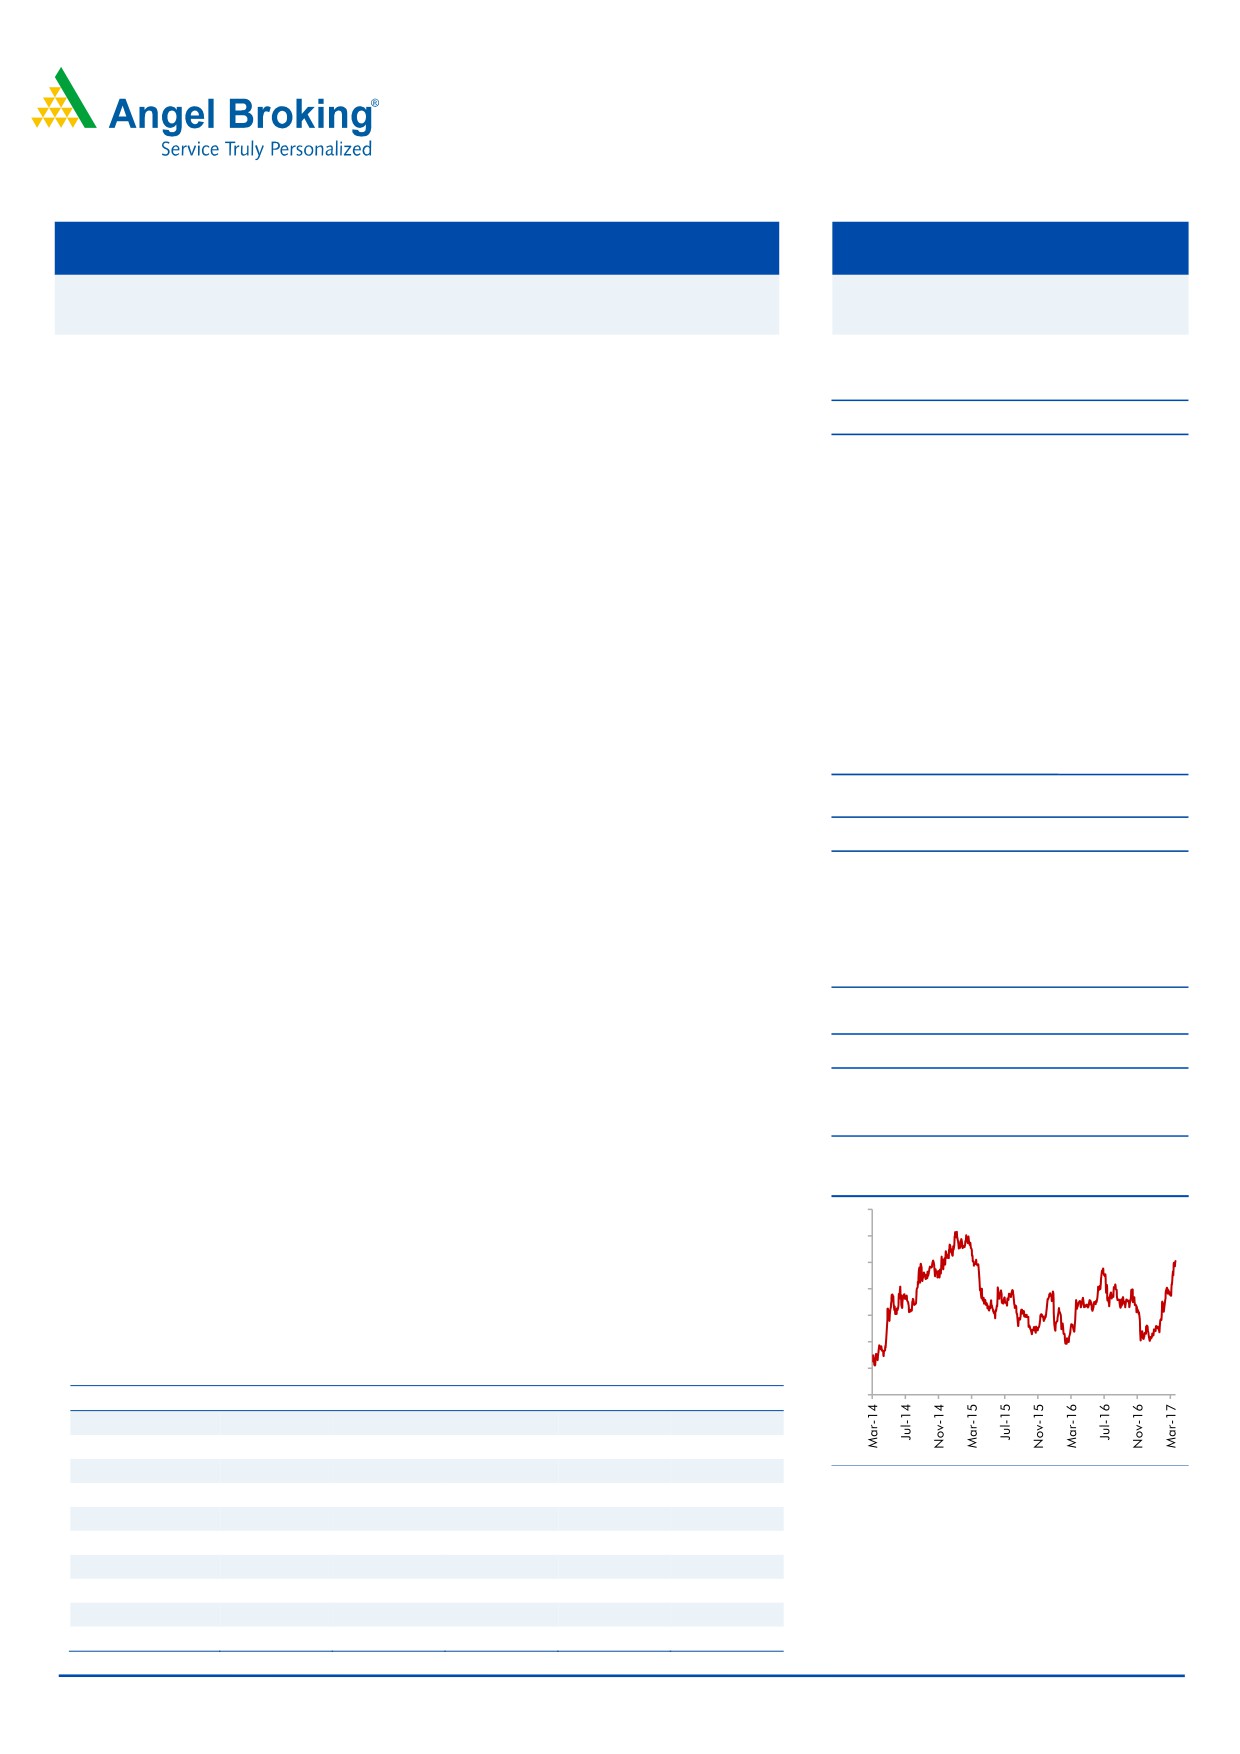
3-year price chart
Outlook and valuation: KVB’s earnings were impacted due to higher provisions
130
and lower business growth, however, we expect gradual recovery on both the
120
fronts going ahead. While in FY2018 we expect earnings recovery to be visible,
110
sharp growth is expected in FY2019. At the CMP the stock is trading at 1.1x it’s
100
FY2019 BV. We have valued the stock at 1.4x its FY2019E BV and recommend
90
BUY with a Target Price of `140 over the next 12 months.
80
70
Key financials (Standalone)
60
Y/E March (` cr)
FY2015
FY2016
FY2017E
FY2018E
FY2019E
NII
1,466
1,781
2,010
2,182
2,532
% chg
14.2
21.5
12.8
8.6
16.1
Net profit
455
568
545
608
768
Source: Company, Angel Research
% chg
6.0
24.7
(4.0)
11.5
26.5
NIM (%)
2.8
3.2
3.3
3.2
3.4
EPS (`)
7.5
9.3
8.9
10.0
12.6
P/E (x)
14.7
11.8
12.3
11.0
8.7
P/ABV (x)
1.6
1.5
1.3
1.2
1.1
Siddharth Purohit
RoA (%)
0.9
1.0
0.9
0.9
1.0
022 - 3935 7800 Ext: 6828
RoE (%)
12.0
12.9
11.2
11.4
13.2
Source: Company, Angel Research; Note: CMP as of March 30, 2017
Please refer to important disclosures at the end of this report
1
Karur Vysya Bank | Initiating Coverage
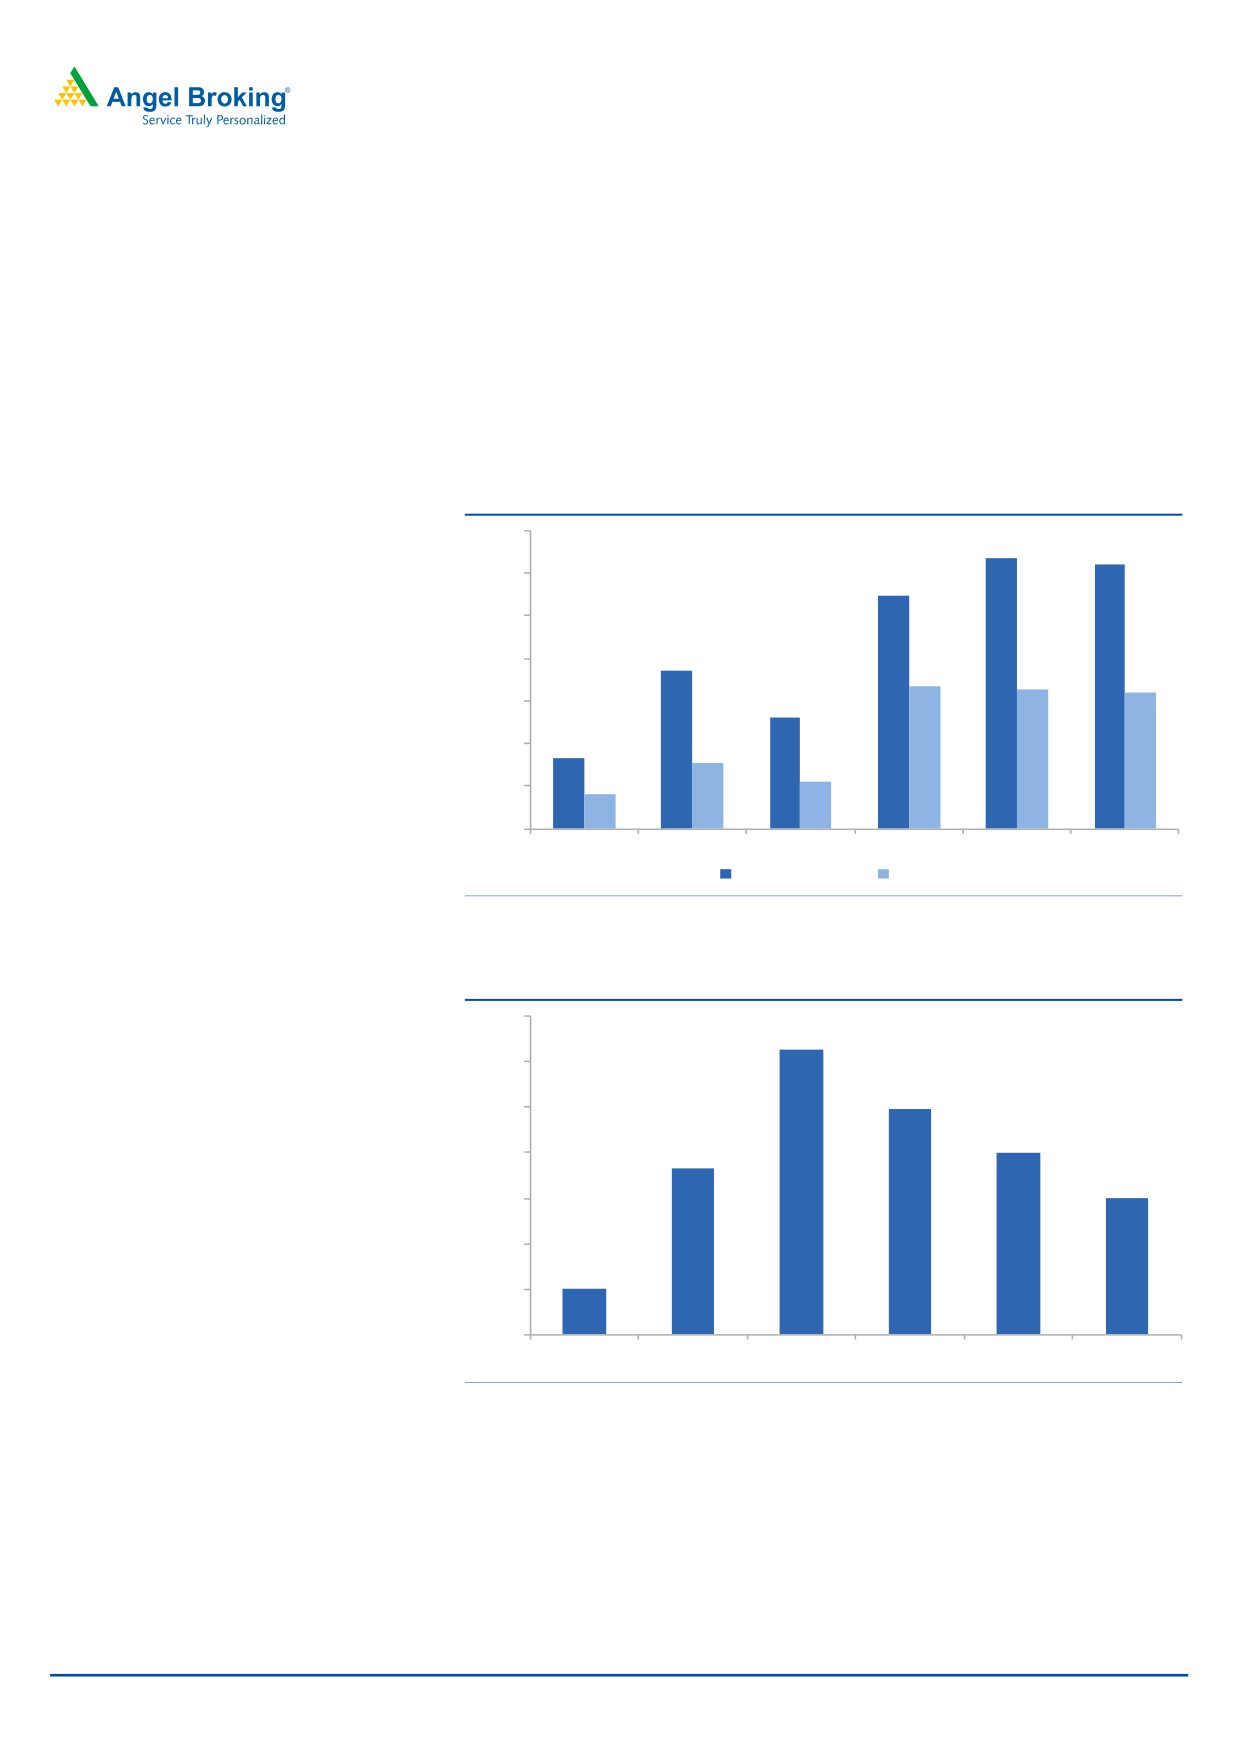
Loan growth remained moderate over the last few years,
likely to see revival from FY2018
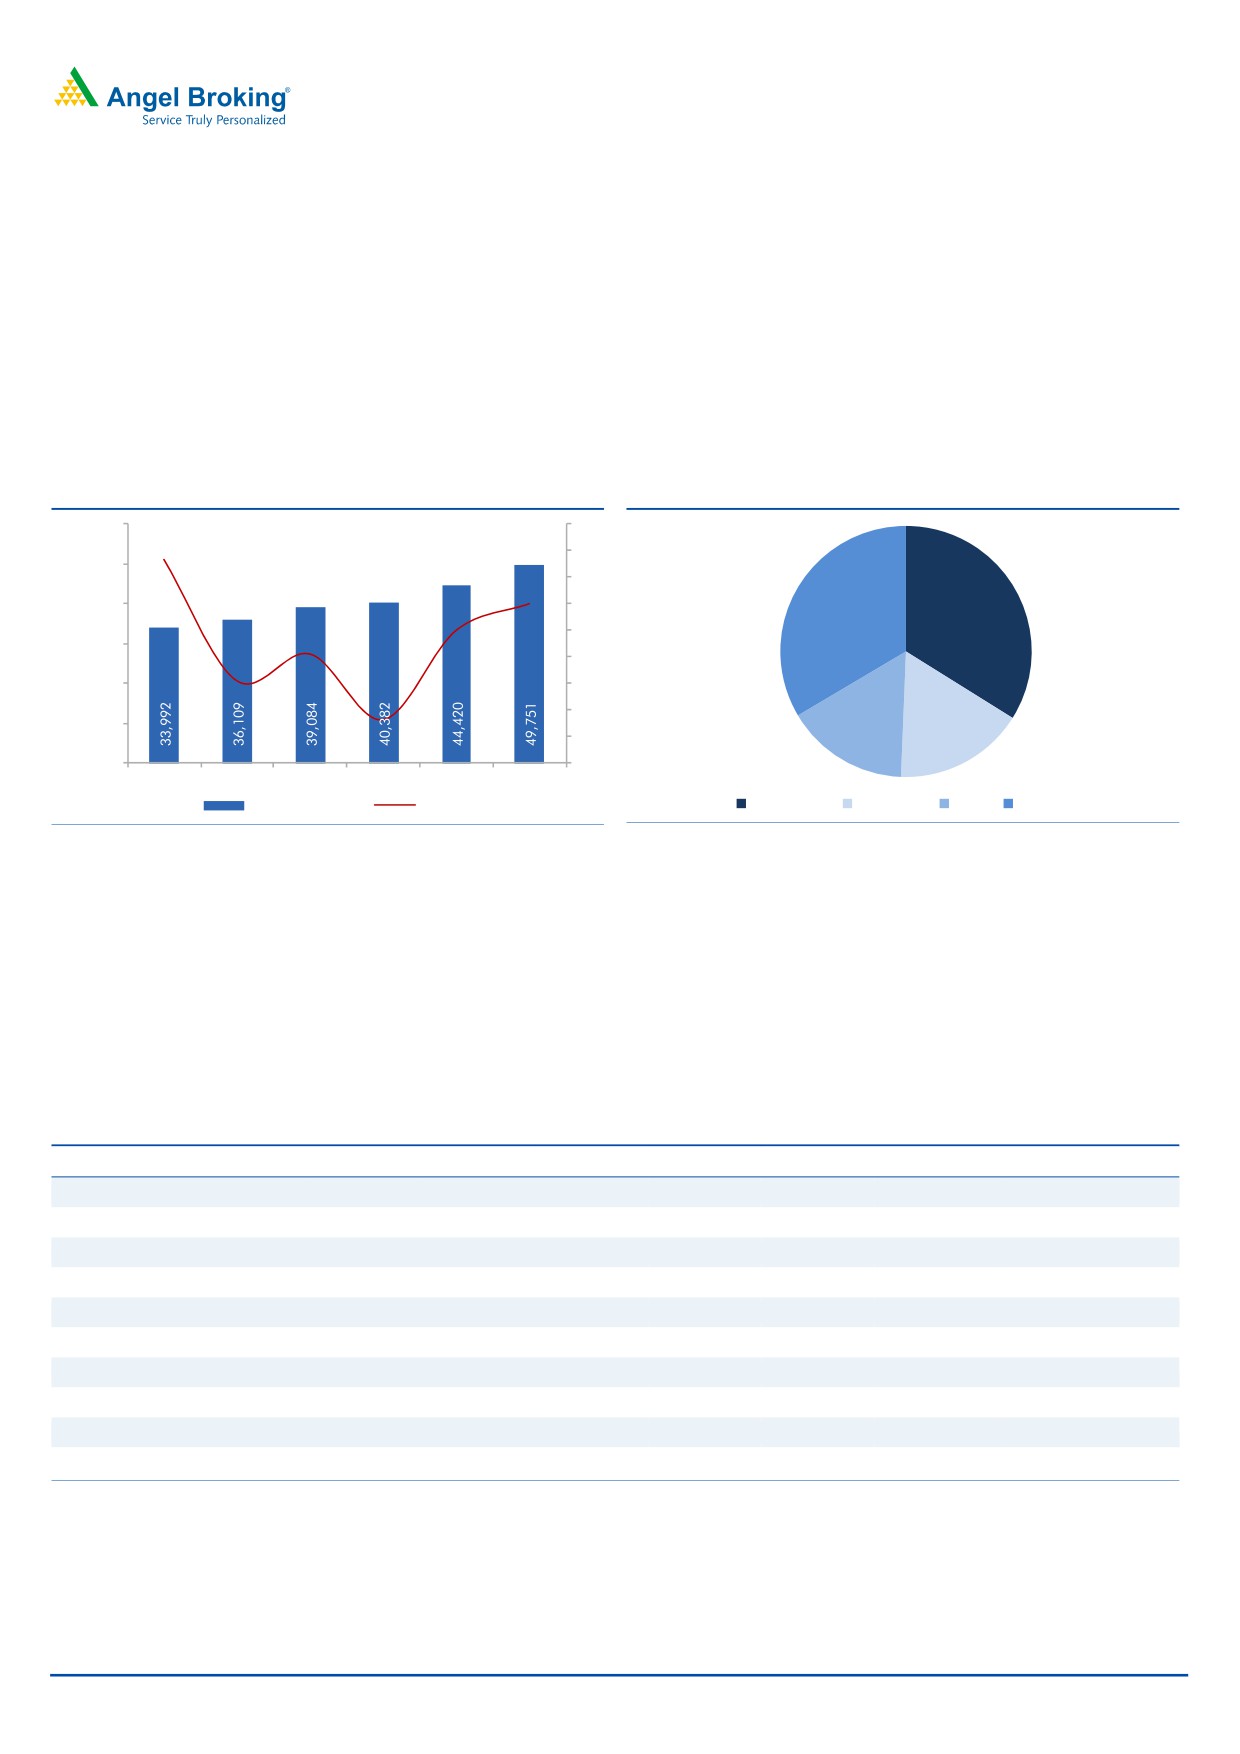
KVB’s loan book reported a healthy CAGR of 17% over FY2011-16. However,
FY2017 has been a lackluster year so far with loan growth of only 3.3%. Too much
reliance on the corporate side has impacted the growth of the bank in the recent
quarters, as incremental demand from corporate segment has been muted due to
the lack of fresh capex. Further, looking at the stress in asset quality, the
management has further slowed down the loan book expansion.
Exhibit 1: Loan growth has remained moderate
Exhibit 2: Loan Bifurcation Segmemnt wise %
60,000
18
16
50,000
15.3
14
12.0
40,000
12
34%
34%
10.0
10
30,000
8.2
8
20,000
6.2
6
4
10,000
3.3
2
16%
17%
-
0
FY14
FY15
FY16
FY17E
FY18E
FY19E
Advances (` cr)
Growth (%)
Commercial
Agriculture
Retail
Corporates
Source: Company, Angel Research
Source: Company, Angel Research
While the bank is still largely dependent upon corporate loans for its growth, it has
been scaling up its presence in the retail loans segment gradually. Retail as a % of
total loans has gone up to 16% at the end of 3QFY17 as compared to 8% in
FY2012, and this is likely to see further improvement in the years to come. Further,
political instability in its home state Tamil Nadu also had been one of the key
reasons for the lack of credit growth, however with stability in Government now,
investments should revive, leading to better credit off take.
Exhibit 3: Advances Bifurcation Segment Wise
Segment Wise (` Cr)
FY12
FY13
FY14
FY15
FY16
3QFY17
CAGR 12-16 (%)
Advances
23,949
29,480
33,992
36,691
39,476
38,460
13.3
Commercial
8,231
9,513
11,217
11,774
12,764
13,035
11.6
Agriculture
3,807
5,386
6,119
6,240
7,032
6,442
16.6
Retail
1,976
3,502
4,079
5,274
5,918
6,093
31.6
Corporates
10,191
11,079
12,577
13,402
13,764
12,890
7.8
Segment Wise (%)
Commercial
34
32
33
32
32
34
Agriculture
16
18
18
17
18
17
Retail
8
12
12
14
15
16
Corporate
43
38
37
37
35
34
Source: Company, Angel Research
March 31, 2017
2
Karur Vysya Bank | Initiating Coverage
Exhibit 4: Advances Category Wise (` Cr )
FY12
FY13
FY14
FY15
FY16
3QFY17
CAGR 12-16 (%)
Manufacturing Sector
9,390
10,260
12,026
12,558
13,688
12,627
9.9
Jewel Loan
5,200
7,798
8,006
7,060
6,282
6,094
4.8
Personal Loan Segment
3,077
3,745
4,141
4,743
5,310
5,364
14.6
Trading
2,576
4,035
3,909
4,812
5,771
5,783
22.3
Bills
1,292
1,558
2,112
2,010
1,352
1,118
1.1
NBFC
1,255
1,116
833
968
975
1,041
(6.1)
Other Exposure
1,415
1,194
3,399
4,540
6,076
6,433
44.0
Total Advances
24,205
29,706
34,426
36,691
39,454
38,460
13.0
Source: Company, Angel Research
Exhibit 5: Manufacturing Sector Break Up (` Cr)
FY12
FY13
FY14
FY15
FY16
3QFY17
CAGR 12-16 (%)
Textiles
1,777
2,057
2,595
2,771
3,515
3,423
18.6
Infrastructure
2,984
2,948
3,164
3,422
3,354
2,751
3.0
Food Processing
863
1,010
1,134
1,317
1,282
1,302
10.4
Basic Metal & Metal Products
1,154
1,438
1,597
1,459
1,225
1,247
1.5
Chemicals & Chemicals Products
494
473
719
641
720
488
9.9
All Engineering
270
386
424
499
433
441
12.5
Transport Equipments
256
214
313
380
368
393
9.5
Cement & Cement Products
95
92
91
81
375
379
41.0
Gems & Jewellery
217
252
366
378
342
371
12.0
Other Industries
1,280
1,390
1,623
1,610
2,019
1,832
12.1
Total Industry Exposure
9,390
10,260
12,026
12,558
13,633
12,627
9.8
Source: Company, Angel Research
KVB has a strong presence in the Textile belt of Coimbatore-Karur-Tirupur region
and has strong relationships with the local textile manufactuers. Textile loans
account for ~27% of the bank’s manufcaturing sector loan book and ~9% of the
total loan book, and has reported a 18.6% CAGR over FY2012-16. In the near
term the Indian textile manufcaturers are seeing some moderation in growth due
to the overall slow down in the developed countries, which are their export
destinations. However, Indian textile industry remains quite competitive and is likley
to bounce back, which should aid the loan growth for the bank.
Exhibit 6: Comparative Loan Book (` Cr)
Company
FY11
FY12
FY13
FY14
FY15
FY16
CAGR 5Yr (%)
KVB
17,814
23,949
29,480
33,992
36,109
39,084
17.0
LVB
8,094
10,189
11,703
12,889
16,352
19,644
19.4
Federal Bank
31,953
37,756
44,097
43,436
51,285
58,090
12.7
City Union Bank
9,255
12,137
15,246
16,097
17,966
21,057
17.9
Karnataka Bank
17,348
20,721
25,208
28,345
31,680
33,902
14.3
DCB
4,271
5,284
6,586
8,140
10,465
12,921
24.8
South Indian Bank
20,489
27,281
31,816
36,230
37,392
41,086
14.9
Source: Company, Angel Research
March 31, 2017
3
Karur Vysya Bank | Initiating Coverage
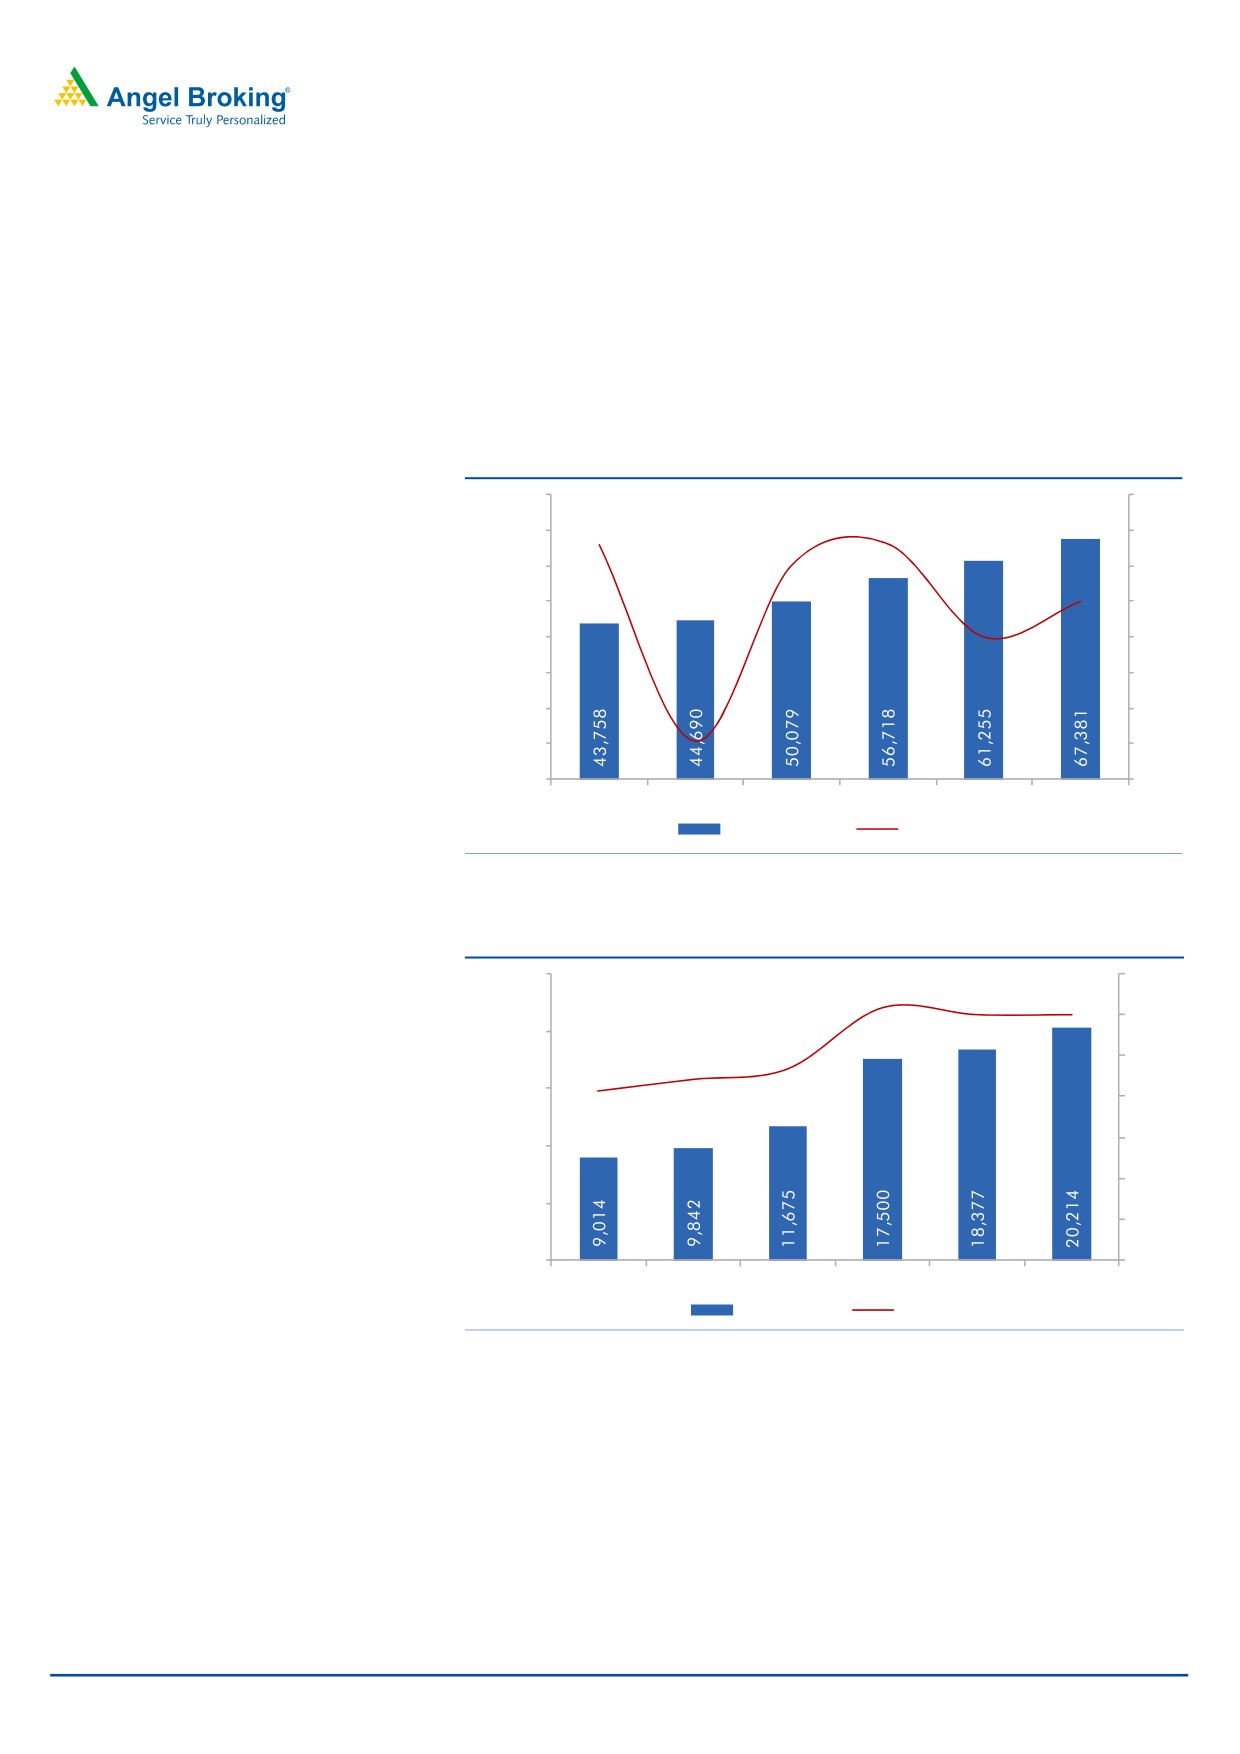
Fairly stable deposit growth further boosted by demonetization
KVB’s deposits have reported a healthy 15.2% CAGR over FY2011-16. The growth in
deposits got a further boost owing to demonetization. During demonetization the bank
received strong flows in the low cost CASA base and the share of CASA in total
deposits thus went up to 30.8% at the end of 3QFY2017 v/s 23.3% in FY2016 end.
Though incrementally the growth in CASA could taper down, we expect
overall
deposits to grow at a CAGR of 9% over FY2017-19.
Exhibit 7: Deposit growth has been fairly strong
80,000
16.0
13.2
13.3
70,000
14.0
12.1
60,000
12.0
10.0
50,000
10.0
8.0
40,000
8.0
30,000
6.0
20,000
4.0
2.1
10,000
2.0
-
0.0
FY14
FY15
FY16
FY17E
FY18E
FY19E
Deposits (` cr)
Growth (%)
Source: Company, Angel Research
Exhibit 8: Deposits got a boost backed by CASA
25,000
35.0
30.9
30.0
30.0
30.0
20,000
23.3
22.0
25.0
20.6
15,000
20.0
15.0
10,000
10.0
5,000
5.0
-
-
FY14
FY15
FY16
FY17E
FY18E
FY19E
CASA (` cr)
CASA (%)
Source: Company, Angel Research
March 31, 2017
4
Karur Vysya Bank | Initiating Coverage
Exhibit 9: Comparative Deposit Growth
Deposits (` Cr)
FY11
FY12
FY13
FY14
FY15
FY16
CAGR 5 Yr (%)
KVB
24,722
32,112
38,653
43,758
44,690
50,079
15.2
LVB
11,150
14,114
15,619
18,573
21,964
25,431
17.9
Federal Bank
43,015
48,937
57,615
59,731
70,825
79,172
13.0
City Union Bank
12,914
16,341
20,305
22,017
24,075
27,158
16.0
Karnataka Bank
27,336
31,608
36,056
40,583
46,009
50,488
13.1
DCB
5,610
6,336
8,364
10,325
12,609
14,926
21.6
South Indian Bank
29,721
36,501
44,262
47,491
51,912
55,721
13.4
Source: Company, Angel Research
Exhibit 10: Low Cost Deposits of comparative banks
CASA (%)
FY11
FY12
FY13
FY14
FY15
FY16
KVB
23.3
19.2
19.2
20.6
22.0
23.3
LVB
18.8
14.9
14.5
14.2
16.7
17.4
Federal Bank
26.9
27.5
0.0
30.8
30.4
32.5
City Union Bank
19.6
18.2
16.8
17.8
19.2
20.4
Karnataka Bank
24.9
24.6
24.9
25.4
24.9
26.3
DCB
35.2
32.1
27.2
25.0
23.4
23.4
South Indian Bank
21.5
19.7
18.6
20.7
20.6
22.4
Source: Company, Angel Research
March 31, 2017
5
Karur Vysya Bank | Initiating Coverage
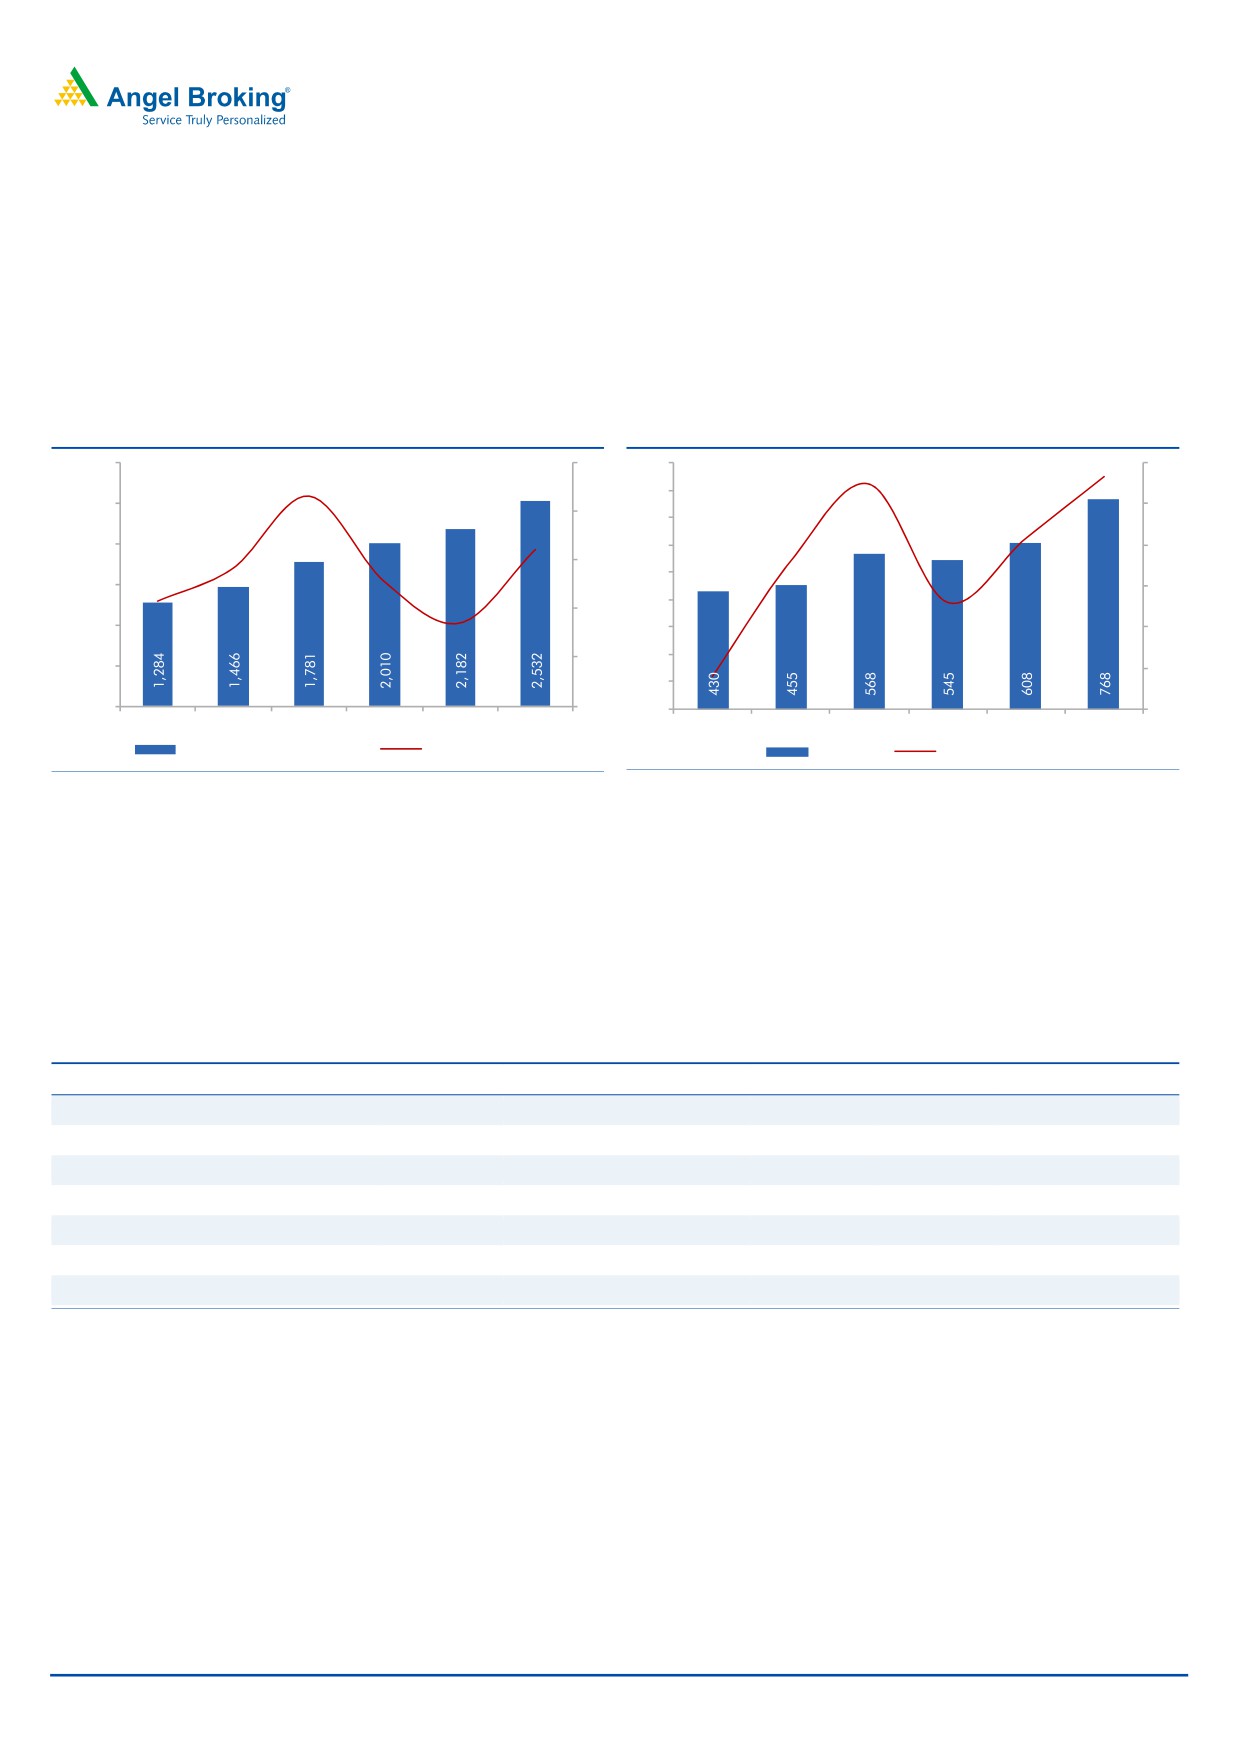
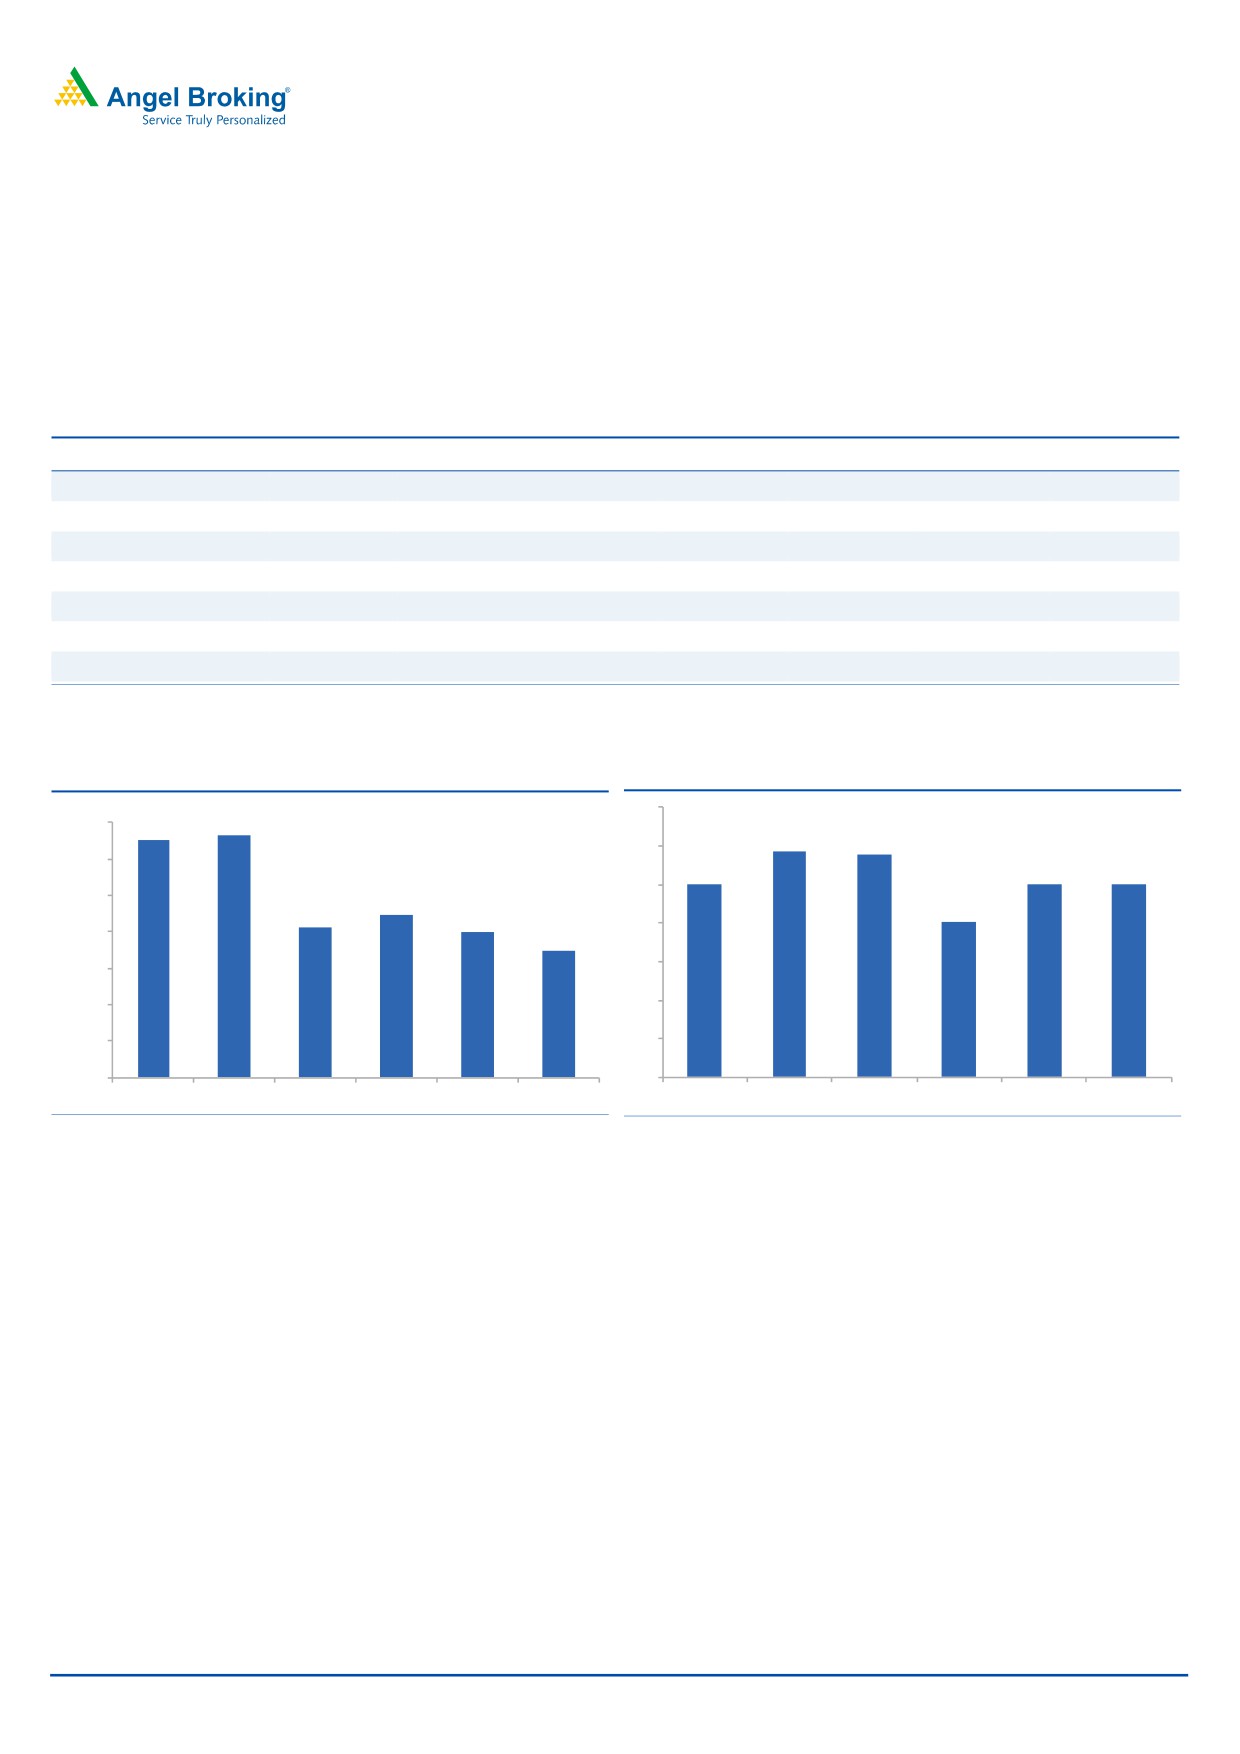
Strong NII growth was cost dented by higher operating and
credit costs, which should normalize over the next few years
KVB’s NII has grown at 18.4% CAGR over FY2011-16 backed by a 17% CAGR in
loan book. However, FY2017 has been a year of consolidation for the bank and
we expect FY2017 to end with 12.8% growth in NII, however, we expect that it
would pick up from FY2018 onwards.
Exhibit 11: NII Growth trend
Exhibit 12: PAT growth trend
3,000
25
900
24.7
26.5
30
21.5
800
2,500
20
20
700
11.5
16.1
2,000
14.2
600
6.0
10
15
12.8
500
10.8
(4.0)
1,500
0
8.6
400
10
1,000
300
-10
5
200
(22.0)
500
-20
100
-
0
0
-30
FY14
FY15
FY16
FY17E
FY18E
FY19E
FY14
FY15
FY16
FY17E
FY18E
FY19E
Net Interest Income (` cr)
YoY Growth (%)
PAT (` cr)
YoY Growth (%)
Source: Company, Angel Research
Source: Company, Angel Research
As shown in the below table KVB’s NII growth has been quite robust reporting
18.4% CAGR over FY2011-16 and is very much comparable to its peers. However,
as mentioned earlier higher operating costs and credit costs took a toll on the
earnings growth of the bank, which has reported a CAGR of 6.4% over the same
period. However, with credit cost coming under control we expect the bank’s
bottom-line growth to outpace the NII growth over the next two years.
Exhibit 13: Comparative NII Growth
NII (` Cr)
FY11
FY12
FY13
FY14
FY15
FY16
CAGR 5 Yr (%)
KVB
767
917
1,158
1,284
1,466
1,781
18.4
LVB
365
371
392
486
527
645
12.1
Federal Bank
1,747
1,953
1,975
2,229
2,380
2,504
7.5
City Union Bank
420
500
624
759
807
981
18.5
Karnataka Bank
612
744
904
1,056
1,169
1,303
16.3
DCB
189
228
284
368
508
620
26.8
South Indian Bank
791
1,022
1,281
1,399
1,366
1,510
13.8
Source: Company, Angel Research
March 31, 2017
6
Karur Vysya Bank | Initiating Coverage
Asset quality issues to subside gradually
KVB had maintained a fairly stable asset quality in a challenging economic
environment, however, prolonged slowdown in the core sectors took a toll on its
asset quality. The bank’s large dependence upon corporates and dwindling
profitability of the sectors has impacted the asset quality. Thus, the GNPAs which
were 1.30% at the end of FY2016 went up to 2.66% at the end of 3QFY2017,
while NNPAs went up to 1.68% v/s 0.55% over the same period of time. We expect
asset quality pressure to subside in the quarters to come.
Exhibit 14: GNPAs & NNPAs Ratio yearly trend (%)
3.50
3.2
3.1
3.00
2.7
2.50
1.9
2.00
1.67
1.64
1.60
1.50
1.3
1.00
0.8
0.78
0.55
0.41
0.50
0.00
FY14
FY15
FY16
FY17E
FY18E
FY19E
Gross NPAs (%)
Net NPAs (%)
Source: Company, Angel Research
Exhibit 15: Slippages (%)
3.50
3.14
3.00
2.48
2.50
2.00
2.00
1.82
1.50
1.50
1.00
0.50
0.50
0.00
FY14
FY15
FY16
FY17E
FY18E
FY19E
Source: Company, Angel Research
March 31, 2017
7
Karur Vysya Bank | Initiating Coverage
Large scale slippages and resultant higher credit cost impacted the bottom-line of
the bank. The last three quarters of FY2017 have been quite painful with
increasing slippages. However, we believe that a large part of the troubled assets
have already slipped into NPA and incremental slippages would be under control
for KVB. Further, recovery and up gradation is likely to gain momentum and this
should also aid in the overall control on the GNPA levels.
Exhibit 16: Comparable Asset quality of peer banks
GNPAs (%)
FY11
FY12
FY13
FY14
FY15
FY16
3QFY17
KVB
1.26
1.33
0.96
0.82
1.85
1.30
2.66
LVB
1.93
2.97
3.84
4.10
2.73
1.97
2.78
Federal Bank
3.49
3.35
3.44
2.70
2.04
2.84
2.77
City Union Bank
1.21
1.01
1.13
1.81
1.86
2.41
2.98
Karnataka Bank
3.97
3.27
2.51
2.92
2.95
3.44
4.30
DCB
5.86
4.40
3.18
1.69
1.76
1.51
1.55
South Indian Bank
1.11
0.97
1.36
1.19
1.71
3.77
3.98
Source: Company, Angel Research
Exhibit 17: Credit Cost (%)
Exhibit 18: PCR( %)
70
1.40
1.30
1.33
59
58
60
1.20
50
50
50
50
1.00
0.89
40
0.83
0.80
40
0.80
0.70
30
0.60
0.40
20
0.20
10
0.00
0
FY14
FY15
FY16
FY17E
FY18E
FY19E
FY14
FY15
FY16
FY17E
FY18E
FY19E
Source: Company, Angel Research
Source: Company, Angel Research
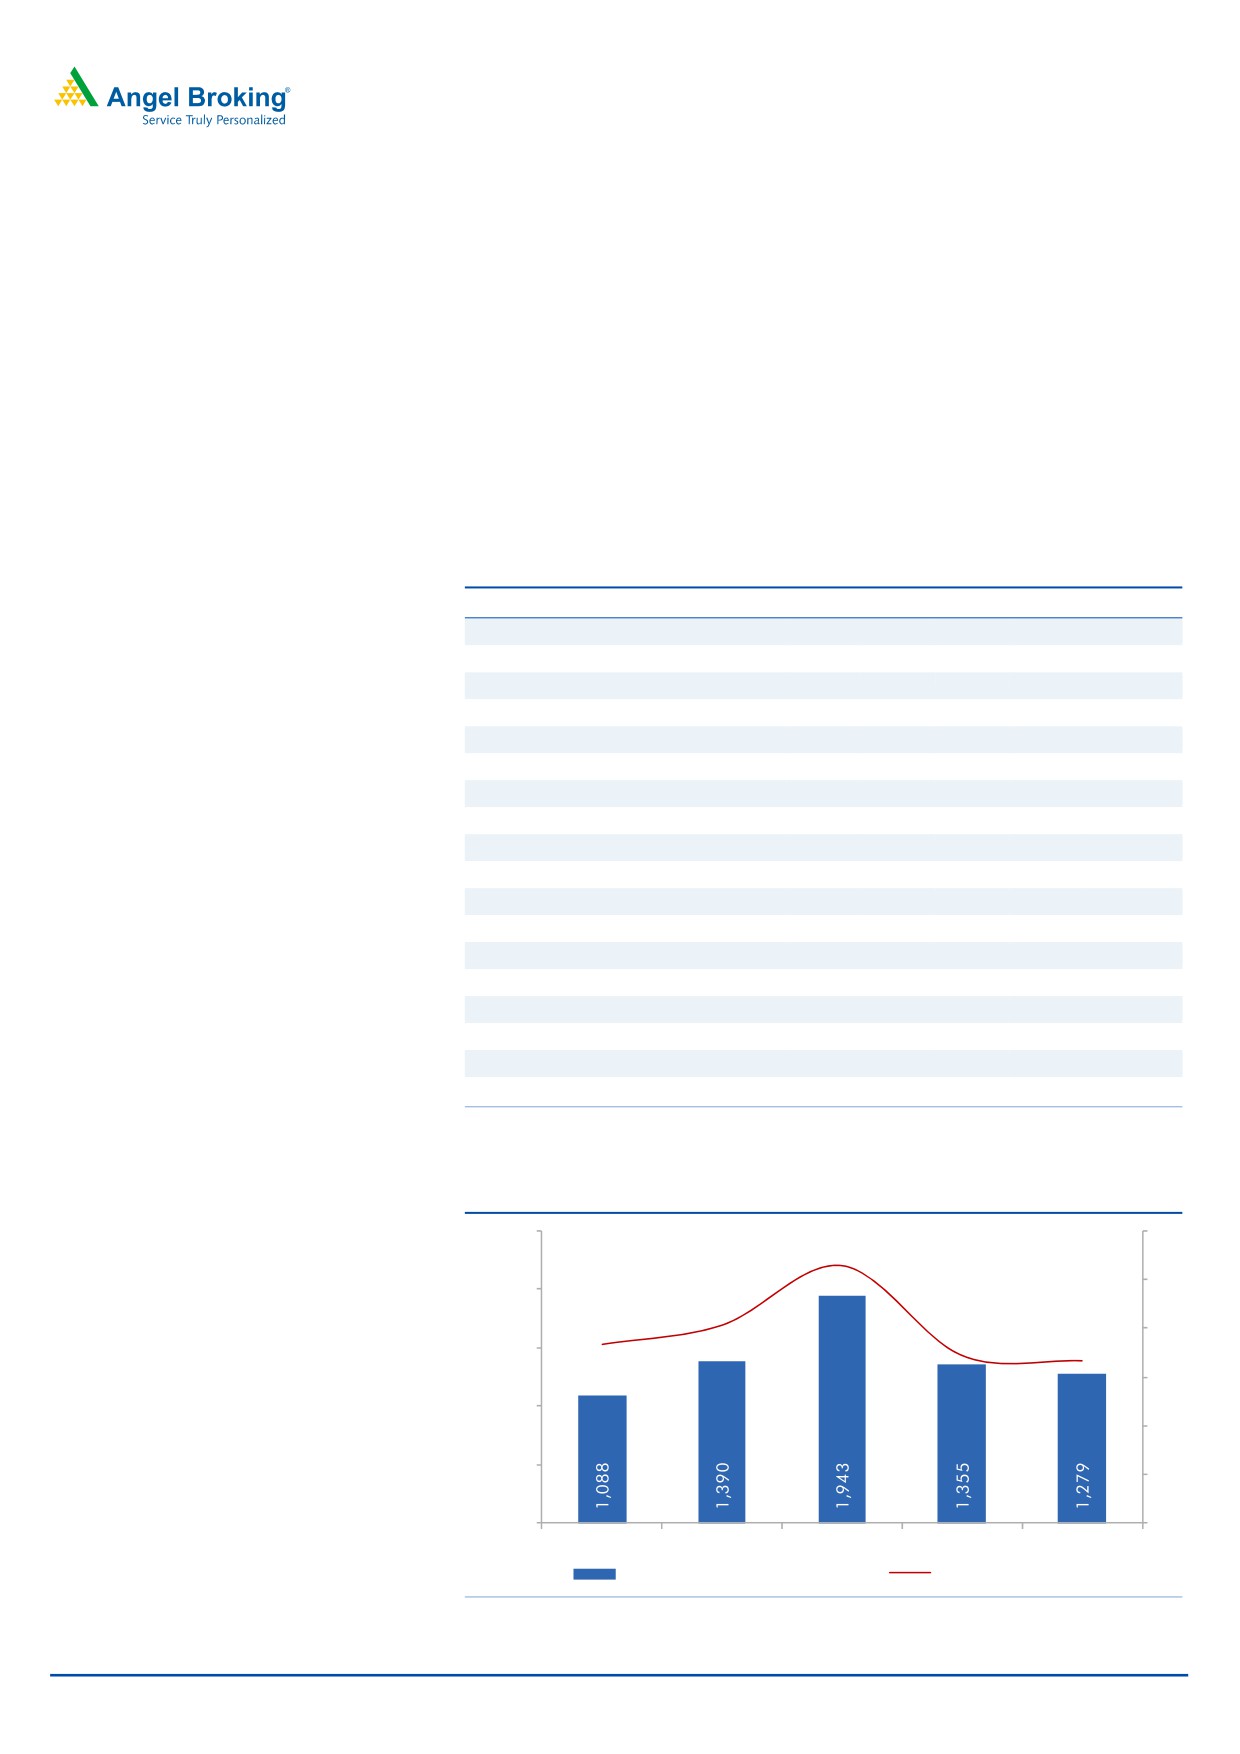
Large scale restructuring already over, incremental pain to be
minimal
KVB had to undertake a lot of restructuring in the sectors it had exposure to during
the last two years. Infrastructure and Textiles were the two large sectors where lot
of stress was witnessed by the bank. At the beginning of FY2016, the bank had an
outstanding restructured loan book of `1,943 cr, of which ~`692 cr (35% of total)
were downgraded to NPAs. Large part of this was from the commodity sector.
Accordingly, the outstanding restructured loan book had declined and it stood at
`1,279 cr (3.32% of the loan book) at the end of 3QFY2017. For KVB, large part
of the troubled assets has already been restructured and even the more
troublesome accounts have slipped into NPAs, hence we believe that incremental
stress in the form of restructuring could be minimal.
March 31, 2017
8
Karur Vysya Bank | Initiating Coverage
Large scale restructuring already over, incremental pain to be minimal
KVB had to undertake a lot of restructuring in the sectors it had exposure to during
the last two years. Infrastructure and Textiles were the two large sectors where lot
of stress was witnessed by the bank. At the beginning of FY2016, the bank had an
outstanding restructured loan book of `1,943 cr, of which ~`692 cr (35% of total)
were downgraded to NPAs. Large part of this was from the commodity sector.
Accordingly, the outstanding restructured loan book had declined and it stood at
`1,279 cr (3.32% of the loan book) at the end of 3QFY2017. For KVB, large part
of the troubled assets has already been restructured and even the more
troublesome accounts have slipped into NPAs, hence we believe that incremental
stress in the form of restructuring could be minimal.
Exhibit 19: Restructured Loan Book (` Cr)
Sector Wise Restructured Advances
FY13
FY14
FY15
FY16
Q3FY17
Infrastructure
606
599
890
807
752
Textiles
268
267
276
205
196
Food Processing
225
234
Agriculture
14
14
23
16
8
Iron & Steel
14
124
322
0
0
Real Estate
1
1
5
0
23
Others
186
386
426
102
66
Total Restructured Loans
1,088
1,390
1,943
1,355
1,279
% to Total Advances
3.66%
4.06%
5.29%
3.43%
3.32%
% to Total Restructured Advances
Infrastructure
55.7%
43.1%
45.8%
59.6%
58.8%
Textiles
24.6%
19.2%
14.2%
15.1%
15.3%
Food Processing
0.0%
0.0%
0.0%
16.6%
18.3%
Agriculture
1.3%
1.0%
1.2%
1.2%
0.6%
Iron & Steel
1.3%
8.9%
16.6%
0.0%
0.0%
Real Estate
0.1%
0.1%
0.3%
0.0%
1.8%
Others
17.1%
27.8%
21.9%
7.5%
5.2%
Total
100%
100%
100%
100%
100%
Source: Company, Angel Research
Exhibit 20: Restructured loan book (%)
2,500
6%
5.29%
5%
2,000
4.06%
3.43%
3.32%
3.66%
4%
1,500
3%
1,000
2%
500
1%
-
0%
FY13
FY14
FY15
FY16
Q3FY17
Total Restructured Loans (` cr)
% to Total Advances
Source: Company, Angel Research
March 31, 2017
9
Karur Vysya Bank | Initiating Coverage
Cost structure has come down in the last few years
Expanding the number of branches and ATMs on one hand and slowdown in
business on the other has impacted the cost structure of the bank, and hence, the
cost/income ratio of KVB has gone up. However, with maturing of new branches
and pick up in business in the existing branches, moderation in its cost/income
ratio is expected going ahead.
Exhibit 21: Cost to Income (%)
Exhibit 22: Cost to Assets (%)
60.0
3.00
2.60
2.54
57.5
2.50
58.0
57.0
2.50
2.26
2.06
2.11
55.4
56.0
54.7
2.00
53.9
54.0
1.50
52.0
50.3
1.00
50.0
0.50
48.0
46.0
0.00
FY14
FY15
FY16
FY17E
FY18E
FY19E
FY14
FY15
FY16
FY17E
FY18E
FY19E
Source: Company, Angel Research
Source: Company, Angel Research
Exhibit 23: Comparative Cost Structure
Cost / Income %
FY11
FY12
FY13
FY14
FY15
FY16
KVB
41.8
42.7
47.3
54.7
53.9
50.3
LVB
45.4
55.5
57.4
56.1
54.6
57.1
Federal Bank
36.9
39.4
44.7
47.6
50.0
56.7
City Union Bank
37.5
39.6
41.7
45.2
42.8
40.1
Karnataka Bank
60.7
52.7
51.2
56.0
53.9
53.7
DCB
71.4
74.4
68.7
62.9
58.8
58.4
South Indian Bank
46.8
48.7
47.5
50.0
56.2
56.6
Source: Company, Angel Research
Increasing share of low cost deposits and lower interest reversals
will ensure a healthy NIM going ahead
During the last quarter, the bank witnessed a drop in yield of assets coupled with a
sharp drop in the cost of funds. Backed by demonetization there was strong flow of
low cost deposits, and hence the reduction in cost. Though some part of the funds
could migrate to high cost term deposits, overall CASA could remain much
stronger than earlier for KVB, this together with lower interest reversal should help
in NIM remaining strong in the quarters to come.
March 31, 2017
10
Karur Vysya Bank | Initiating Coverage
Exhibit 24: NIM likely to see gradual upmove
4.00
3.44
3.50
3.21
3.28
3.23
2.80
3.00
2.61
2.50
2.00
1.50
1.00
0.50
0.00
FY14
FY15
FY16
FY17E
FY18E
FY19E
Source: Company, Angel Research
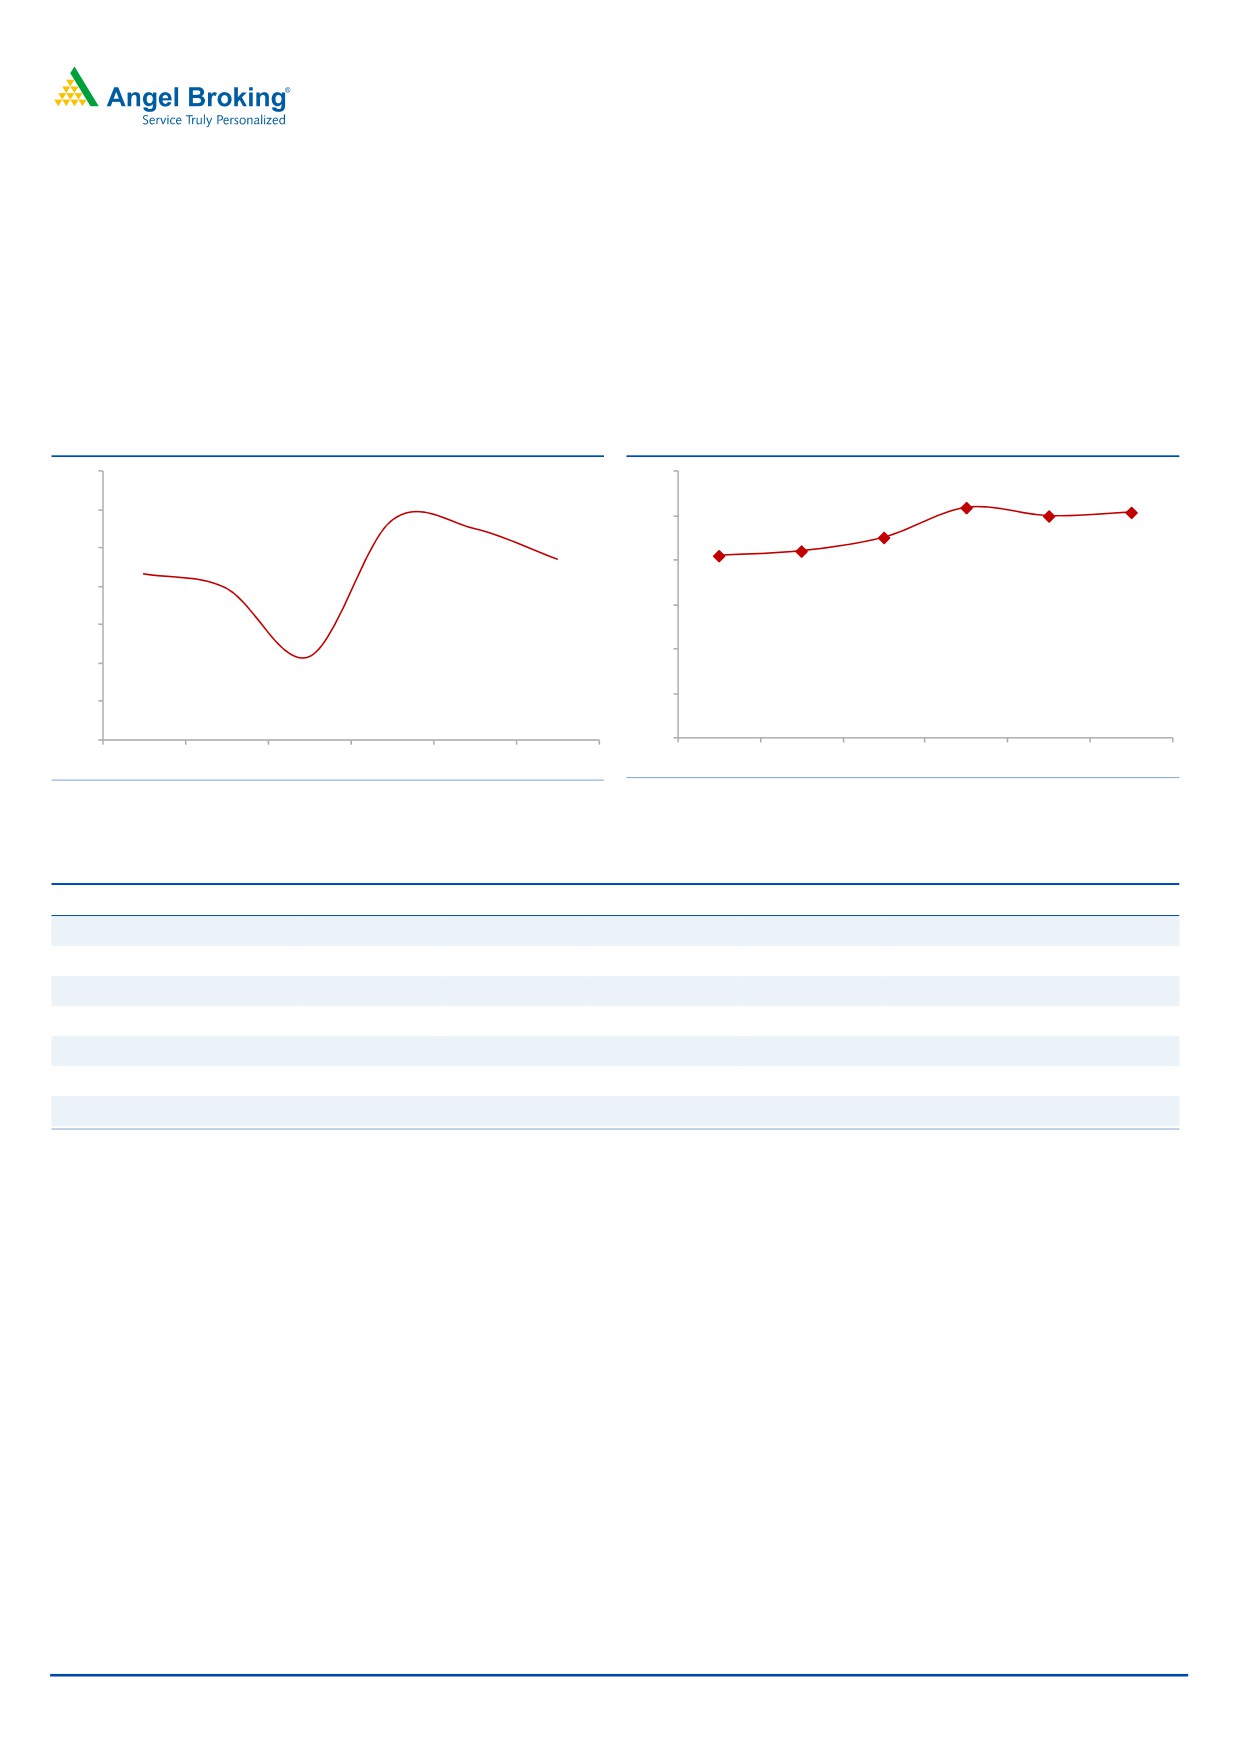
Return ratios hurt due to high credit cost, RoE to bounce back in
FY2018
Subdued growth in loan book on one hand and deteriorating asset quality on the
other dented the profitability of KVB in last few years. Operating expenses of the
bank grew at higher rate than the operating income, thus exerting pressure on the
cost structure of the bank. All these factors impacted the overall return ratios of the
bank, which saw a declining trend. However, over the medium term, with
moderating credit cost and cost structure, backed by better credit off take we
expect RoE to improve gradually.
Exhibit 25: ROA (%) to move up gradually
Exhibit 26: ROE to see steady improvement (%)
1.2
16.0
1.0
1.0
13.4
13.2
14.0
12.9
1.0
0.9
0.9
0.9
12.0
0.9
11.2
11.4
12.0
0.8
10.0
0.6
8.0
6.0
0.4
4.0
0.2
2.0
0.0
0.0
FY14
FY15
FY16
FY17E
FY18E
FY19E
FY14
FY15
FY16
FY17E
FY18E
FY19E
Source: Company, Angel Research;
Source: Company, Angel Research
March 31, 2017
11
Karur Vysya Bank | Initiating Coverage
In order to meet business growth capital needs to be raised
KVB has a relatively lower capital adequacy as compared to other south based
private sector banks. We feel that the bank will have to raise capital in the near
term in order to push higher growth. However, considering the bank’s strong track
record, we don’t see raising capital as a challenge for the bank.
Exhibit 27: Capital adequacy trend
16.0
14.6
13.6
14.0
12.6
12.2
12.0
11.7
11.8
11.9
11.3
11.3
12.0
11.0
11.1
10.0
8.0
6.0
4.0
2.0
0.0
FY14
FY15
FY16
FY17E
FY18E
FY19E
CAR (%) Tier I (%)
Source: Company, Angel Research
Exhibit 28: Comparative CAR (%) as on 31st Dec,2016
KVB
11.05
LVB
10.21
Federal Bank
12.28
City Union Bank
14.88
Karnataka Bank
13.19
DCB
13.33
South Indian Bank
11.05
Source: Company, Angel Research
March 31, 2017
12
Karur Vysya Bank | Initiating Coverage
Outlook and valuation
KVB’s earnings were impacted due to higher provisions and lower business growth,
however, we expect gradual recovery on both the fronts going ahead. While in
FY2018 we expect earnings recovery to be visible, sharp growth is expected in
FY2019. At the CMP the stock is trading at 1.1x it’s FY2019 BV. We have valued
the stock at 1.4x its FY2019E BV and recommend BUY with a Target Price of `140
over the next 12 months.
Exhibit 29: Comparative Valuation & Return ratio
P/BV
RoE%
RoA%
FY17E
FY18E
FY19E
FY17E
FY18E
FY19E
FY17E
FY18E
FY19E
KVB
1.3
1.2
1.1
11.2
11.4
13.2
0.9
0.9
1.0
LVB
1.6
1.4
1.3
11.2
12.7
15.2
0.7
0.7
0.9
Federal Bank
1.7
1.6
1.5
9.2
11.4
13.4
0.8
0.9
1.0
City Union Bank
2.6
2.3
2.0
15.1
15.7
16.4
1.5
1.5
1.6
Karnataka Bank
0.9
0.9
0.8
10.9
11.8
12.7
0.8
0.8
0.8
DCB
2.4
2.1
1.9
10.7
15.8
12.9
0.9
0.9
1.0
Source: Company, Angel Research, Note: CMP as of March 30, 2017, * other companies Consensus taken from Bloomberg,
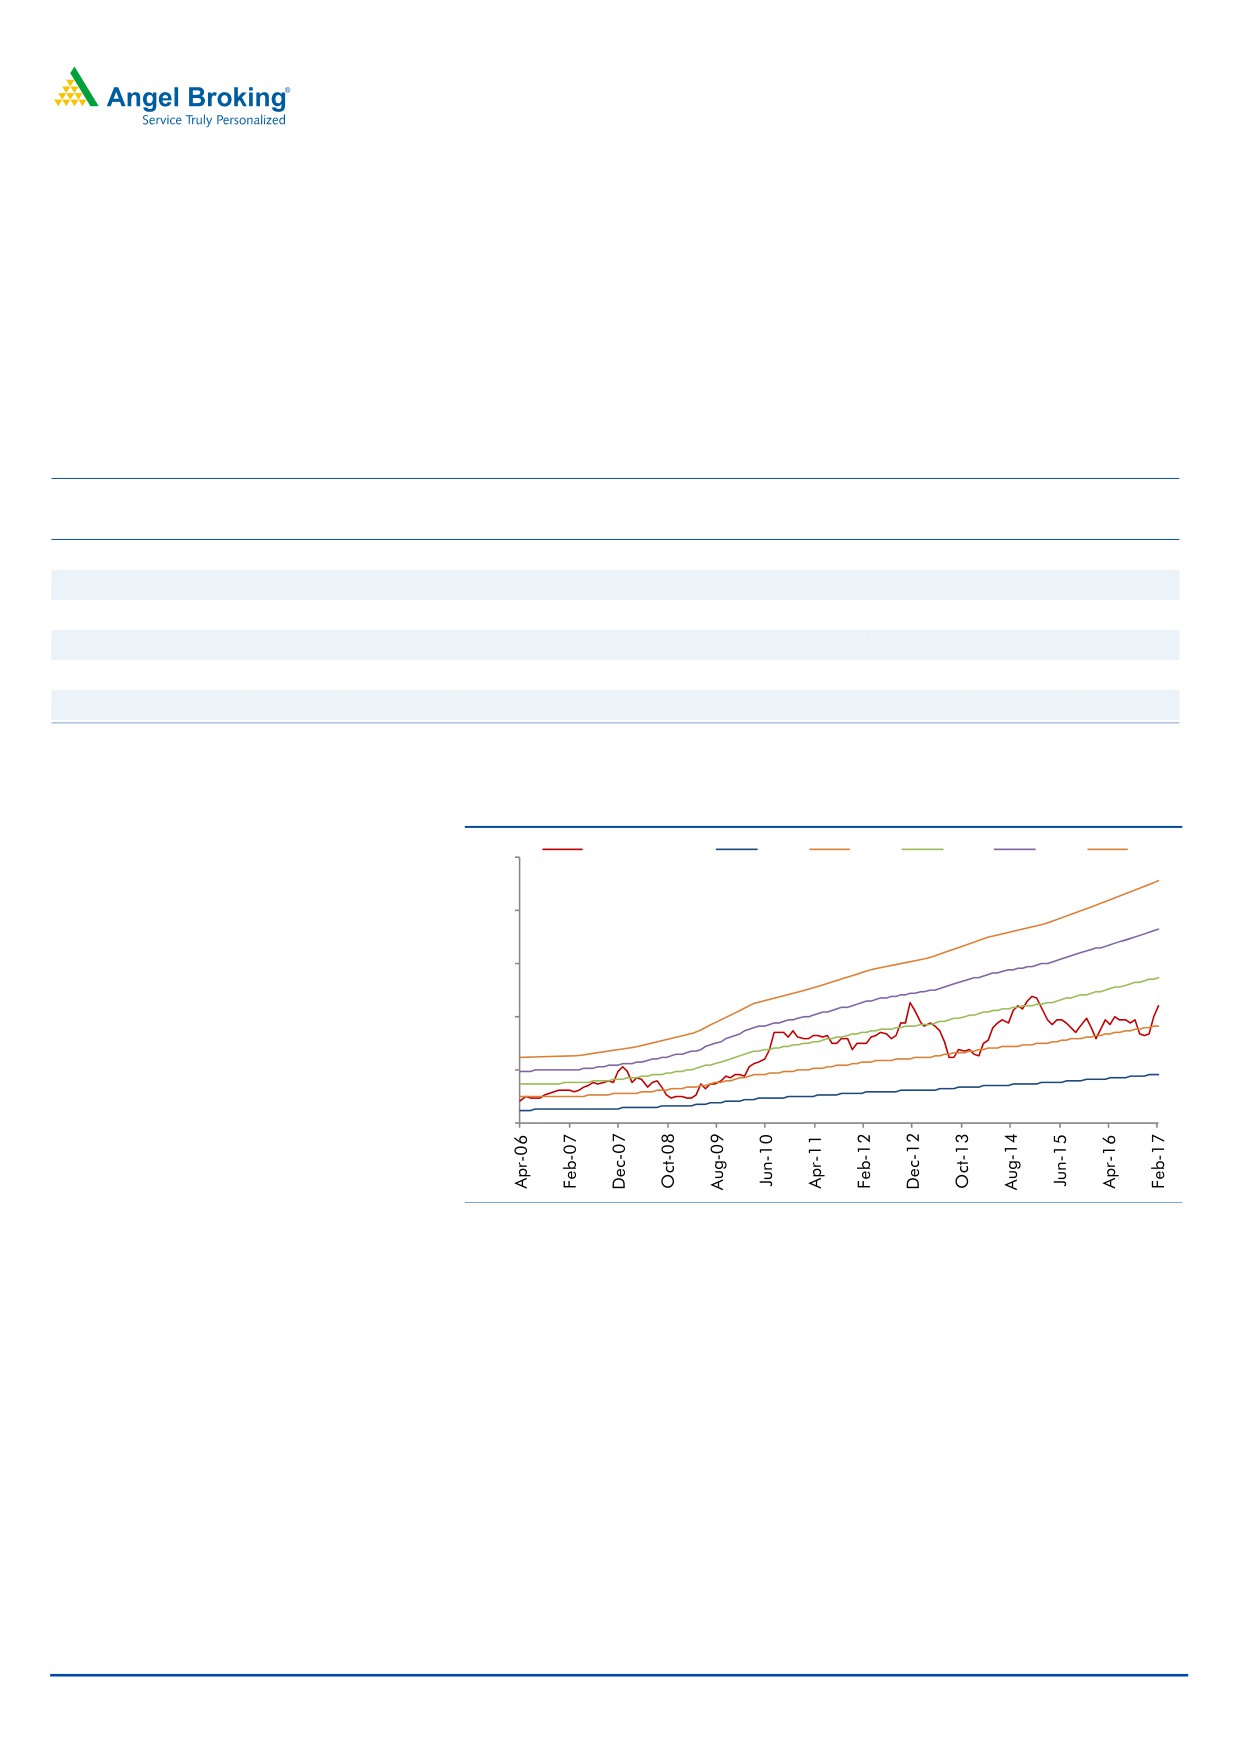
Exhibit 30: One Year Forward P/BV
Close -Unit Curr
0.5 X
1.0 X
1.5 X
2.0 X
2.5 X
250
200
150
100
50
0
Source: Company, Angel Research
March 31, 2017
13
Karur Vysya Bank | Initiating Coverage
Company Background
Based out of Karur, Tamil Nadu, Karur Vysya Bank is one of the oldest private
sector banks in India. The bank has strong presence in its home state Tamil Nadu
and in other southern states of India. However, in the last few years the bank has
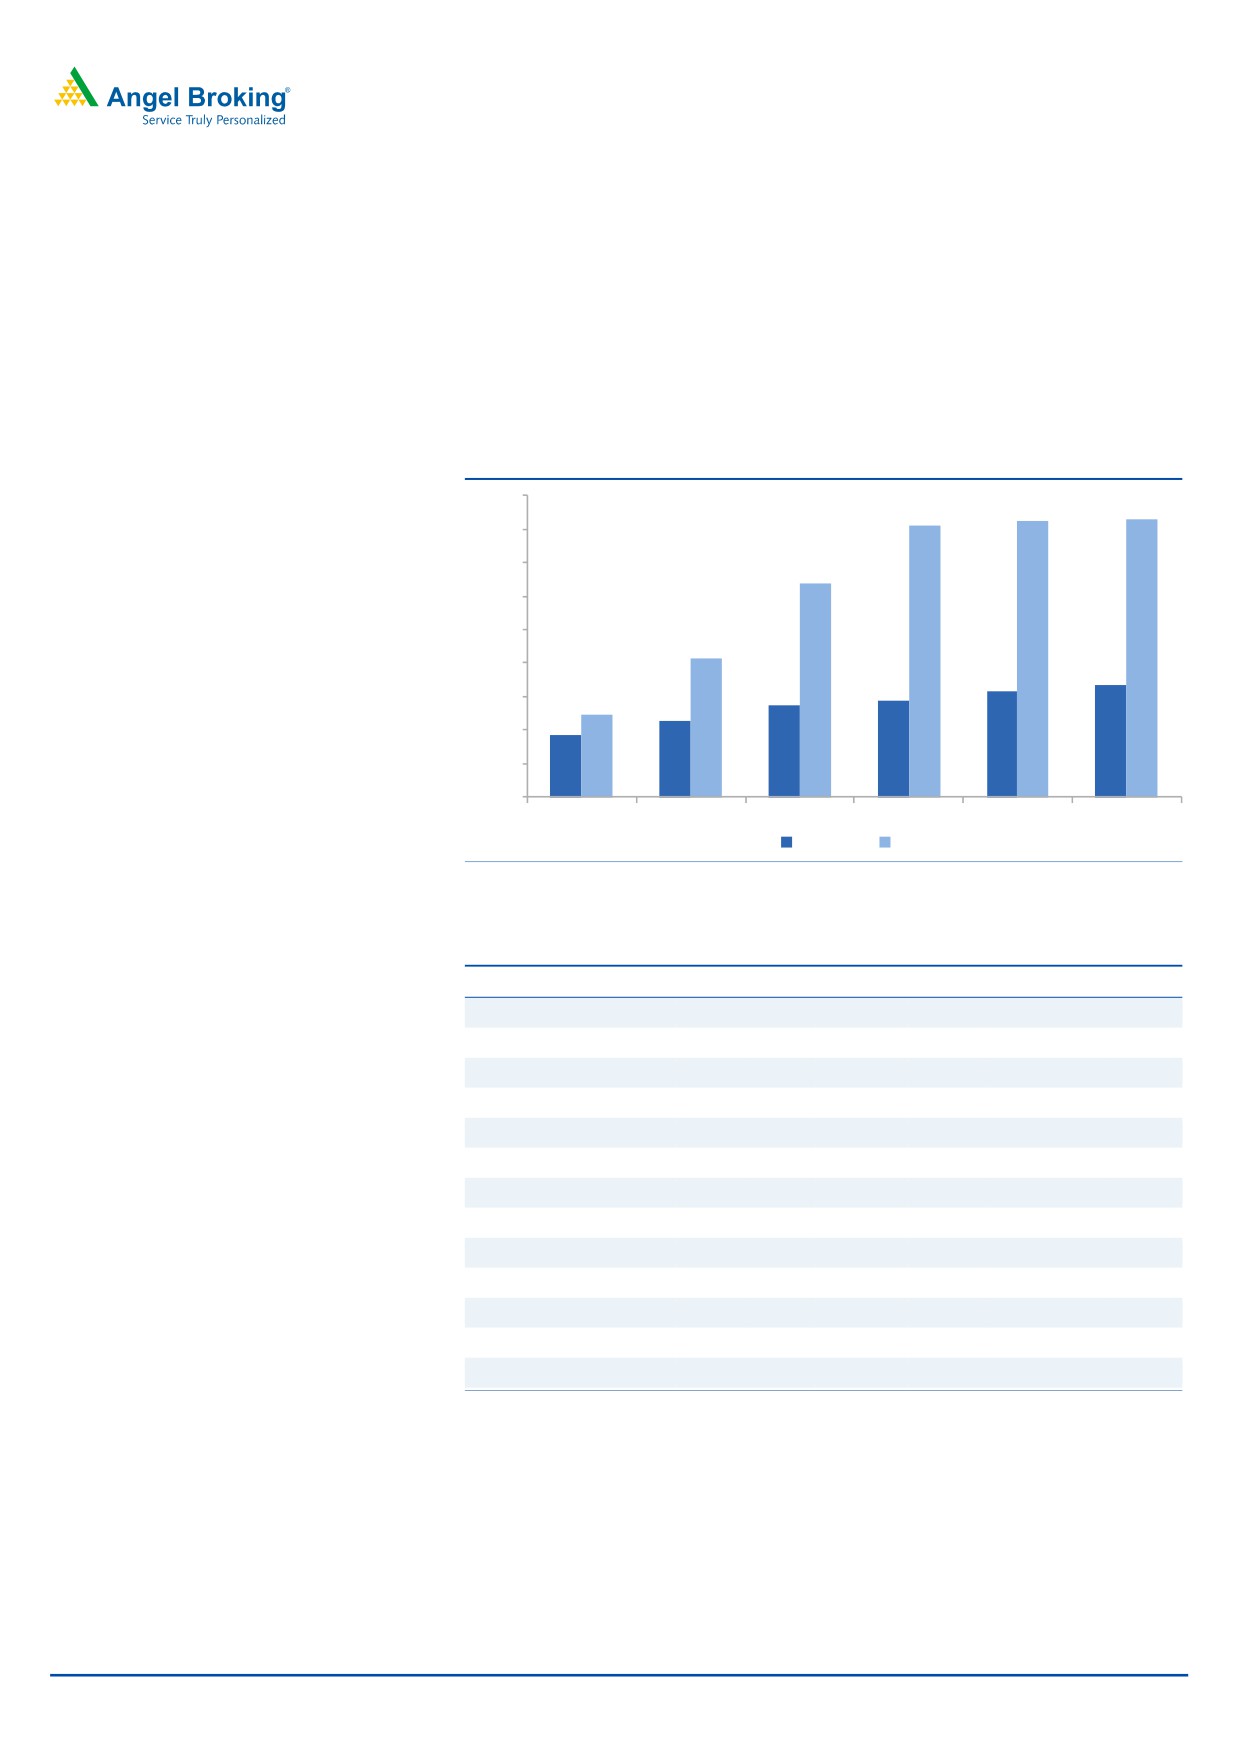
also been scaling up its operations in other states of India. At the end of
3QFY2017 the bank had a customer base of 6.09 million and operated through
706 branches and 1,711 ATMs.
Exhibit 31: Branch and ATM strength
1800
1,645
1,655
1,616
1600
1400
1,276
1200
1000
825
800
667
629
551
572
600
488
451
369
400
200
0
FY11
FY12
FY13
FY14
FY15
FY16
Branches
ATM
Source: Company, Angel Research
Exhibit 32: Comparative DuPont (FY2016)
KVB
LVB
Federal
CUB Karnataka
DCB
Interest Income
9.8
9.6
8.9
10.0
9.2
9.6
Interest Expenses
6.6
7.2
6.0
6.6
6.8
6.1
NII
3.2
2.4
2.9
3.3
2.4
3.5
Non Interest Income
1.3
1.1
0.9
1.4
1.0
1.3
Total Revenues
4.5
3.6
3.8
4.7
3.4
4.8
Operating Cost
2.3
2.0
2.1
1.9
1.8
2.8
PPP
2.2
1.5
1.6
2.8
1.6
2.0
Total Provisions
0.6
0.7
0.8
0.8
0.6
0.5
PreTax Profit
1.6
0.9
0.8
2.0
1.0
1.5
Tax
0.6
0.2
0.3
0.5
0.2
0.4
ROA
1.0
0.7
0.5
1.5
0.8
1.1
Leverage
12.6
16.1
10.8
10.3
15.3
10.4
RoE (%)
12.9
10.9
5.9
15.5
11.7
11.5
Source: Company, Angel Research
March 31, 2017
14
Karur Vysya Bank | Initiating Coverage
Income statement (Standalone)
Y/E March (` cr)
FY15
FY16
FY17E
FY18E
FY19E
Net Interest Income
1,466
1,781
2,010
2,182
2,532
- YoY Growth (%)
14.2
21.5
12.8
8.6
16.1
Other Income
581
707
761
783
848
- YoY Growth (%)
2.9
21.7
7.7
2.9
8.3
Operating Income
2,046
2,488
2,771
2,965
3,380
- YoY Growth (%)
10.7
21.6
11.4
7.0
14.0
Operating Expenses
1,103
1,253
1,592
1,691
1,874
- YoY Growth (%)
9.2
13.5
27.1
6.2
10.8
Pre - Provision Profit
943
1235
1179
1,274
1,506
- YoY Growth (%)
12.6
31.0
(4.6)
8.1
18.2
Prov. & Cont.
481
324
361
367
359
- YoY Growth (%)
8.6
(32.6)
11.6
1.6
(2.1)
Profit Before Tax
462
912
817
907
1147
- YoY Growth (%)
17.0
97.1
(10.3)
10.9
26.5
Prov. for Taxation
7
344
273
299
378
- as a % of PBT
1.6
37.7
33.3
33.0
33.0
PAT
455
568
545
608
768
- YoY Growth (%)
6
25
(4)
12
26
Balance sheet (Standalone)
Y/E March (` cr)
FY15
FY16
FY17E
FY18E
FY19E
Share Capital
122
122
122
122
122
Reserves & Surplus
4,124
4,451
4,997
5,426
6,002
Networth
4,246
4,573
5,119
5,548
6,124
Deposits
44,690
50,079
56,718
61,255
67,381
- Growth (%)
2.1
12.1
13.3
8.0
10.0
Borrowings
2,901
1,573
1,702
1,838
2,021
- Growth (%)
(11.9)
(45.8)
8.2
8.0
10.0
Other Liab & Prov.
1,315
1,439
1,418
1,531
1,685
Total Liabilities
53,152
57,664
64,956
70,173
77,211
Cash balances
2,693
2,529
2,836
3,063
3,369
Bank balances
56
263
1,134
613
674
Investments
12,773
13,222
15,881
17,152
18,867
Advances
36,109
39,084
40,382
44,420
49,751
- Growth (%)
6.2
8.2
3.3
10.0
12.0
Fixed Assets
411
420
462
496
546
Other Assets
1,110
2,146
4,261
4,430
4,005
Total Assets
53,152
57,664
64,956
70,173
77,211
March 31, 2017
15
Karur Vysya Bank | Initiating Coverage
Ratio analysis (Standalone)
Y/E March
FY15
FY16
FY17E
FY18E
FY19E
Profitability Ratios (%)
NIMs
2.8
3.2
3.3
3.2
3.4
Cost to Income Ratio
53.9
50.3
57.5
57.0
55.4
RoA
0.9
1.0
0.9
0.9
1.0
RoE
12.0
12.9
11.2
11.4
13.2
B/S ratios (%)
CASA Ratio
22.0
23.3
30.9
30.0
30.0
Credit/Deposit Ratio
80.8
78.0
71.2
72.5
73.8
CAR
14.6
12.2
11.8
11.9
12.0
- Tier I
13.6
11.3
11.0
11.1
11.3
Asset Quality (%)
Gross NPAs
1.9
1.3
2.7
3.2
3.1
Net NPAs
0.8
0.6
1.7
1.6
1.6
Slippages
1.8
3.1
2.5
2.0
1.5
Loan Loss Prov./Avg. Assets
1.3
0.8
0.9
0.8
0.7
Provision Coverage
59
58
40
50
50
Per Share Data (`)
EPS
7.5
9.3
8.9
10.0
12.6
BVPS
69.8
75.0
84.0
91.1
100.5
ABVPS
65.2
71.5
72.9
79.1
87.5
DPS
1.0
3.0
2.0
3.0
4.0
Valuation Ratios
PER (x)
14.7
11.8
12.3
11.0
8.7
P/BVPS(x)
1.6
1.5
1.3
1.2
1.1
P/ABVPS (x)
1.7
1.5
1.5
1.4
1.3
Dividend Yield
0.9
2.7
1.8
2.7
3.6
DuPont Analysis (%)
Interest Income
10.3
9.8
9.2
8.9
9.1
Interest Expenses
7.5
6.6
5.9
5.7
5.7
NII
2.8
3.2
3.3
3.2
3.4
Non Interest Income
1.1
1.3
1.2
1.2
1.2
Total Revenues
3.9
4.5
4.5
4.4
4.6
Operating Cost
2.1
2.3
2.6
2.5
2.5
PPP
1.8
2.2
1.9
1.9
2.0
Total Provisions
0.9
0.6
0.6
0.5
0.5
PreTax Profit
0.9
1.6
1.3
1.3
1.6
Tax
0.0
0.6
0.4
0.4
0.5
ROA
0.9
1.0
0.9
0.9
1.0
Leverage
13.8
12.6
12.7
12.7
12.6
RoE (%)
12.0
12.9
11.2
11.4
13.2
March 31, 2017
16
Karur Vysya Bank | Initiating Coverage
Research Team Tel: 022 - 39357800
DISCLAIMER
Angel Broking Private Limited (hereinafter referred to as “Angel”) is a registered Member of National Stock Exchange of India Limited,
Bombay Stock Exchange Limited and Metropolitan Stock Exchange Limited. It is also registered as a Depository Participant with CDSL
and Portfolio Manager with SEBI. It also has registration with AMFI as a Mutual Fund Distributor. Angel Broking Private Limited is a
registered entity with SEBI for Research Analyst in terms of SEBI (Research Analyst) Regulations, 2014 vide registration number
INH000000164. Angel or its associates has not been debarred/ suspended by SEBI or any other regulatory authority for accessing
/dealing in securities Market. Angel or its associates/analyst has not received any compensation / managed or co-managed public
offering of securities of the company covered by Analyst during the past twelve months.
This document is solely for the personal information of the recipient, and must not be singularly used as the basis of any investment
decision. Nothing in this document should be construed as investment or financial advice. Each recipient of this document should
make such investigations as they deem necessary to arrive at an independent evaluation of an investment in the securities of the
companies referred to in this document (including the merits and risks involved), and should consult their own advisors to determine
the merits and risks of such an investment.
Reports based on technical and derivative analysis center on studying charts of a stock's price movement, outstanding positions and
trading volume, as opposed to focusing on a company's fundamentals and, as such, may not match with a report on a company's
fundamentals. Investors are advised to refer the Fundamental and Technical Research Reports available on our website to evaluate the
contrary view, if any.
The information in this document has been printed on the basis of publicly available information, internal data and other reliable
sources believed to be true, but we do not represent that it is accurate or complete and it should not be relied on as such, as this
document is for general guidance only. Angel Broking Pvt. Limited or any of its affiliates/ group companies shall not be in any way
responsible for any loss or damage that may arise to any person from any inadvertent error in the information contained in this report.
Angel Broking Pvt. Limited has not independently verified all the information contained within this document. Accordingly, we cannot
testify, nor make any representation or warranty, express or implied, to the accuracy, contents or data contained within this document.
While Angel Broking Pvt. Limited endeavors to update on a reasonable basis the information discussed in this material, there may be
regulatory, compliance, or other reasons that prevent us from doing so.
This document is being supplied to you solely for your information, and its contents, information or data may not be reproduced,
redistributed or passed on, directly or indirectly.
Neither Angel Broking Pvt. Limited, nor its directors, employees or affiliates shall be liable for any loss or damage that may arise from
or in connection with the use of this information.
Disclosure of Interest Statement
Karur Vysya Bank
1. Financial interest of research analyst or Angel or his Associate or his relative
No
2. Ownership of 1% or more of the stock by research analyst or Angel or associates or relatives
No
3. Served as an officer, director or employee of the company covered under Research
No
4. Broking relationship with company covered under Research
No
Ratings (Based on expected returns
Buy (> 15%)
Accumulate (5% to 15%)
Neutral (-5 to 5%)
over 12 months investment period):
Reduce (-5% to -15%)
Sell (< -15)
March 31, 2017
17