2QFY2016 Result Update | Infrastructure
November 16, 2015
KNR Constructions
BUY
CMP
`580
Performance Highlights
Target Price
`673
Investment Period
12 Months
Quarterly highlights - Standalone
Y/E March (` cr)
2QFY16 1QFY16 2QFY15
% chg (yoy)
% chg (qoq)
Stock Info
Net sales
213
175
170
24.9
21.8
Sector
Infrastructure
EBITDA
35
28
30
15.6
24.6
Market Cap (` cr)
1,630
Adj. PAT
22
15
14
59.4
48.0
Net debt (` cr)
72
Source: Company, Angel Research
Beta
1.2
52 Week High / Low
625/274
KNR Constructions (KNR) reported strong set of 2QFY2016 numbers. On the
Avg. Daily Volume
3,229
top-line (standalone) front, it reported 24.9% yoy increase to `213cr (ahead of
Face Value (`)
10
our estimate of `189cr). EBITDA and PAT numbers were ahead of our estimate at
BSE Sensex
25,611
`35cr and `22cr, respectively (v/s our estimate of `27cr and `11cr, respectively).
Nifty
7,762
PAT numbers during the quarter benefitted from prior period tax refunds and
Reuters Code
KNRL.BO
interest on such tax refunds to the tune of `33cr. On adjusting for the same, Adj.
Bloomberg Code
KNRC@IN
PAT of KNR was at `22cr, reflecting an impressive 10.5% Adj. PAT margin.
Shareholding Pattern (%)
KNR’s order book as of 2QFY2016 stands at ~`3,665cr, which gives strong
Promoters
60.8
revenue visibility for over the next few quarters.
MF / Banks / Indian Fls
25.5
FII / NRIs / OCBs
1.7
Valuation: Improved order book, ramp-up in recently won projects, strong
Indian Public / Others
12.1
earnings growth potential, and comfortable Balance Sheet, strengthen our view
that KNR would continue to trade at rich valuations. On valuing the standalone
entity at 15.0x our FY2017E EPS of `38.6, and adding value for its Kerala &
Abs. (%)
3m 1yr 3yr
Sensex
(8.8)
(8.7)
38.6
Muzaffarpur BOT projects, we arrive at FY2017E sum-of-the-parts (SoTP) based
KNR
8.8
104.8
447.5
price target of `673/share, implying 16% upside from the current levels. Given
the upside in the stock, we upgrade our rating to Buy.
3-Year Daily Price Chart
Key financials (Standalone)
700
Y/E March (` cr)
FY13
FY14
FY15
FY16E
FY17E
600
500
Net Sales
689
837
876
937
1,470
400
% chg
(8.1)
21.5
4.7
7.0
56.8
300
200
Net Profit
52
61
73
94
109
100
0
% chg
(1.2)
17.0
19.7
28.9
15.4
EBITDA (%)
16.4
15.3
14.4
14.3
14.0
EPS (`)
18.5
21.7
26.0
33.5
38.6
Source: Company, Angel Research
P/E (x)
31.3
26.7
22.3
17.3
15.0
P/BV (x)
3.6
3.2
2.9
2.5
2.2
RoE (%)
12.1
12.6
13.5
15.4
15.4
RoCE (%)
16.0
15.4
13.8
13.8
19.1
EV/Sales (x)
2.4
2.0
1.9
1.8
1.2
Yellapu Santosh
022 - 3935 7800 Ext: 6811
EV/EBITDA (x)
14.5
13.3
13.5
12.6
8.4
Source: Company, Angel Research; CMP as of November 13, 2015
Please refer to important disclosures at the end of this report
1
KNR Constructions | 2QFY2016 Result Update
Exhibit 1: Quarterly Performance (Standalone)
Particulars (` cr)
2QFY16
1QFY16
% chg (qoq) 2QFY15
% chg (yoy) 1HFY16 1HFY15
% chg (yoy)
Net Sales
213
175
21.8
170
24.9
387
407
(4.8)
Total Expenditure
178
147
21.2
140
26.9
324
345
(6.1)
Cost of materials consumed
66
84
(21.2)
58
13.8
150
152
(1.0)
Sub-Cont., Spreading & Assort. Exp.
78
34
127.4
55
42.6
112
134
(16.2)
Employee benefits Expense
12
10
17.3
9
29.8
21
17
22.7
Other Expenses
22
19
19.3
18
20.7
41
43
(4.2)
EBITDA
35
28
24.6
30
15.6
62.9
61.2
2.8
EBIDTA %
16.4
16.0
17.7
16.2
15.0
Depreciation
11
11
2.3
13
(18.5)
21
29
(25.4)
EBIT
24
17
38.0
17
42.3
42
33
27.5
Interest and Fin. Charges
3
3
36.0
3
6.6
6
6
(3.6)
Other Income
12
2
462.5
2
406.0
14
5
170.5
PBT before Exceptional Items
33
17
92.1
16
103.9
50
32
57.6
Exceptional Items
0
0
0
0
0
PBT after Exceptional Items
33
17
92.1
16
103.9
50
32
Tax
(23)
2
2
(20)
(2)
% of PBT
(68.7)
12.1
13.3
(41.1)
(6.6)
PAT
55
15
268.7
14
296.9
70.4
33.7
108.5
Adj. PAT
22
15
48.0
14
59.4
37
34
10.4
Adj. PAT %
10.5
8.6
8.2
9.6
8.3
Dil. EPS
19.68
5.34
268.5
4.96
296.8
25.02
12.00
108.5
Source: Company, Angel Research
Standalone Business Review
Revenues grow 24.9% yoy
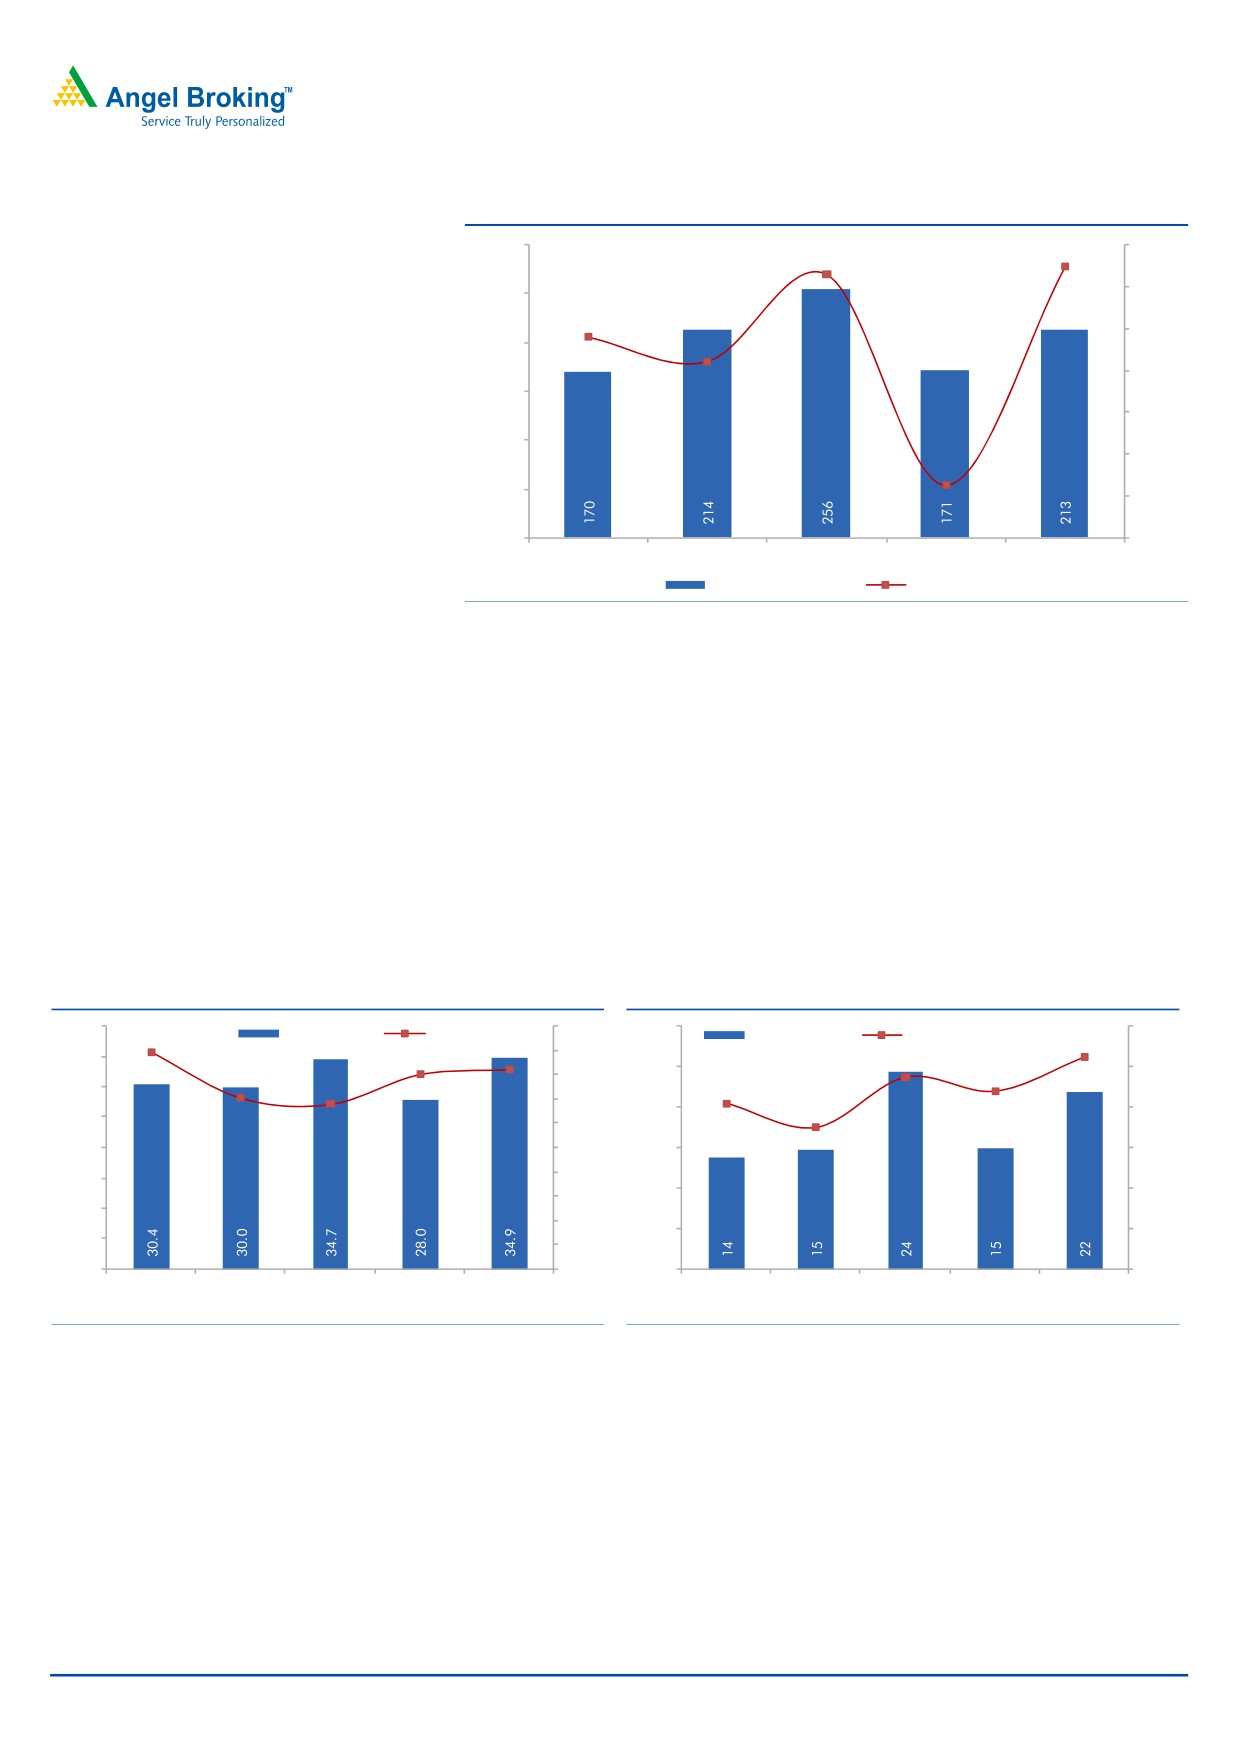
Strong execution led to 24.9%/21.8% yoy/qoq revenue growth in 2QFY2016 to
`213cr. Reported revenues were ahead of our estimate of `189cr. Execution of
Madhya Pradesh (Chindwara-Linga-Umarnala-Saoner, Dabra-Bhitarwar-Harsi
projects) and Andhra Pradesh projects contributed to strong revenues during the
quarter.
November 16, 2015
2
KNR Constructions | 2QFY2016 Result Update
Exhibit 2: Quarterly Revenues
300
24.9
30
23.1
20
250
10
200
2.2
(8.1%)
0
150
(10)
100
(20)
(27.6)
50
(30)
0
(40)
2QFY2015
3QFY2015
4QFY2015
1QFY2016
2QFY2016
Revenues (` cr)
yoy growth (%)
Source: Company, Angel Research
EBITDA margin declines by 132bp yoy to 16.4%
KNR reported an EBITDA of `35cr ahead of our estimate of `27cr. Reported
EBITDA margins of the company were at 16.4%, lower than year ago levels of
17.7% (reflecting 132bp yoy decline). Decline in yoy EBITDA margin was on
account of 42.6% increase in sub-contracting and spreading and assorting
expenses to `78cr (accounted for 36.7% of 2QFY2016 sales) and 29.8% increase
in employee expenses to `12cr. Completion of Chindwara road project where
payments were received on revised quotations led to better EBITDA margins in
2QFY2016.
Exhibit 3: EBITDA margins decline to 16.4%
Exhibit 4: Adj. PAT Margin at 10.5% for the quarter
40
20
30
12
17.8
EBITDA (` cr)
EBITDA Margin (%)
Adj. PAT (` cr)
Adj. PAT Margin (%)
10.5
35
16.0
18
9.5
25
8.8
10
16
30
13.6
8.2
16.4
14
20
7.0
8
25
14.1
12
20
10
15
6
8
15
10
4
6
10
4
5
2
5
2
0
0
0
0
2QFY2015
3QFY2015
4QFY2015
1QFY2016
2QFY2016
2QFY2015
3QFY2015
4QFY2015
1QFY2016
2QFY2016
Source: Company, Angel Research
Source: Company, Angel Research
Adj. PAT margin expands to 10.5%
The company reported PAT of `55cr, ahead of our estimate of `11cr. Reported
PAT margins of the company were at 26%, ahead of year ago levels of 8.2%.
During the quarter the company reported tax refunds related to prior periods (for
FY2009-12) to the tune of `25.8cr. Also, `5.8cr of interest on income tax refunds
was reported in 2QFY2016 (under other income). On adjusting for these
2 transactions, adj. PAT of the company were at `22cr (reflecting Adj. PAT margins
of 10.5%).
November 16, 2015
3
KNR Constructions | 2QFY2016 Result Update
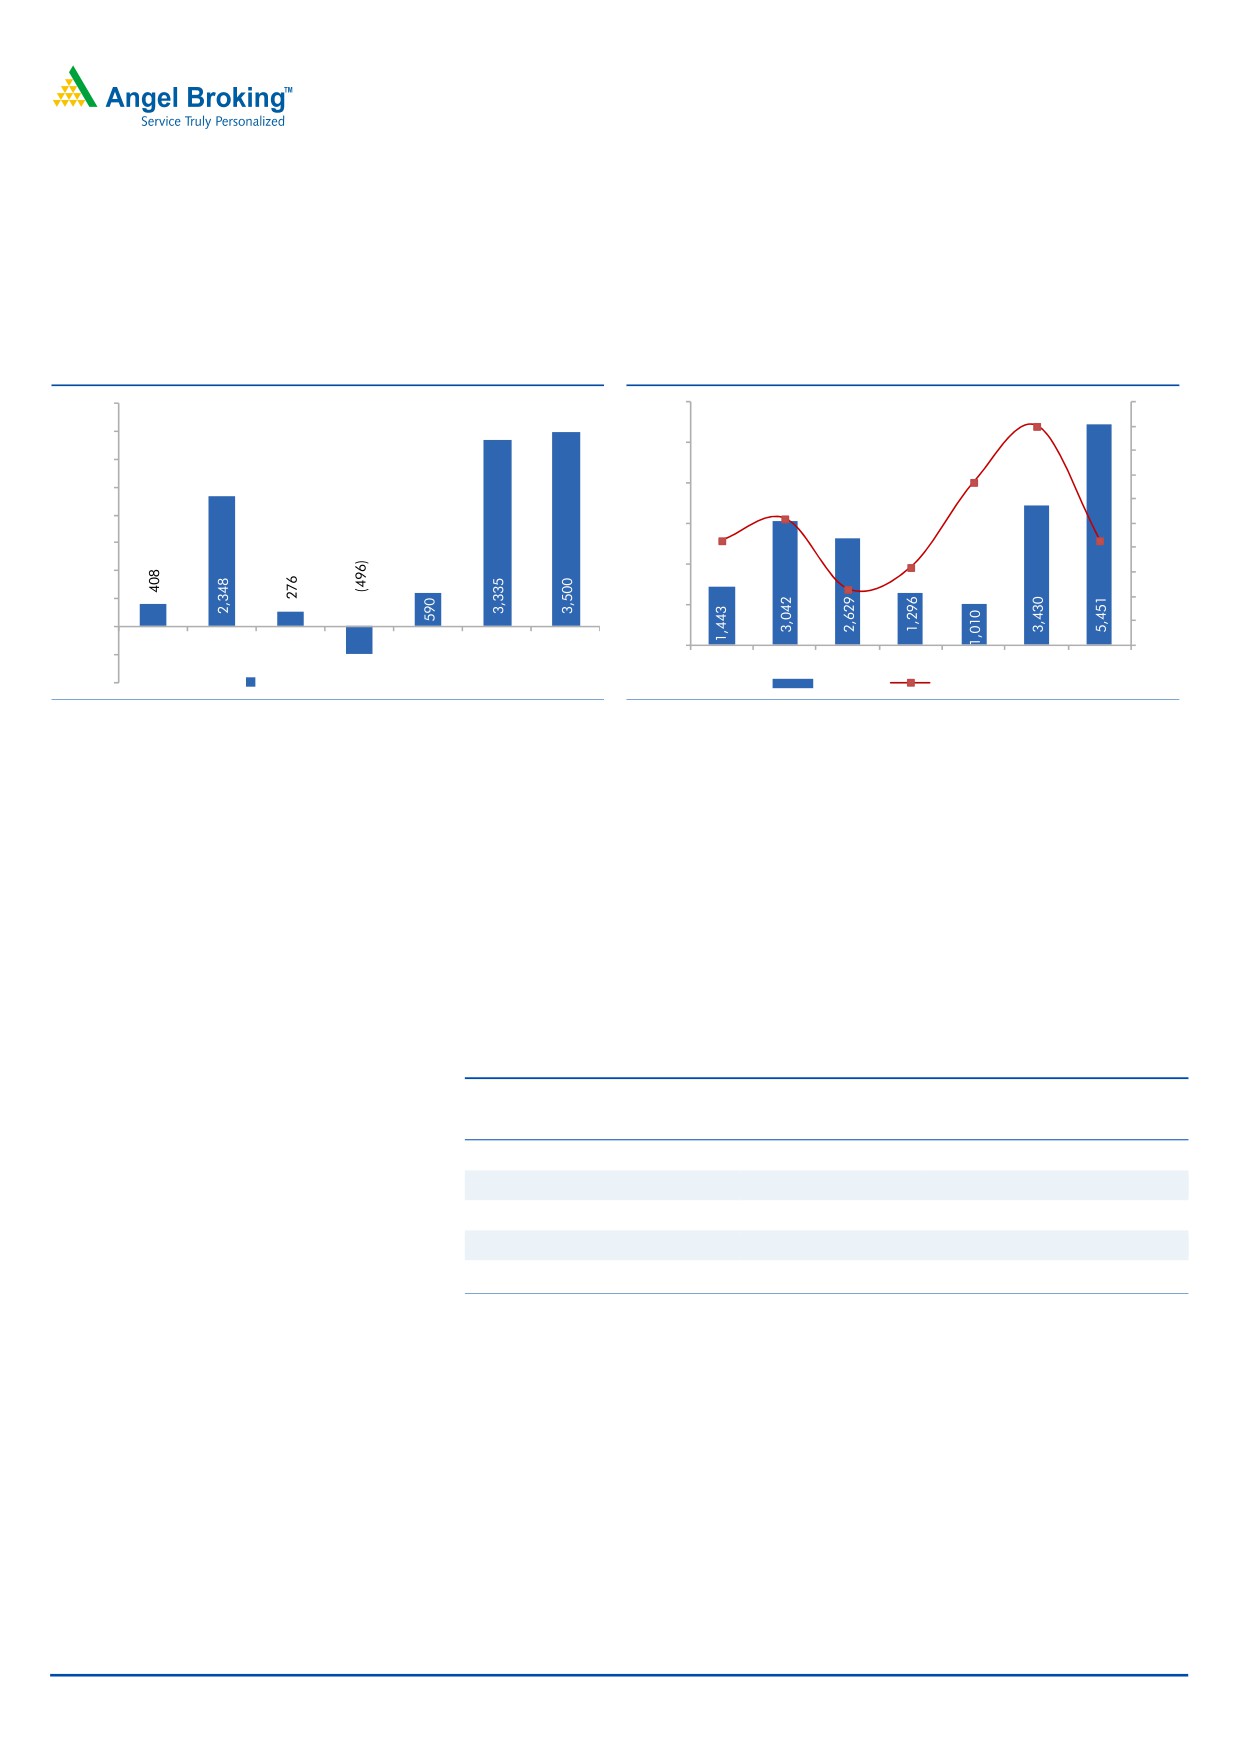
Strong Order Inflow seen during YTD FY2016
Year-to-date in FY2016, KNR has reported `2,591cr of order wins, which is
significantly higher than `950cr of order inflows in FY2015. Management has
guided for another `750cr-1,000cr of order wins for remaining part of FY2016E.
Exhibit 5: Order Inflows to see uptrend
Exhibit 6: Order Book gives better revenue visibility
4,000
6,000
1.0x
0.4x
3,500
0.9x
5,000
0.9x
0.8x
3,000
0.7x
0.7x
2,500
4,000
0.5x
0.2x
0.6x
2,000
3,000
0.4x
0.5x
1,500
0.3x
0.4x
2,000
1,000
0.3x
500
0.2x
1,000
0.1x
0
FY11
FY12
FY13
FY14
FY15
FY16E
FY17E
0
0.0x
(500)
FY11
FY12
FY13
FY14
FY15
FY16E FY17E
(1,000)
Order Inflows (` cr)
OB (` cr)
Execution Rate (x)
Source: Company, Angel Research
Source: Company, Angel Research
Recent order wins from road vertical take the 2QFY2016 Order book to `3,665cr.
This has resulted in 2QFY2016 order book / last twelve month (LTM) sales ratio at
4.3x (vs 1.2x as of 4QFY2015-end). The current order book gives strong revenue
visibility for the next few quarters.
Revision of Earnings Estimate
On considering better than expected execution in 2QFY2016, 1HFY2016 EBITDA
margins, tax refund related to earlier period, we revise our FY2016-17E estimates.
Exhibit 7: Earnings Revision
FY2016E
FY2017E
Y/E March (` cr)
Old
New Chg. (%)
Old
New Chg. (%)
Net Sales
915
937
2.4
1,479
1,470
(0.6)
EBITDA
131
134
2.3
205
205
0.0
EBITDA Margins (%)
14.3
14.3
13.9
14.0
PAT
57
94
64.9
105
109
3.8
PAT Margins (%)
6.2
10.0
7.1
7.4
Source: Angel Research
November 16, 2015
4
KNR Constructions | 2QFY2016 Result Update
Outlook & Valuation
Outlook
KNR in our view enjoys (1) strong execution track record, (2) better cost structure
(reflected in the form of better EBITDA & PAT margins in comparison to its peers),
(3) shorter working capital cycle, (4) low leverage (since FY2011, D/E ratio has
been ~0.2x), and (5) superior RoEs (12.1-17.1% range during FY2011-15). All
these factors indicate at KNR’s superior earnings quality, and strengthen our view
that KNR would continue to trade at rich valuations.
For valuation purposes, we have valued KNR using Sum-Of-The-Parts method.
KNR’s EPC business (standalone entity) is valued at FY2017E P/E multiple, whereas
only 1 of the 4 BOT projects has been valued using “Free Cash flow to Equity
holders” method and another one on BV basis. We have excluded 2 Annuity BOT
projects, where KNR has 40% stake in the JVs with Patel Engineering, as both these
projects are securitized.
Value of Core EPC business
Considering (1) 4.3x order backlog of `3,665cr (as of 2QFY2016-end), which
gives revenue visibility for 24+ months, (2) ramp-up in some of the recently won
projects, which gives better revenue visibility, (3) strong balance sheet (1HFY2015
D/E at 0.1x), (4) strong 22% earnings CAGR during FY2015-17E, and (5) expected
expansion in the RoE (from 13.5% in FY2015 to 15.4% by FY2017E), we assign
15.0x P/E multiple to our FY2017E EPS estimate of `38.6/share and arrive at
standalone business value of `579/share.
Exhibit 8: Sum-of-the-Parts based Valuation Table
FY17E Std. PAT
Target
Target Value
Value/ share
% of
Particulars
Segment
Basis
(` cr)
Multiple
(` cr)
(`)
SoTP
KNR's EPC business
Construction
109
15.0
1,629
579
86
P/E multiple
Total
109
1,629
579
86
Discounted
Project
Adj. FCFE
Value/ share
% of
Particulars
Proj. Type
Basis
FCFE/ BV (` cr)
Stake
Value (` cr)
(`)
SoTP
Road BOT projects
Walayar-Vadakkancheery BOT Proj.
Toll
232
100%
232
83
12
Ke of 14%
Muzaffarpur-Barauni BOT Project
Toll
30
51%
30
11
2
P/BV multiple
Total
262
262
93
14
Grand Total
1,892
673
100
Upside/ (Downside)
16%
CMP
580
Source: Company, Angel Research
November 16, 2015
5
KNR Constructions | 2QFY2016 Result Update
Value of BOT projects
BOT projects have been valued using “Free Cash flow to Equity holders” and Book
value method. The Walayar-Vadakkancheery BOT Project is operational ahead by
1 month from its scheduled CoD of Sep-2015. We have valued this BOT project
using 14% discounting rate to arrive at a FCFE of `83/share (12% of SOTP value
of the company). Also, we have added, equity value of `30cr, which KNR is
expected to infuse in Muzaffarpur-Barauni BOT project at BV to arrive at project
value of `11/share. On a whole, BOT projects contribute `93/share to our revised
price target.
Business Value
On combining the value of EPC business and BOT projects, we arrive at a
combined business value of `673/share, reflecting 16% upside in the stock price
from here-on. Accordingly, we upgrade our rating on the stock to Buy.
November 16, 2015
6
KNR Constructions | 2QFY2016 Result Update
Investment arguments
Order Book grows 3.5x, gives better revenue visibility
KNR announced large ticket project wins, mainly from the Roads & Highways EPC
space in YTD FY2016. To-date in FY2016, KNR reported `2,591cr worth of project
wins, thereby taking the order backlog to `3,665cr as of 2QFY2016-end (vs
`1,010cr in 4QFY2015-end), which gives better revenue visibility for FY2016-17E.
Exhibit 9: Details of recently won EPC Road projects
Announced
Project Value
Project Details
Stake (%)
On
(` cr)
Upgradation of 3 road stretches across Tamil
13-Apr-15
100%
729
Nadu
2/4 laning of the Madurai- Ramanathapuram
17-Apr-15
100%
937
section (115 kms, NH-49)
14-May-15
4-laning of Kazhakkottam-Mukkola (NH-47)
100%
669
Widen/ Reconstruct 3 road stretches across
8-Jul-15
100%
256
different locations within Madhya Pradesh
Total
2,591
Source: Company, Angel Research
KNR’s Management highlighted that it intends to bid only for Road EPC projects.
The Management maintained optimism that the company would report order wins
of ~`750cr-1,000cr in the remaining part of FY2016E. We expect KNR’s order
inflow growth momentum to continue going forward. For FY2016E/FY2017E, we
expect KNR to report `3,335cr/ `3,500cr worth of project wins across verticals.
Accordingly we expect the order book to report
132.3% CAGR during
FY2015-17E.
~30% & 22% Revenue & PAT CAGR, respectively, during
FY15-17E
KNR reported 2.3% top-line CAGR during FY2011-14, owing to a weak order
inflow scenario. However, with uptick in award activity and recent order wins,
coupled with average execution cycle of ~24-36 months, we expect KNR to report
a strong ~30% revenue CAGR during FY2015-17E to `1,479cr.
During FY2011-15, KNR reported EBITDA margins in the range of 14.4%-17.8%
and PAT margins in the range of 7.0%-8.3%. Assuming KNR would not get any
early completion bonus for its ongoing projects and that it would increase its
dependency on sub-contracting, we model 43bp EBITDA margin decline from
14.4% in FY2015 to 14.0% in FY2017E. Higher interest expenses (owing to stretch
in working capital cycle) and higher tax rate assumption (in FY2016-17E) would
restrict the entire benefits of EBITDA growth from flowing down to the PAT level.
The Management clarified that it is availing tax benefits u/s 80IA. We have
assumed 20.0% and 21.0% tax rate for FY2016E and FY2017E, respectively. As a
result, we have estimated restricted PAT CAGR of 22% over FY2015-17E to
`109cr. PAT margins would decline by 94bp to 7.4% in FY2017E.
November 16, 2015
7
KNR Constructions | 2QFY2016 Result Update
Risks & Concerns
Any change in KNR’s taxation policy or adverse ruling by Tax department
could act as risk to our target price and rating.
KNR is highly dependent on the Roads vertical (accounts for ~98% of the
order book). Delays in award activity and unfavorable changes in the policy
framework, could affect our outlook on KNR.
Delays in execution (vs our estimates) could be a risk to our rating.
Company background
KNR is a Hyderabad based 20+ year old company having executed ~5,888kms
of road projects across 12+ states in India. Over the years, KNR has executed
Roads & Highways, Irrigation, and Bridges & Flyover projects. KNR also has a
quarrying division, which ensures timely supply of stone aggregates at project
locations. KNR over the years has evolved from a smaller sized Roads & Highways-
Engineering Procurement and Construction (EPC) player to a large one by
executing projects timely and building its qualification criterion. As of now, KNR
has executed projects for a diversified range of clients namely, NHAI, KSHIP,
MPRDCL, UPSHA, EIL, Sadbhav Engineering and GMR, amongst others.
In addition to the EPC business, KNR has 4 Build Operate Transfer (BOT) projects
in its kitty, with 3 of them operational and the 4rd one soon to be operational.
As of 2QFY2016-end, KNR had an order book of ~`3,665cr, which gives revenue
visibility for next few quarters. The Roads & Highways vertical accounts for ~98%
of the order book.
November 16, 2015
8
KNR Constructions | 2QFY2016 Result Update
Profit and Loss Statement (Standalone)
Y/E March (` cr)
FY13
FY14
FY15
FY16E
FY17E
Net Sales
689
837
876
937
1,470
% Chg
(8.1)
21.5
4.7
7.0
56.8
Total Expenditure
576
709
750
803
1,264
Cost of RM Consumed
202
291
337
361
560
Sub-Contracting Expenses
274
282
260
296
485
Employee benefits Expense
30
35
38
39
54
Other Expenses
70
101
115
106
165
EBITDA
113
128
126
134
205
% Chg
(14.9)
13.3
(1.6)
6.4
53.0
EBIDTA %
16.4
15.3
14.4
14.3
14.0
Depreciation
56
57
54
57
62
EBIT
57
71
72
77
143
% Chg
(29.6)
23.5
1.7
6.6
86.6
Interest and Financial Charges
11
17
12
15
18
Other Income
21
13
13
20
12
PBT
67
67
72
81
137
Tax
15
6
(1)
(13)
29
% of PBT
22.2
8.8
(1.0)
(16.2)
21.0
PAT before Exceptional item
52
61
73
94
109
Exceptional item
0
0
0
0
0
PAT
52
61
73
94
109
% Chg
(1.2)
17.0
19.7
28.9
15.4
PAT %
7.6
7.3
8.3
10.0
7.4
Basic EPS
18.5
21.7
26.0
33.5
38.6
Diluted EPS
18.5
21.7
26.0
33.5
38.6
% Chg
(1.2)
16.9
19.8
28.9
15.4
November 16, 2015
9
KNR Constructions | 2QFY2016 Result Update
Balance Sheet (Standalone)
Y/E March (` cr)
FY13
FY14
FY15
FY16E
FY17E
Sources of Funds
Equity Capital
28
28
28
28
28
Reserves Total
428
485
541
628
728
Networth
456
513
569
656
757
Total Debt
67
58
88
87
124
Other Long-term Liabilities
138
100
69
97
101
Deferred Tax Liability
0
0
0
0
0
Total Liabilities
661
671
726
840
982
Application of Funds
Gross Block
508
525
543
577
616
Accumulated Depreciation
218
262
316
373
435
Net Block
290
264
227
204
181
Capital WIP
4
0
0
0
0
Investments
48
40
32
85
89
Current Assets
Inventories
30
34
36
37
60
Sundry Debtors
121
117
177
227
399
Cash and Bank Balance
7
11
16
17
26
Loans & Advances
328
229
241
342
524
Current Liabilities
293
283
277
357
584
Net Current Assets
194
108
192
265
424
Other Assets
125
259
276
285
287
Total Assets
661
671
726
840
982
November 16, 2015
10
KNR Constructions | 2QFY2016 Result Update
Cash Flow Statement (Standalone)
Y/E March (` cr)
FY13
FY14
FY15
FY16E
FY17E
Profit before tax
67
67
72
81
137
Dep. & Other Non-cash Charges
56
57
54
57
62
Change in Working Capital
(106)
16
(98)
(53)
(147)
Interest & Financial Charges
11
16
12
48
32
Direct taxes paid
(27)
(24)
(22)
(28)
(48)
Cash Flow from Operations
1
133
18
105
36
(Inc)/ Dec in Fixed Assets
(38)
(25)
(16)
(28)
(37)
(Inc)/ Dec in Investments
(20)
(55)
(9)
(55)
(4)
Cash Flow from Investing
(58)
(80)
(25)
(82)
(42)
Issue/ (Buy Back) of Equity
0
0
0
0
0
Inc./ (Dec.) in Loans
71
(32)
36
0
41
Dividend Paid (Incl. Tax)
(3)
(3)
(6)
(7)
(8)
Net Interest Expenses
(11)
(17)
(12)
(15)
(18)
Cash Flow from Financing
57
(52)
18
(22)
14
Inc./(Dec.) in Cash
(0)
1
12
1
9
Opening Cash balances
4
3
4
16
17
Closing Cash balances
3
4
16
17
26
November 16, 2015
11
KNR Constructions | 2QFY2016 Result Update
Key Ratios (Standalone)
Y/E March
FY13
FY14
FY15
FY16E
FY17E
Valuation Ratio (x)
P/E (on FDEPS)
31.3
26.7
22.3
17.3
15.0
P/CEPS
15.1
13.8
12.8
10.8
9.6
Dividend yield (%)
0.0
0.0
0.0
0.0
0.0
EV/Sales
2.4
2.0
1.9
1.8
1.2
EV/EBITDA
14.5
13.3
13.5
12.6
8.4
EV / Total Assets
3.2
2.5
2.5
2.3
2.1
Per Share Data (`)
EPS (fully diluted)
18.5
21.7
26.0
33.5
38.6
Cash EPS
38.3
42.0
45.2
53.9
60.7
DPS
1.0
1.0
1.7
2.2
2.5
Book Value
162
183
202
233
269
Returns (%)
RoCE (Pre-tax)
16.0
15.4
13.8
13.8
19.1
Angel RoIC (Pre-tax)
15.0
14.7
12.9
13.0
17.6
RoE
12.1
12.6
13.5
15.4
15.4
Turnover ratios (x)
Asset Turnover (Gross Block) (X)
1.4
1.6
1.6
1.7
2.5
Inventory / Sales (days)
16
15
15
15
15
Receivables (days)
64
51
74
88
99
Payables (days)
56
34
29
31
34
Leverage Ratios (x)
D/E ratio (x)
0.1
0.1
0.2
0.1
0.2
Interest Coverage Ratio (x)
7.0
4.9
6.9
6.3
8.7
November 16, 2015
12
KNR Constructions | 2QFY2016 Result Update
Research Team Tel: 022 - 39357800
DISCLAIMER
Angel Broking Private Limited (hereinafter referred to as “Angel”) is a registered Member of National Stock Exchange of India Limited,
Bombay Stock Exchange Limited and Metropolitan Stock Exchange of India Limited. It is also registered as a Depository Participant with
CDSL and Portfolio Manager with SEBI. It also has registration with AMFI as a Mutual Fund Distributor. Angel Broking Private Limited is
a registered entity with SEBI for Research Analyst in terms of SEBI (Research Analyst) Regulations, 2014 vide registration number
INH000000164. Angel or its associates has not been debarred/ suspended by SEBI or any other regulatory authority for accessing
/dealing in securities Market. Angel or its associates including its relatives/analyst do not hold any financial interest/beneficial
ownership of more than 1% in the company covered by Analyst. Angel or its associates/analyst has not received any compensation /
managed or co-managed public offering of securities of the company covered by Analyst during the past twelve months. Angel/analyst
has not served as an officer, director or employee of company covered by Analyst and has not been engaged in market making activity
of the company covered by Analyst.
This document is solely for the personal information of the recipient, and must not be singularly used as the basis of any investment
decision. Nothing in this document should be construed as investment or financial advice. Each recipient of this document should
make such investigations as they deem necessary to arrive at an independent evaluation of an investment in the securities of the
companies referred to in this document (including the merits and risks involved), and should consult their own advisors to determine
the merits and risks of such an investment.
Reports based on technical and derivative analysis center on studying charts of a stock's price movement, outstanding positions and
trading volume, as opposed to focusing on a company's fundamentals and, as such, may not match with a report on a company's
fundamentals.
The information in this document has been printed on the basis of publicly available information, internal data and other reliable
sources believed to be true, but we do not represent that it is accurate or complete and it should not be relied on as such, as this
document is for general guidance only. Angel Broking Pvt. Limited or any of its affiliates/ group companies shall not be in any way
responsible for any loss or damage that may arise to any person from any inadvertent error in the information contained in this report.
Angel Broking Pvt. Limited has not independently verified all the information contained within this document. Accordingly, we cannot
testify, nor make any representation or warranty, express or implied, to the accuracy, contents or data contained within this document.
While Angel Broking Pvt. Limited endeavors to update on a reasonable basis the information discussed in this material, there may be
regulatory, compliance, or other reasons that prevent us from doing so.
This document is being supplied to you solely for your information, and its contents, information or data may not be reproduced,
redistributed or passed on, directly or indirectly.
Neither Angel Broking Pvt. Limited, nor its directors, employees or affiliates shall be liable for any loss or damage that may arise from
or in connection with the use of this information.
Note: Please refer to the important ‘Stock Holding Disclosure' report on the Angel website (Research Section). Also, please refer to the
latest update on respective stocks for the disclosure status in respect of those stocks. Angel Broking Pvt. Limited and its affiliates may
have investment positions in the stocks recommended in this report.
Disclosure of Interest Statement
KNR Constructions
1. Analyst ownership of the stock
No
2. Angel and its Group companies ownership of the stock
No
3. Angel and its Group companies' Directors ownership of the stock
No
4. Broking relationship with company covered
No
Note: We have not considered any Exposure below ` 1 lakh for Angel, its Group companies and Directors
Ratings (Based on expected returns
Buy (> 15%)
Accumulate (5% to 15%)
Neutral (-5 to 5%)
over 12 months investment period):
Reduce (-5% to -15%)
Sell (< -15%)
November 16, 2015
13