2QFY2016 Result Update | Cement
November 5, 2015
JK Cement
BUY
CMP
`647
Performance Highlights
Target Price
`744
Quarterly results (Standalone)
Investment Period
12 Months
Y/E March (` cr)
2QFY2016
2QFY2015
% chg yoy 1QFY2016
% chg qoq
Net Sales
868
828
4.8
811
7.1
Stock Info
EBITDA
106
88
21.4
84
26.1
Sector
Cement
EBITDA margin
12.3
10.6
167bp
10.4
185bp
Market Cap (` cr)
4,524
Net Profit
14
32
(57.5)
0
8473.7
Source: Company, Angel Research
Net debt (` cr)
1,700
Beta
0.7
JK Cement (JKCem)’s 2QFY2016 reported numbers have come in better than our
52 Week High / Low
754 / 546
estimates. The company’s net sales grew by 4.8% yoy to `867.9cr (above our
Avg. Daily Volume
52,455
estimate of `832.2cr). The company’s blended sales volume increased by 2.8%
Face Value (`)
10
yoy, led by 4.3% yoy growth in the white cement (including putty) business.
BSE Sensex
26,553
Blended realization/tonne, at `4,743, increased 2.0/6.3% yoy/qoq during the
Nifty
8,040
quarter (above our estimate of `4,596). The EBITDA increased by 21.4% yoy to
Reuters Code
JKCE.BO
`106.4cr, which is above our estimate of `97.1cr. The EBITDA/tonne improved by
Bloomberg Code
JKCE IN
18.1% yoy to `581 and is above our estimate of `536. The Net profit declined
57.5% yoy to `13.7cr, on account of higher depreciation and interest expenses.
Shareholding Pattern (%)
EBITDA margin at 12.3%, up 167bp yoy: For 2QFY2016, JKCem posted a
Promoters
67.0
marginal 4.8% yoy increase in its top-line to `867.9cr. The EBITDA came in at
`106.4cr, an increase of 21.4% yoy (above our estimate of `97.1cr). The EBITDA
MF / Banks / Indian Fls
14.0
margin at 12.3% is above our estimate of 10.8%, led by better than expected
FII / NRIs / OCBs
11.0
realization and flat operating costs. The operating cost/tonne remained flat yoy at
Indian Public / Others
8.1
`4,161. The EBITDA/tonne came in at `581, up by 18.1% yoy, due to increase in
realization and flat operating costs.
Abs.(%)
3m 1yr 3yr
Outlook and valuation: Going ahead, we expect the company to witness
Sensex
(5.4)
(4.7)
41.5
moderation in demand and impact on profitability. The Management has also
JK Cement
(2.8)
(1.9)
128.6
reduced its grey cement volume guidance from 7.5mt to 6.5mt for FY16 due to
soft demand. We forecast top-line to grow at a CAGR of 18.4% and EBIDTA to
grow at CAGR of 33.3% over FY2015-17E. At the current market price, the stock
3-year price chart
900
trades at 7.8x FY2017E EV/EBIDTA and EV/tonne of $96 on FY2017E blended
800
capacity. We maintain our Buy rating on the stock with a target price of `744
700
based on 8.0x grey cement and 9.5x white cement FY2017 EV/EBIDTA.
600
Key Financials
500
400
Y/E March (` cr)
FY2013
FY2014
FY2015
FY2016E
FY2017E
300
Net Sales
2,904
2,782
3,337
3,661
4,613
200
% chg
1442.9
(421.8)
1998.1
971.2
2597.8
100
Net Profit
234
97
157
128
297
% chg
26.1
(58.5)
61.7
(18.5)
132.0
EPS (`)
33
14
22
18
42
Source: Company, Angel Research
P/E (x)
19.4
46.6
28.8
35.4
15.3
P/BV (x)
2.7
2.6
2.7
2.6
2.3
RoE (%)
16.9
6.4
9.8
7.5
16.0
RoCE (%)
13.3
5.8
6.9
8.3
13.6
Shrenik C. Gujrathi
EV/Sales (x)
1.9
1.9
1.9
1.7
1.3
022-39357800 Extn: 6872
EV/EBITDA (x)
9.8
14.9
14.2
11.5
7.8
Source: Company, Angel Research; Note: CMP as of November 4, 2015
Please refer to important disclosures at the end of this report
1
JK Cement | 2QFY2016 Result Update
Exhibit 1: Quarterly Performance (Standalone)
Y/E March (` cr)
2QFY2016
2QFY2015
% Chg
1QFY2016
% Chg
1HFY2016
1HFY2015
% Chg
Net sales
868
828
4.8
811
7.1
1,679
1,629
3.0
Net raw-material costs
178
161
10.4
155
14.6
340
291
16.7
(% of sales)
20.5
19.4
19.1
20.2
17.9
Power & fuel
194
198
(1.9)
179
8.6
372
392
(4.9)
(% of sales)
22.3
23.9
22.0
22.2
24.1
Staff costs
57
49
16.7
60
(4.9)
117
97
20.2
(% of sales)
6.5
5.9
7.4
6.9
6.0
Freight & forwarding
180
179
0.2
178
1.2
357
357
0.1
(% of sales)
20.7
21.7
21.9
21.3
21.9
Other expenses
153
153
(0.2)
155
(1.3)
308
306
0.9
(% of sales)
17.6
18.5
19.1
18.4
18.8
EBITDA
106
88
21.4
84
26.1
191
186
2.5
EBITDA margin
12.3
10.6
167bp
10.4
185bp
11.4
11.4
(6bp)
Interest
69
46
49.5
66
4.2
135
87
56.4
Depreciation
38
30
29.0
37
4.5
75
58
28.7
Other income
15
16
(6.9)
17
(14.2)
32
32
1.7
PBT (excl. Exp. Items)
14
28
(49.7)
(1)
13
73
(82.4)
Exp. Item
0
0
0
-
-
PBT (incl. Exp. Items)
14
28
(49.7)
(1)
13
73
(82.4)
Provision for taxation
0
(5)
(1.3)
(1)
3
(% of PBT)
1.9
(16)
114.4
(7.8)
3.8
Adjusted PAT
137
323
(57.5)
2
8,473.7
14
70
(80.3)
PATM
1.6
3.9
(232bp)
0.0
156bp
0.8
4.3
(349bp)
EPS (`)
2.0
4.6
0.0
2.0
1.0
Source: Company, Angel Research
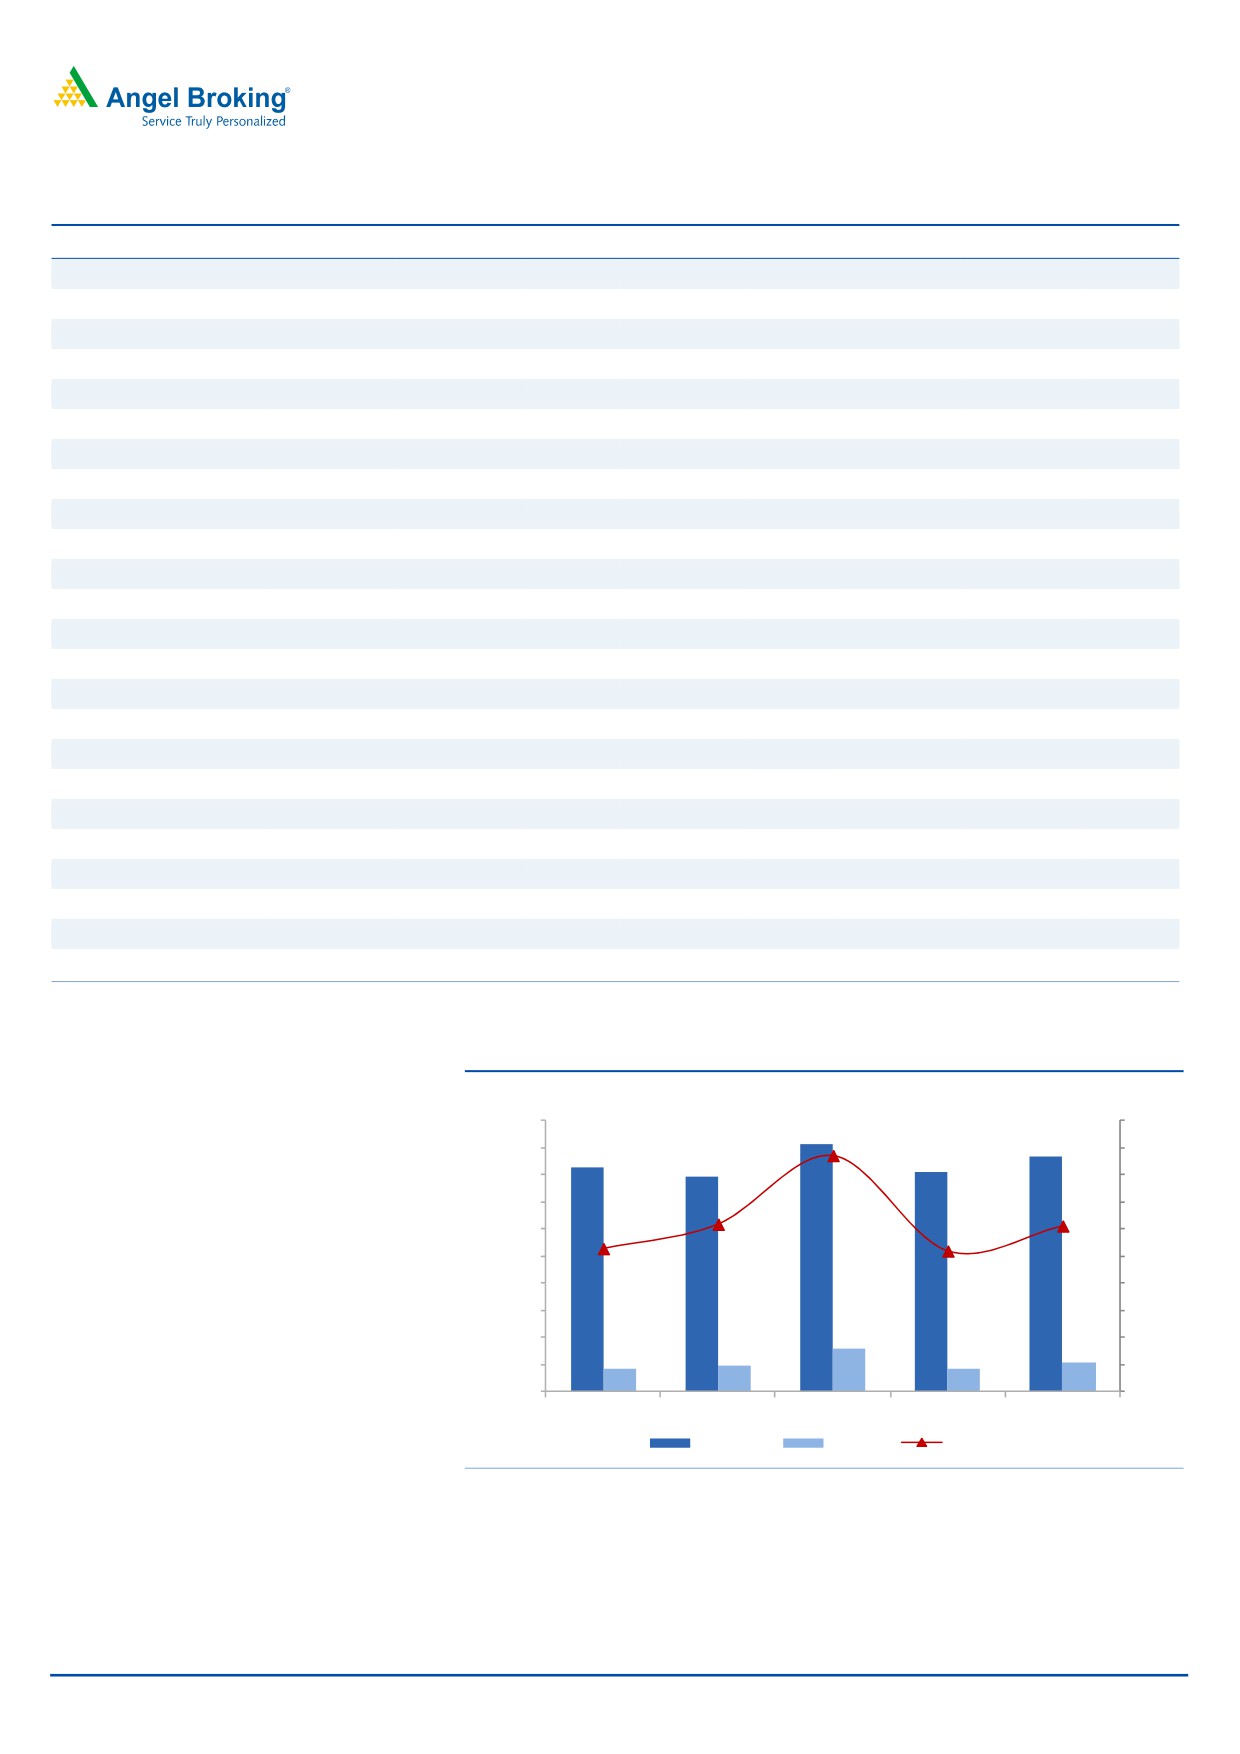
Exhibit 2: Financial performance
(` cr)
(%)
1000
20.0
911
17.5
868
900
828
18.0
797
811
800
16.0
700
14.0
600
12.4
10.4
12.3
12.0
10.6
500
10.0
400
8.0
300
6.0
159
200
4.0
99
106
88
84
100
2.0
0
0.0
2QFY15
3QFY15
4QFY15
1QFY16
2QFY16
Net sales
EBITDA
EBITDAM
Source: Company, Angel Research
November 5, 2015
2
JK Cement | 2QFY2016 Result Update
Performance highlights
Top-line up 4.8% yoy
For 2QFY2016, JKCem posted a 4.8% yoy increase in its top-line to `867.9cr,
which is above our estimate of `832.2cr. Blended cement volumes rose by 2.8%
yoy to 1.8mn tonne (in line with our estimate), while blended realization/tonne
increased by 2.0/6.3% yoy/qoq to `4,743 (above our estimate of `4,596).
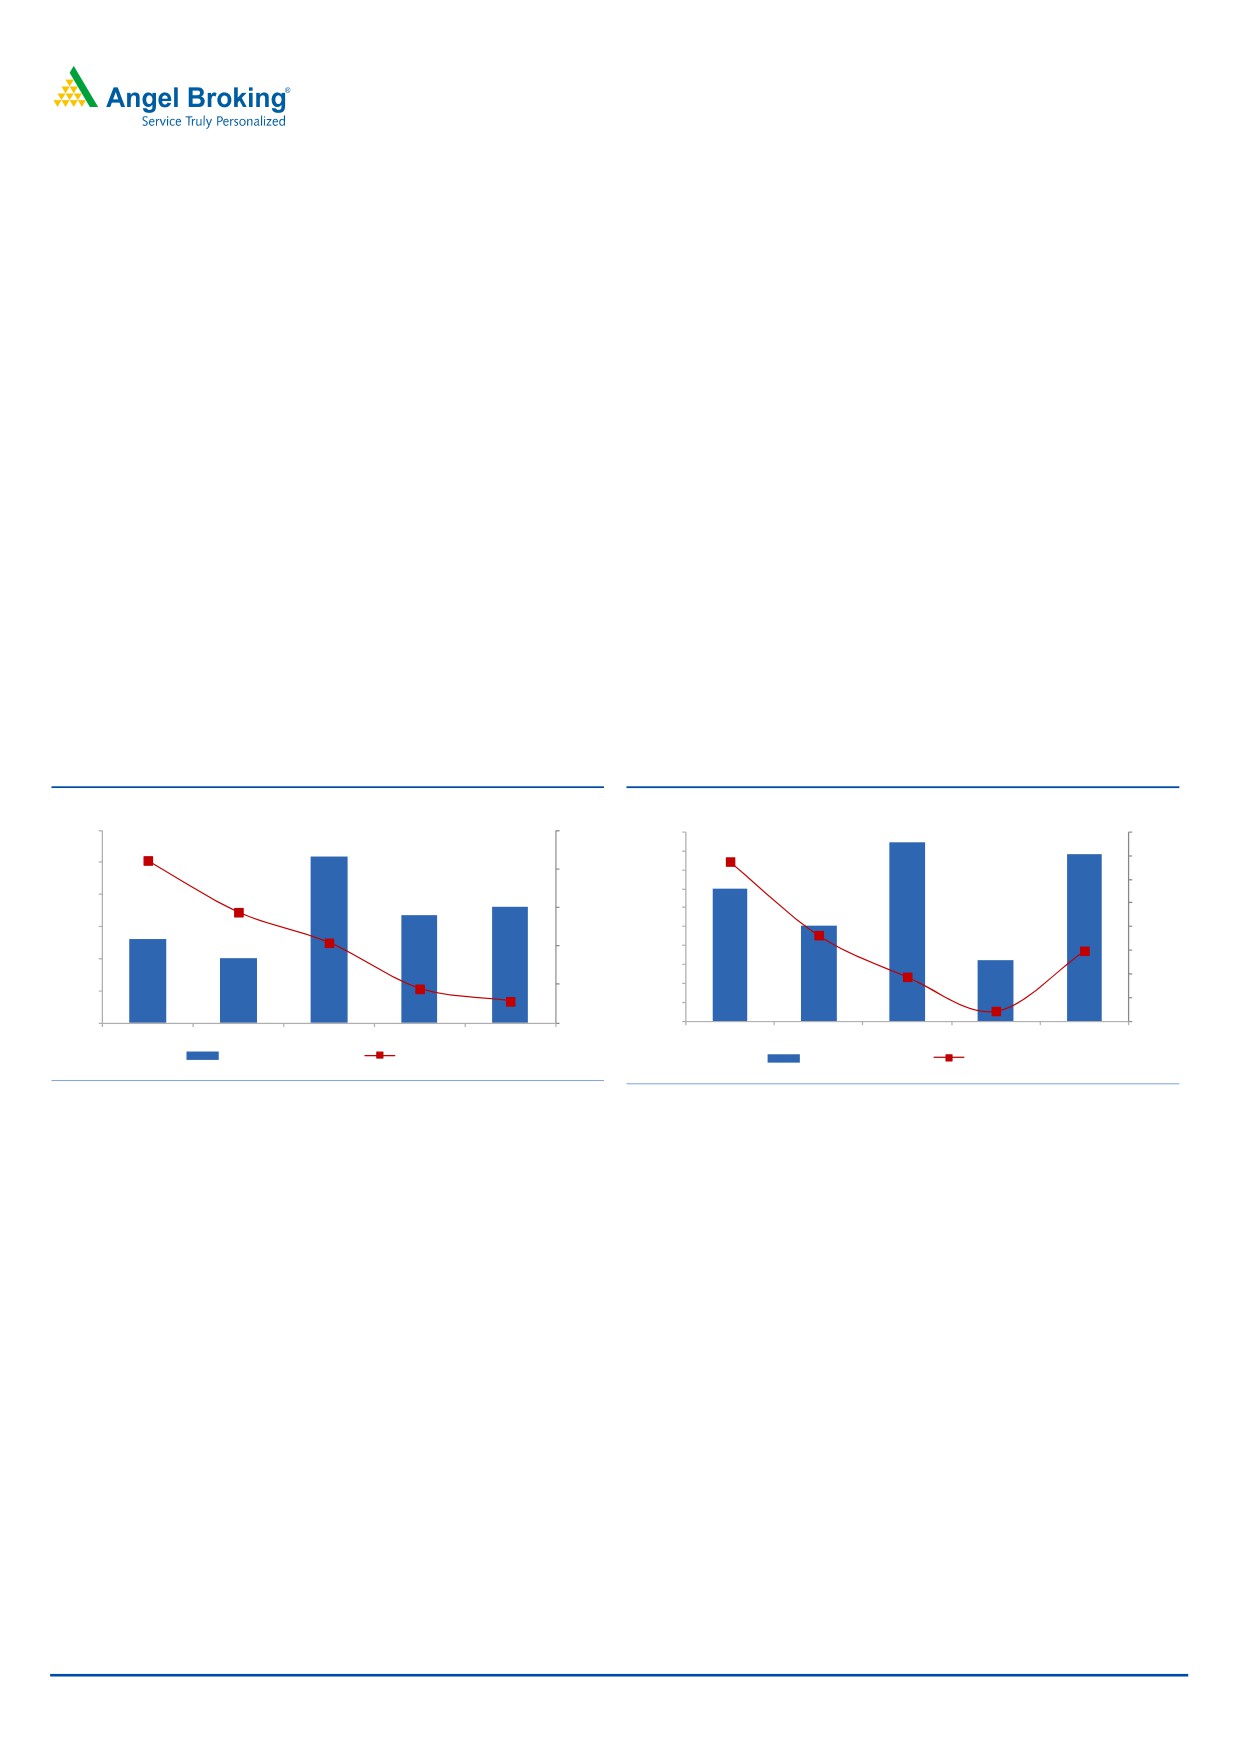
Revenue from grey cement improved by 3.4% yoy to `605cr, led by 2.8% yoy
volume growth, while realization/tonne remained flat at `3806. Muted volume
growth was due to weak demand in the North while demand pressures in
Maharashtra
((JKCem sells
60% of its south based plant’s production in
Maharashtra) impacted volumes in the South. White cement volume increased by
4.3% yoy to 0.24mn, mainly led the putty segment, which grew by 21.4% yoy to
0.12mn tonne during the quarter as against 0.13mn tonne in 2QFY2015. White
cement realization/tonne improved by 3.9% yoy to `10,934. Going forward, we
expect blended cement volume to grow at a CAGR of 12.8% over FY2015-17E.
We expect grey cement volumes to grow at a CAGR of 13.9% and white cement
volumes to grow at a CAGR of 4.3% over FY2015-2017E.
Exhibit 3: Blended Cement Volume Trend
Exhibit 4: Blended Realization Trend
(mn
tn)
(%)
(`/tonne)
(%)
1.95
25.0
4,800
4,772
12.0
1.91
4,743
21.1
4,750
10.0
1.90
9.5
20.0
4,700
4,651
8.0
1.85
1.83
4,650
14.4
6.0
1.82
15.0
4,600
1.80
1.78
4,550
4,552
4.0
10.4
3.3
1.75
10.0
4,500
4,462
2.0
2.0
1.75
4,450
4.4
(0.2)
0.0
5.0
4,400
1.70
-2.0
2.8
4,350
(3.1)
1.65
0.0
4,300
-4.0
2QFY15
3QFY15
4QFY15
1QFY16
2QFY16
2QFY15
3QFY15
4QFY15
1QFY16
2QFY16
Blended sales volume
% change (yoy)
Blended Realization
% change (yoy)
Source: Company, Angel Research
Source: Company, Angel Research
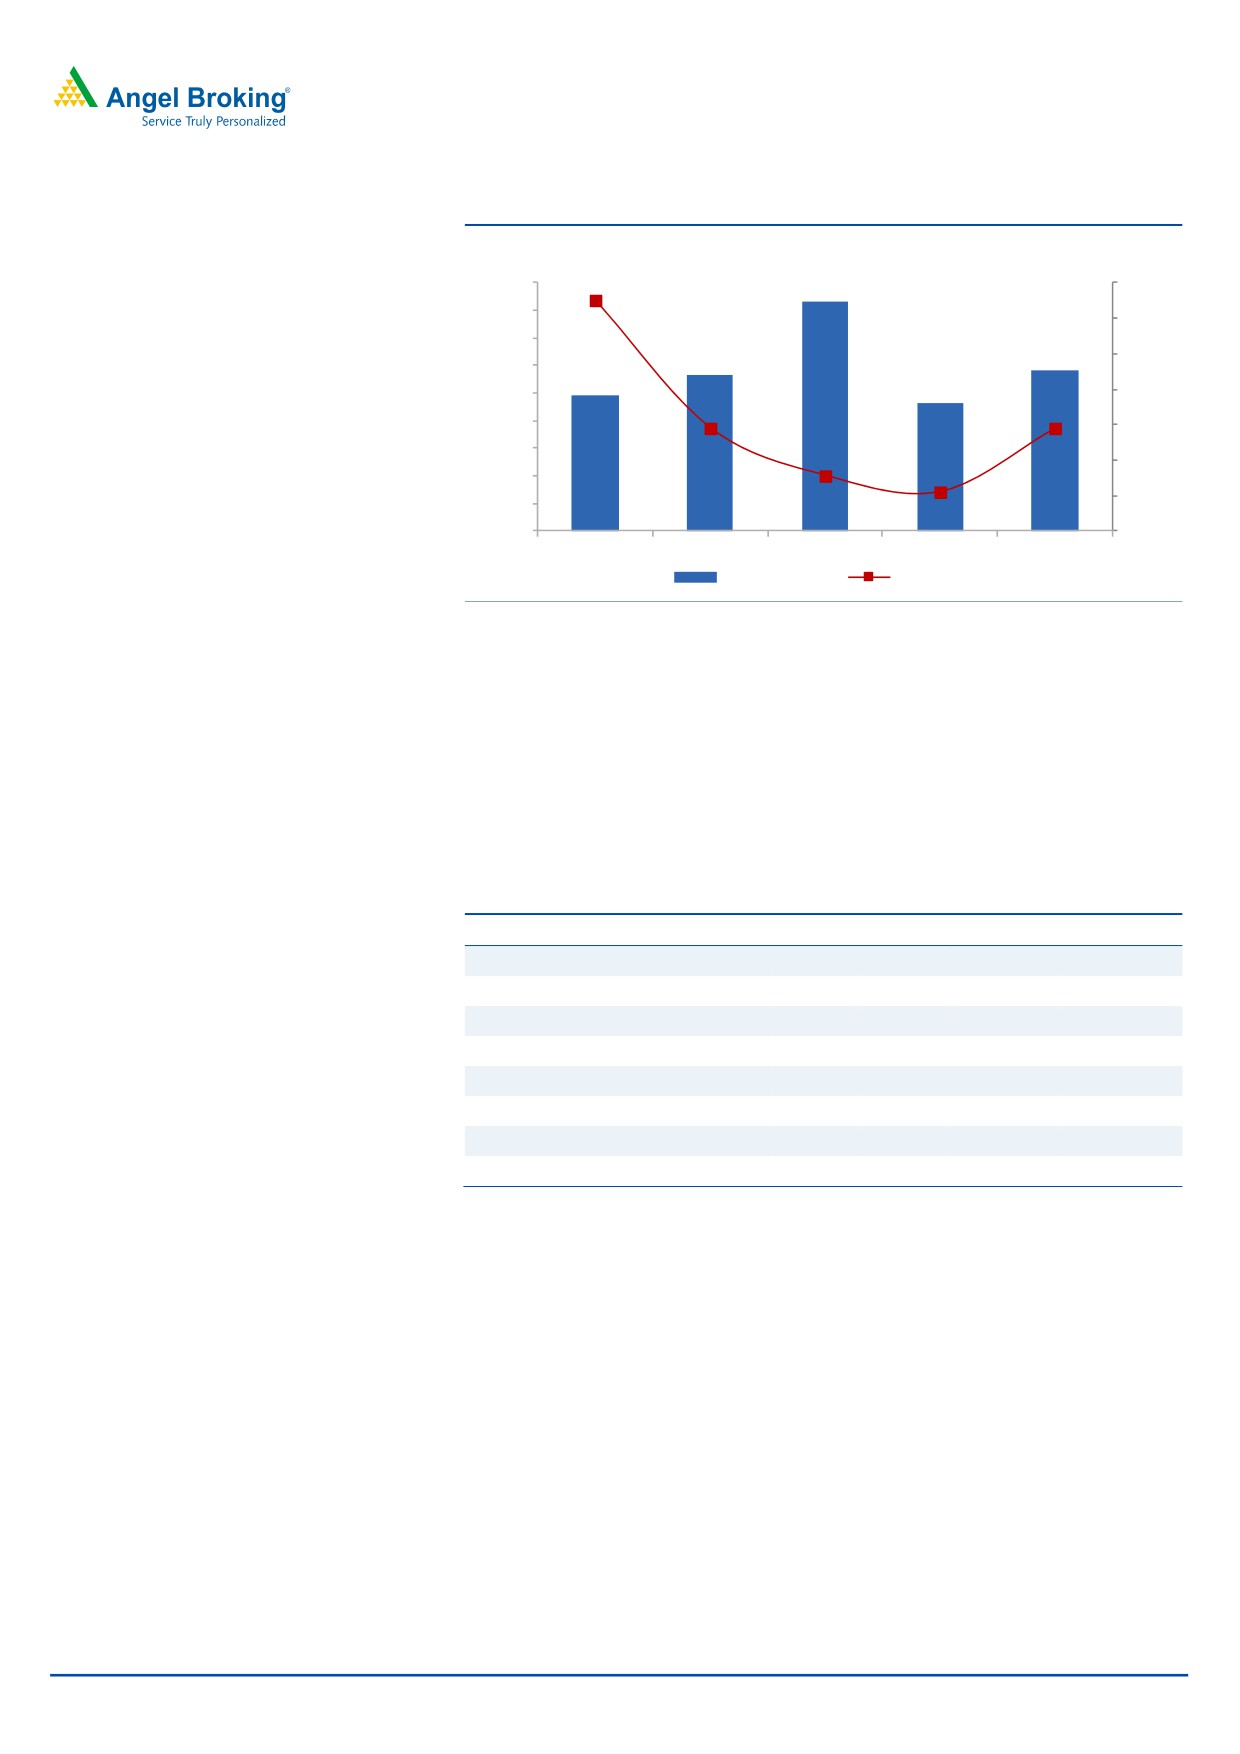
EBITDA margin improved by 167bp yoy to 12.3%
The EBITDA margin for the quarter improved by 167bp yoy to 12.3% on account
of higher realization and flat operating expenses. The company’s operating cost/
tonne remained flat yoy to `4,161, due to fall in power & fuel and freight
expenses. Thus, the blended EBITDA/tonne rose by 18.1% yoy to `581. However,
on a segmental basis, grey cement EBIDTA increased by 45.9% yoy to `40.2cr.
EBITDA/tonne increased by 42.3% yoy to `253. White cement EBIDTA grew by
10.1% yoy and came in at `66.2cr. EBIDTA/tonne for white cement grew by 5.6%
yoy to `2,758, during the quarter.
November 5, 2015
3
JK Cement | 2QFY2016 Result Update
Exhibit 5: Blended EBITDA/tonne trend
(%)
(`/tonne)
900
833
100.0
90.3
800
80.0
700
581
60.0
564
600
492
465
40.0
500
400
20.0
18.0
18.1
300
0.0
200
(8.8)
(17.9)
(20.0)
100
0
(40.0)
2QFY15
3QFY15
4QFY15
1QFY16
2QFY16
EBITDA/tonne
% change (yoy)
Source: Company, Angel Research
Per tonne analysis
During 2QFY2016, JKCem’s raw material cost/tonne increased by 2.0% yoy. The
power and fuel cost/tonne declined by 4.6% yoy. Freight cost/tonne also reduced,
ie by 2.6% yoy. However employee cost/tonne rose by 13.6% yoy to `311. The
total operating cost/tonne remained flat yoy to `4,161. The company’s operating
profit/tonne increased by 18.1% yoy to `581, during the quarter.
Exhibit 6: Per tonne analysis
Particulars (`/tonne)
2QFY16
2QFY15
1QFY16
yoy chg (%) qoq chg (%)
Net Realization/tone
4,743
4,651
4,462
2.0
6.3
Raw-Material* Cost/tone
970
903
853
7.4
13.8
Power and Fuel cost/tonne
1,059
1,110
983
(4.6)
7.8
Employee Cost/tone
311
274
329
13.6
(5.6)
Freight Cost/tone
982
1,008
977
(2.6)
0.5
Other Cost/tone
837
862
854
(2.9)
(2.0)
Operating costs/tone
4,161
4,159
3,997
0.1
4.1
Operating Profit/tone
581
492
465
18.1
25.2
Source: Company, Angel Research; Note Incl. Raw materials and purchase of stock in trade
Outlook and valuation
Going ahead, we expect the company to witness moderation in demand and
impact on profitability. The Management has also reduced its grey cement volume
guidance from 7.5mt to 6.5mt for FY16 due to soft demand. We forecast the
top-line to grow at a CAGR of 18.4% and EBIDTA to grow at CAGR of 33.3% over
FY2015-17E. At the current market price, the stock trades at 7.8x its FY2017E
EV/EBIDTA and at an EV/tonne of $96 on FY2017E blended capacity. We
maintain our Buy rating on the stock with a target price of `744, based on 8.0x
grey cement and 9.5x white cement FY2017E EV/EBIDTA.
November 5, 2015
4
JK Cement | 2QFY2016 Result Update
Company Background
JK Cement is one of the leading cement producers in India with installed grey
cement capacity of 10.5mtpa (7.5mtpa capacity is located in the North region
[Rajasthan and Haryana] and the remaining 3mtpa capacity is located in the South
region [Karnataka]). JKCem is the second largest white cement producer in India
with installed capacity of 0.6mtpa. The company also has a 0.5mtpa wall putty
capacity in Gotan, Rajasthan. It also has a 0.6mtpa white cement plant in UAE to
tap the growing Middle East and African markets. JKCem was the first company to
install a captive power plant in 1987 at Rajasthan and now it has a total power
capacity of 140MW. The company sells cement under the brands of JK Cement
and JK Super Cement.
Exhibit 7: Plant Locations
Grey Cement Capacity
Plant Location
State
Region
Capacity (MTPA)
Nimbahera
Rajasthan
North
3.25
Mangrol*
Rajasthan
North
2.25
Gotan
Rajasthan
North
0.5
Jhajjar*
Haryana
North
1.5
Muddapur
Karnataka
South
3
Total Grey Cement Capacity
10.5
White Cement Capacity
Plant Location
State
Region
Capacity (MTPA)
Gotan
Rajasthan
North
0.6
UAE
0.6
Total White Cement Capacity
1.2
Source: Company, Angel Research; Note: *New capacity (1.5mtpa at each location) added during
1HFY2015.
November 5, 2015
5
JK Cement | 2QFY2016 Result Update
Profit & Loss Statement (Standalone)
Y/E March (` cr)
FY2013
FY2014
FY2015
FY2016E
FY2017E
Net Sales
2,904
2,782
3,337
3,661
4,613
% chg
14.4
(4.2)
20.0
9.7
26.0
Total Expenditure
2,352
2,421
2,893
3,113
3,824
Net Raw Materials
362
425
556
607
743
Power & Fuel cost
714
674
793
866
1,050
Personnel
158
168
203
205
258
Other
1,118
1,155
1,341
1,435
1,772
EBITDA
552
361
444
549
789
% chg
8.7
(34.7)
23.1
23.6
43.8
(% of Net Sales)
19.0
13.0
13.3
15.0
17.1
Depreciation&
128
134
137
180
190
Amortisation
EBIT
424
227
307
369
599
% chg
10.9
(46.5)
35.6
20.0
62.3
(% of Net Sales)
14.6
8.1
9.2
10.1
13.0
Interest & other Charges
140
153
219
268
236
Other Income
57
62
71
59
33
(% of PBT)
16.6
45.7
44.7
37.0
8.2
Recurring PBT
341
136
159
160
395
% chg
16.0
(60.0)
16.8
0.4
147.5
Extraordinary
-
-
-
-
-
Expense/(Inc.)
PBT (reported)
341
136
159
160
395
Tax
107
39
2
32
99
(% of PBT)
31.4
28.8
1.4
20.0
25.0
PAT (reported)
234
97
157
128
297
ADJ. PAT
234
97
157
128
297
% chg
26.1
(58.5)
61.7
(18.5)
132.0
(% of Net Sales)
8.0
3.5
4.7
3.5
6.4
Basic EPS (`)
33
14
22
18
42
Fully Diluted EPS (`)
33
14
22
18
42
November 5, 2015
6
JK Cement | 2QFY2016 Result Update
Balance Sheet (Standalone)
Y/E March (` cr)
FY2013
FY2014
FY2015
FY2016E FY2017E
SOURCES OF FUNDS
Equity Share Capital
70
70
70
70
70
Reserves& Surplus
1,627
1,689
1,577
1,674
1,899
Shareholders Funds
1,697
1,758
1,647
1,744
1,969
Total Loans
1,272
2,320
2,422
2,242
2,042
Deferred Tax Liability
249
268
280
280
280
Other Long term liabilities
87
97
117
117
117
Total Liabilities
3,305
4,445
4,465
4,382
4,408
APPLICATION OF FUNDS
Gross Block
3,087
3,180
4,342
4,492
4,642
Less: Acc. Depreciation
722
868
1,004
1,184
1,374
Net Block
2,364
2,313
3,338
3,308
3,268
Capital Work-in-Progress
108
1,102
191
191
191
Investments
169
300
315
315
315
Current Assets
1,261
1,389
1,504
1,348
1,492
Inventories
461
542
510
551
673
Sundry Debtors
115
112
139
153
193
Cash
332
348
408
205
184
Loans & Advances
345
373
438
430
432
Other
7
14
10
10
10
Current liabilities
597
658
883
780
858
Net Current Assets
664
731
622
569
634
Total Assets
3,305
4,445
4,465
4,382
4,408
November 5, 2015
7
JK Cement | 2QFY2016 Result Update
Cash Flow Statement (Standalone)
Y/E March (` cr)
FY2013
FY2014
FY2015
FY2016E FY2017E
Profit before tax
341
136
159
160
525
Depreciation
128
134
137
180
190
Change in Working Capital
(123)
(51)
169
(149)
(87)
Less: Other income
57
62
71
59
33
Direct taxes paid
107
39
2
32
99
Cash Flow from Operations
182
117
391
99
497
(Inc)/ Decin Fixed Assets
(209)
(1,088)
(251)
(150)
(150)
(Inc)/ Dec in Investments
(158)
(130)
(15)
-
-
Other income
57
62
71
59
33
Cash Flow from Investing
(311)
(1,156)
(195)
(91)
(117)
Issue of Equity
Inc./(Dec.) in loans
84
1,078
133
(180)
(200)
Dividend Paid (Incl. Tax)
53
25
34
31
71
Others
2
(0)
235
-
129
Cash Flow from Financing
28
1,054
(136)
(211)
(401)
Inc./(Dec.) in Cash
(100)
15
60
(203)
(21)
Opening Cash balances
433
332
348
408
205
Closing Cash balances
332
348
408
205
184
November 5, 2015
8
JK Cement | 2QFY2016 Result Update
Key Ratios (Standalone)
Y/E March
FY2013
FY2014
FY2015
FY2016E
FY2017E
Valuation Ratio (x)
P/E (on FDEPS)
19.4
46.6
28.8
35.4
15.3
P/CEPS
12.5
19.6
15.4
14.7
9.3
P/BV
2.7
2.6
2.7
2.6
2.3
Dividend yield (%)
1.0
0.5
0.6
0.6
1.3
EV/Sales
1.9
1.9
1.9
1.7
1.3
EV/EBITDA
9.8
14.9
14.2
11.5
7.8
EV / Total Assets
1.6
1.2
1.4
1.4
1.4
Per Share Data (`)
EPS (Basic)
33.4
13.9
22.4
18.3
42.4
EPS (fully diluted)
33.4
13.9
22.4
18.3
42.4
Cash EPS
51.7
33.0
42.0
44.0
69.6
DPS
6.5
3.0
4.0
3.7
8.5
Book Value
242.7
251.5
235.5
249.3
281.6
Dupont Analysis
EBIT margin
14.6
8.1
9.2
10.1
13.0
Tax retention ratio
68.6
71.2
98.6
80.0
75.0
Asset turnover (x)
1.0
0.8
0.8
0.9
1.1
ROIC (Post-tax)
10.4
4.6
7.4
7.2
10.7
Cost of Debt (Post Tax)
7.7
6.0
9.1
9.2
8.3
Leverage (x)
0.5
0.7
1.0
1.0
0.9
Operating ROE
11.7
3.5
5.8
5.1
12.8
Returns (%)
ROCE (Pre-tax)
13.3
5.8
6.9
8.3
13.6
Angel ROIC (Pre-tax)
16.2
8.4
9.8
10.2
16.2
ROE
16.9
6.4
9.8
7.5
16.0
Turnover ratios (x)
Asset Turnover (Gross Block)
1.0
0.9
0.9
0.8
1.0
Inventory / Sales (days)
52
66
58
53
48
Receivables (days)
13
15
14
15
14
Payables (days)
87
95
97
97
78
WC cycle (ex-cash) (days)
34
47
33
29
32
Solvency ratios (x)
Net debt to equity
0.5
1.0
1.0
1.0
0.8
Net debt to EBITDA
1.4
4.6
3.8
3.1
2.0
Interest Coverage (EBIT / Int.)
3.0
1.5
1.4
1.4
2.5
November 5, 2015
9
JK Cement | 2QFY2016 Result Update
Research Team Tel: 022 - 39357800
DISCLAIMER
Angel Broking Private Limited (hereinafter referred to as “Angel”) is a registered Member of National Stock Exchange of India Limited,
Bombay Stock Exchange Limited and Metropolitan Stock Exchange of India Limited. It is also registered as a Depository Participant with
CDSL and Portfolio Manager with SEBI. It also has registration with AMFI as a Mutual Fund Distributor. Angel Broking Private Limited is
a registered entity with SEBI for Research Analyst in terms of SEBI (Research Analyst) Regulations, 2014 vide registration number
INH000000164. Angel or its associates has not been debarred/ suspended by SEBI or any other regulatory authority for accessing
/dealing in securities Market. Angel or its associates including its relatives/analyst do not hold any financial interest/beneficial
ownership of more than 1% in the company covered by Analyst. Angel or its associates/analyst has not received any compensation /
managed or co-managed public offering of securities of the company covered by Analyst during the past twelve months. Angel/analyst
has not served as an officer, director or employee of company covered by Analyst and has not been engaged in market making activity
of the company covered by Analyst.
This document is solely for the personal information of the recipient, and must not be singularly used as the basis of any investment
decision. Nothing in this document should be construed as investment or financial advice. Each recipient of this document should
make such investigations as they deem necessary to arrive at an independent evaluation of an investment in the securities of the
companies referred to in this document (including the merits and risks involved), and should consult their own advisors to determine
the merits and risks of such an investment.
Reports based on technical and derivative analysis center on studying charts of a stock's price movement, outstanding positions and
trading volume, as opposed to focusing on a company's fundamentals and, as such, may not match with a report on a company's
fundamentals.
The information in this document has been printed on the basis of publicly available information, internal data and other reliable
sources believed to be true, but we do not represent that it is accurate or complete and it should not be relied on as such, as this
document is for general guidance only. Angel Broking Pvt. Limited or any of its affiliates/ group companies shall not be in any way
responsible for any loss or damage that may arise to any person from any inadvertent error in the information contained in this report.
Angel Broking Pvt. Limited has not independently verified all the information contained within this document. Accordingly, we cannot
testify, nor make any representation or warranty, express or implied, to the accuracy, contents or data contained within this document.
While Angel Broking Pvt. Limited endeavors to update on a reasonable basis the information discussed in this material, there may be
regulatory, compliance, or other reasons that prevent us from doing so.
This document is being supplied to you solely for your information, and its contents, information or data may not be reproduced,
redistributed or passed on, directly or indirectly.
Neither Angel Broking Pvt. Limited, nor its directors, employees or affiliates shall be liable for any loss or damage that may arise from
or in connection with the use of this information.
Note: Please refer to the important ‘Stock Holding Disclosure' report on the Angel website (Research Section). Also, please refer to the
latest update on respective stocks for the disclosure status in respect of those stocks. Angel Broking Pvt. Limited and its affiliates may
have investment positions in the stocks recommended in this report.
Disclosure of Interest Statement
JK Cement
1. Analyst ownership of the stock
No
2. Angel and its Group companies ownership of the stock
No
3. Angel and its Group companies' Directors ownership of the stock
No
4. Broking relationship with company covered
No
Note: We have not considered any Exposure below ` 1 lakh for Angel, its Group companies and Directors
Ratings (Based on expected returns
Buy (> 15%)
Accumulate (5% to 15%)
Neutral (-5 to 5%)
over 12 months investment period):
Reduce (-5% to -15%)
Sell (< -15)
November 5, 2015
10