1QFY2017 Result Update | IT
July 20, 2016
Infosys
BUY
CMP
`1,082
Performance highlights
Target Price
`1,370
(` cr)
1QFY17
4QFY16
% chg (qoq)
1QFY16
% chg (yoy)
Investment Period
12 Months
Net revenue
16,782
16,550
1.4
14,354
16.9
EBITDA
4,450
4,589
(3.0)
3,758
18.4
EBITDA margin (%)
26.5
27.7
51bp
26.2
2bp
Stock Info
PAT
3,436
3,597
(4.5)
3,030
13.4
Sector
IT
Source: Company, Angel Research
Market Cap (` cr)
248,461
Net Debt (` cr)
(30,250)
Infosys’ numbers for 1QFY2017 have come in lower than our expectations. Its
Beta
0.8
revenues grew 2.2% on a sequential basis to US$2,501mn (V/s US$2,548mn
52 Week High / Low
1,278/987
expected); the growth was mostly volume led. In INR terms, revenues came in at
`16,782cr (V/s `17,072cr expected), up 1.4% qoq. In constant currency (CC)
Avg. Daily Volume
225,158
terms, sales grew 1.7% qoq. On the operating front, the EBDITA and EBIT
Face Value (`)
5
margins dipped by ~121bp qoq and ~140bp qoq to 26.5% and 24.1%
BSE Sensex
27,747
respectively. Consequently, the PAT de-grew by 4.5% qoq to `3,436cr (V/s
Nifty
8,509
`3,514cr expected). The FY2017 revenue guidance has been revised to 10.5%-
Reuters Code
INFY.BO
12.0% in CC terms. We maintain our Buy rating on the stock with a target price
Bloomberg Code
INFY@IN
of `1,370.
Quarterly highlights: The company’s revenues for the quarter grew 2.2% on a
Shareholding Pattern (%)
sequential basis to US$2,501mn (V/s US$2,548mn expected) with the growth
Promoters
12.8
mostly being led by volumes. In INR terms, revenues came in at `16,782cr (V/s
MF / Banks / Indian Fls
18.0
`17,072cr expected), up 1.4% qoq. In CC terms, sales grew 1.7% qoq. In terms
FII / NRIs / OCBs
58.8
of geographies, USA, Europe, and RoW posted a CC qoq growth of 2.4%,
Indian Public / Others
10.4
(0.3)%, and 4.9% respectively, while India dipped by 8.2% qoq on a CC basis
during the quarter. In terms of verticals, FSI posted a CC qoq growth of 1.7%,
and Manufacturing & Hi-Tech posted a CC qoq growth of 2.4%. On the
Abs.(%)
3m 1yr
3yr
operating front, the EBDITA and EBIT margins dipped by ~121bp qoq and
Sensex
7.5
(2.5)
37.8
~140bp qoq to 26.5% and 24.1% respectively. Consequently, the PAT de-grew
Infosys
(12.7)
8.0
54.6
by 4.5% qoq to `3,436cr (V/s `3,514cr expected).
Outlook and valuation: Following a soft start to the year, Infosys cut its FY2017
revenue growth guidance to 10.5-12.0% in CC terms from 11.5-13.5% earlier.
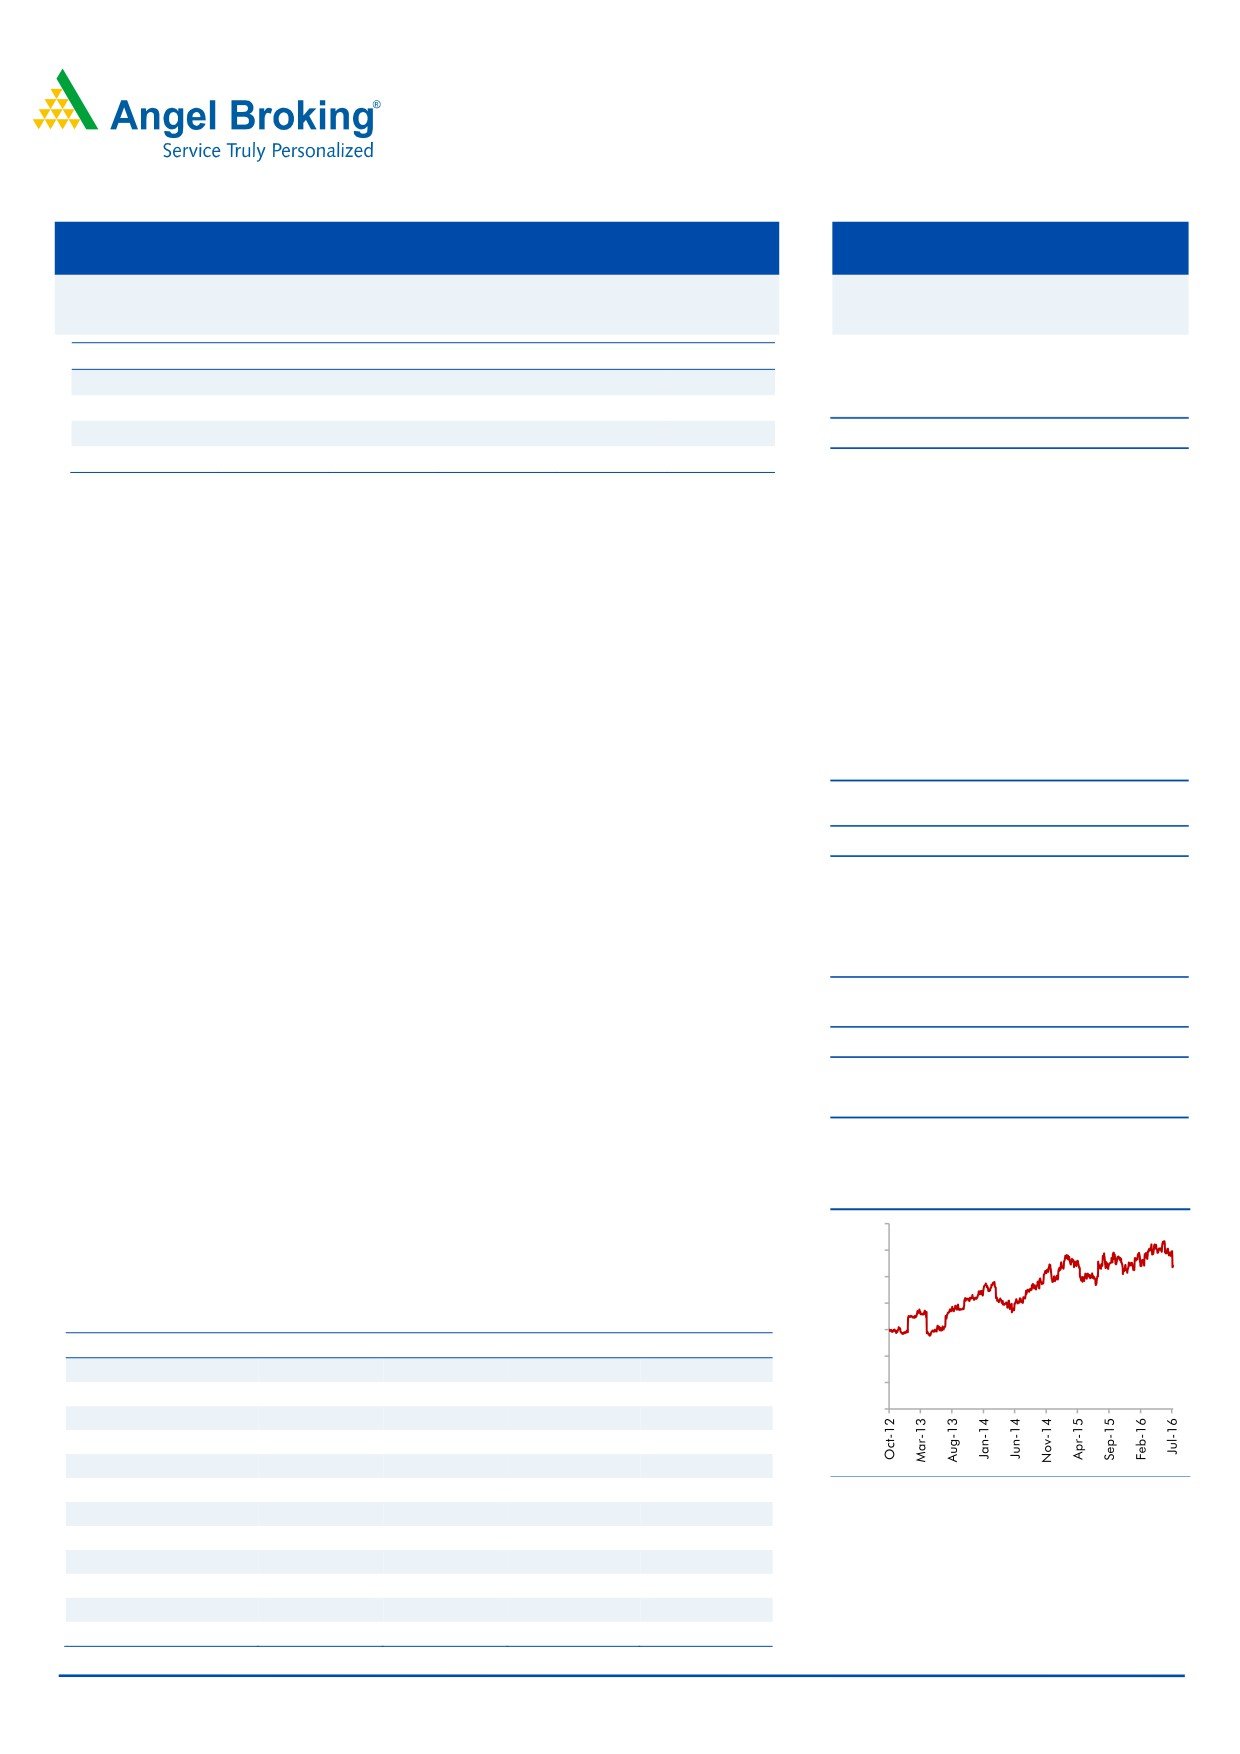
3-year price chart
This implies an ask rate of 3.1%-4.1% for the remainder of the year. It gave a
1,400
1,200
guidance of achieving sales of US$20bn by FY2020. We maintain our Buy rating
1,000
on the stock.
800
Key financials (Consolidated, IFRS)
600
Y/E March (` cr)
FY2015
FY2016
FY2017E
FY2018E
400
Net sales
53,319
62,441
69,934
79,025
200
% chg
6.4
17.1
12.0
13.0
0
Adj. net profit
12,330
13,491
14,886
16,529
% chg
13.5
9.4
10.3
11.0
EBITDA margin (%)
27.9
27.4
27.5
27.5
Source: Company, Angel Research
EPS (`)
53.7
59.0
64.8
72.0
P/E (x)
20.1
18.3
16.7
15.0
P/BV (x)
4.5
4.0
3.7
3.3
RoE (%)
22.5
21.8
22.0
22.3
RoCE (%)
20.8
20.7
22.1
23.0
Sarabjit kour Nangra
EV/Sales (x)
4.1
3.4
3.0
2.6
+91 22-39357800 Ext: 6806
EV/EBITDA (x)
14.5
12.5
10.9
9.4
Source: Company, Angel Research; Note: CMP as of July 18, 2016
Please refer to important disclosures at the end of this report
1
Infosys | 1QFY2017 Result Update
Exhibit 1: 1QFY2017 performance (IFRS, consolidated)
(` cr)
1QFY17
4QFY16
% chg (qoq)
1QFY16
% chg (yoy)
FY2016
FY2015
% chg (yoy)
Net revenue
16,782
16,550
1.4
14,354
16.9
62,673
53,319
17.5
Cost of revenue
10,278
9,893
3.9
8,812
16.6
37,655
32,081
17.4
Gross profit
6,504
6,657
(2.3)
5,542
17.4
25,018
21,238
17.8
SG&A expenses
2,054
2,068
(0.7)
1,784
15.1
7,723
6,604
16.9
EBITDA
4,450
4,589
(3.0)
3,758
18.4
17,295
14,634
18.2
Depreciation
403
369
9.2
312
29.2
1,443
802
79.9
EBIT
4,047
4,220
(4.1)
3,446
17.4
15,852
13,832
14.6
Other income
753
771
(2.3)
758
(0.7)
3,122
3,427
PBT
4,800
4,991
(3.8)
4,204
14.2
18,974
17,259
9.9
Income tax
1,362
1,394
(2.3)
1,175
15.9
5,251
4,929
6.5
Exceptional item
2
-
-
(3)
(1)
Reported PAT
3,436
3,597
(4.5)
3,030
13.4
13,726
12,329
11.3
Adjusted PAT
3,436
3,597
(4.5)
3,030
13.4
13,723
12,329
11.3
EPS
15.0
15.7
(4.5)
13.6
11.0
60.1
54.0
11.3
Gross margin (%)
38.8
40.2
(147)bp
38.6
15bps
39.9
39.8
9bp
EBITDA margin (%)
26.5
27.7
(121)bp
26.2
34bps
27.6
27.4
15bp
EBIT margin (%)
24.1
25.5
(138)bp
24.0
11bps
25.3
25.9
(65)bp
PAT margin (%)
20.5
21.7
(126)bp
21.1
(63)bp
21.9
23.1
(123)bp
Source: Company, Angel Research
Exhibit 2: 1QFY2017 - Actual Vs Angel estimates
(` cr)
Actual
Estimate
% Var.
Net revenue
16,782
17,072
(1.7)
EBITDA margin (%)
26.5
26.7
(13)
PAT
3,436
3,514
(2.2)
Source: Company, Angel Research
Revenues below expectation
For 1QFY2017, Infosys posted a 2.2% sequential growth in USD
revenues to
US$2,501mn (V/s US$2,548mn expected), with the growth mostly being volume
led. In INR terms, revenues came in at `16,782cr (V/s `17,072cr expected), up
1.4% qoq.
On CC basis, the company posted a 1.7% qoq growth on the sales front. The
blended realization declined by 0.5% qoq in CC terms while volumes in IT Services
grew 2.2% qoq, which is lower than the 2.4% qoq growth seen in the previous
quarter. Volumes grew 3.3% qoq onsite and 1.8% qoq offshore. The lower than
expected software revenue growth is attributed to delays in commencement of
ramp-up in large deals, and unanticipated headwinds in discretionary spending in
consulting services and package implementation.
In terms of geographies, USA posted a CC qoq growth of 2.4%, Europe posted a
CC qoq growth of 0.3%, ROW posted a CC qoq growth of 4.9%, while India
dipped by 8.2% qoq on a CC basis during the quarter. In terms of verticals, FSI,
Manufacturing & Hi-Tech, RCL, and ECS posted a CC qoq growth of 1.7%, 2.4%,
0.7% and 2.4% respectively.
July 20, 2016
2
Infosys | 1QFY2017 Result Update
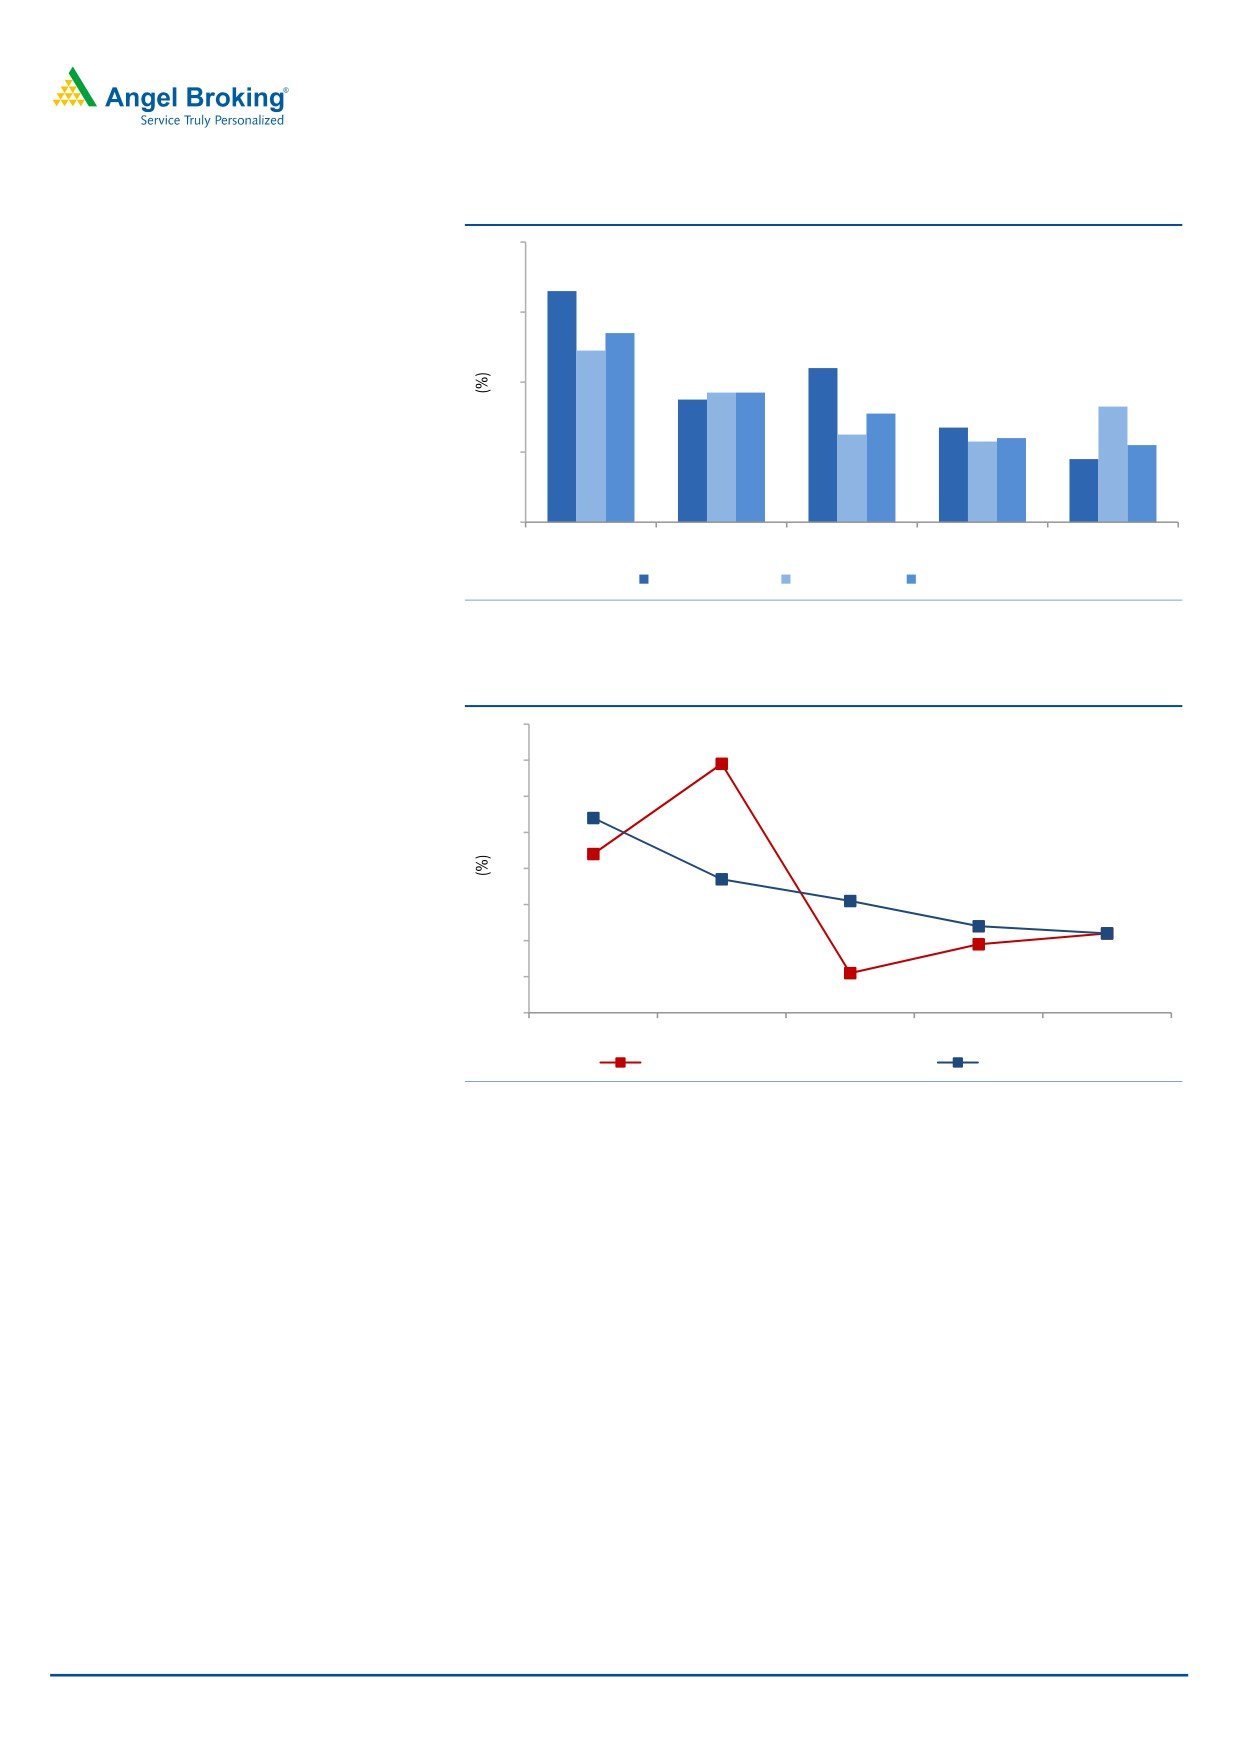
Exhibit 3: Trend in volume growth QoQ (Effort wise)
8
6.6
6
5.4
4.9
4.4
3.7
4
3.7
3.5
3.3
3.1
2.5
2.7
2.3
2.4
2.2
1.8
2
0
1QFY16
2QFY16
3QFY16
4QFY16
1QFY17
Offshore
Onsite
Total volume growth
Source: Company, Angel Research
Exhibit 4: Trend in volume and USD revenue growth (QoQ)
8
6.9
7
6
5
5.4
4
4.4
3
3.7
2.4
1.1
2.2
2
2.2
3.1
1.9
1
0
1QFY16
2QFY16
3QFY16
4QFY16
1QFY17
Revenue growth (constant currency)
Volume growth
Source: Company, Angel Research
Industry-wise, revenue from FSI, the company’s anchor vertical which contributed
by 32.8% to revenues, grew by 2.2% qoq; in CC terms, revenue from FSI grew by
1.7% qoq. The Manufacturing industry vertical, which contributed by 22.8% to
revenues, grew by 2.9% qoq. In CC terms, the revenue from this vertical grew by
2.4% sequentially.
The Retail, CPG and Logistics segment (RCL; contributed by 24.2% to revenues)
reported a 1.0% qoq growth. In CC terms, the revenue from RCL grew by 0.7%
qoq. The Energy Utilities and Communications & Services segment (contributed by
20.0% to revenue) reported a growth of 3.1% qoq in revenue, with Energy and
Utilities posting the biggest fall among verticals of 7.6% qoq.
July 20, 2016
3
Infosys | 1QFY2017 Result Update
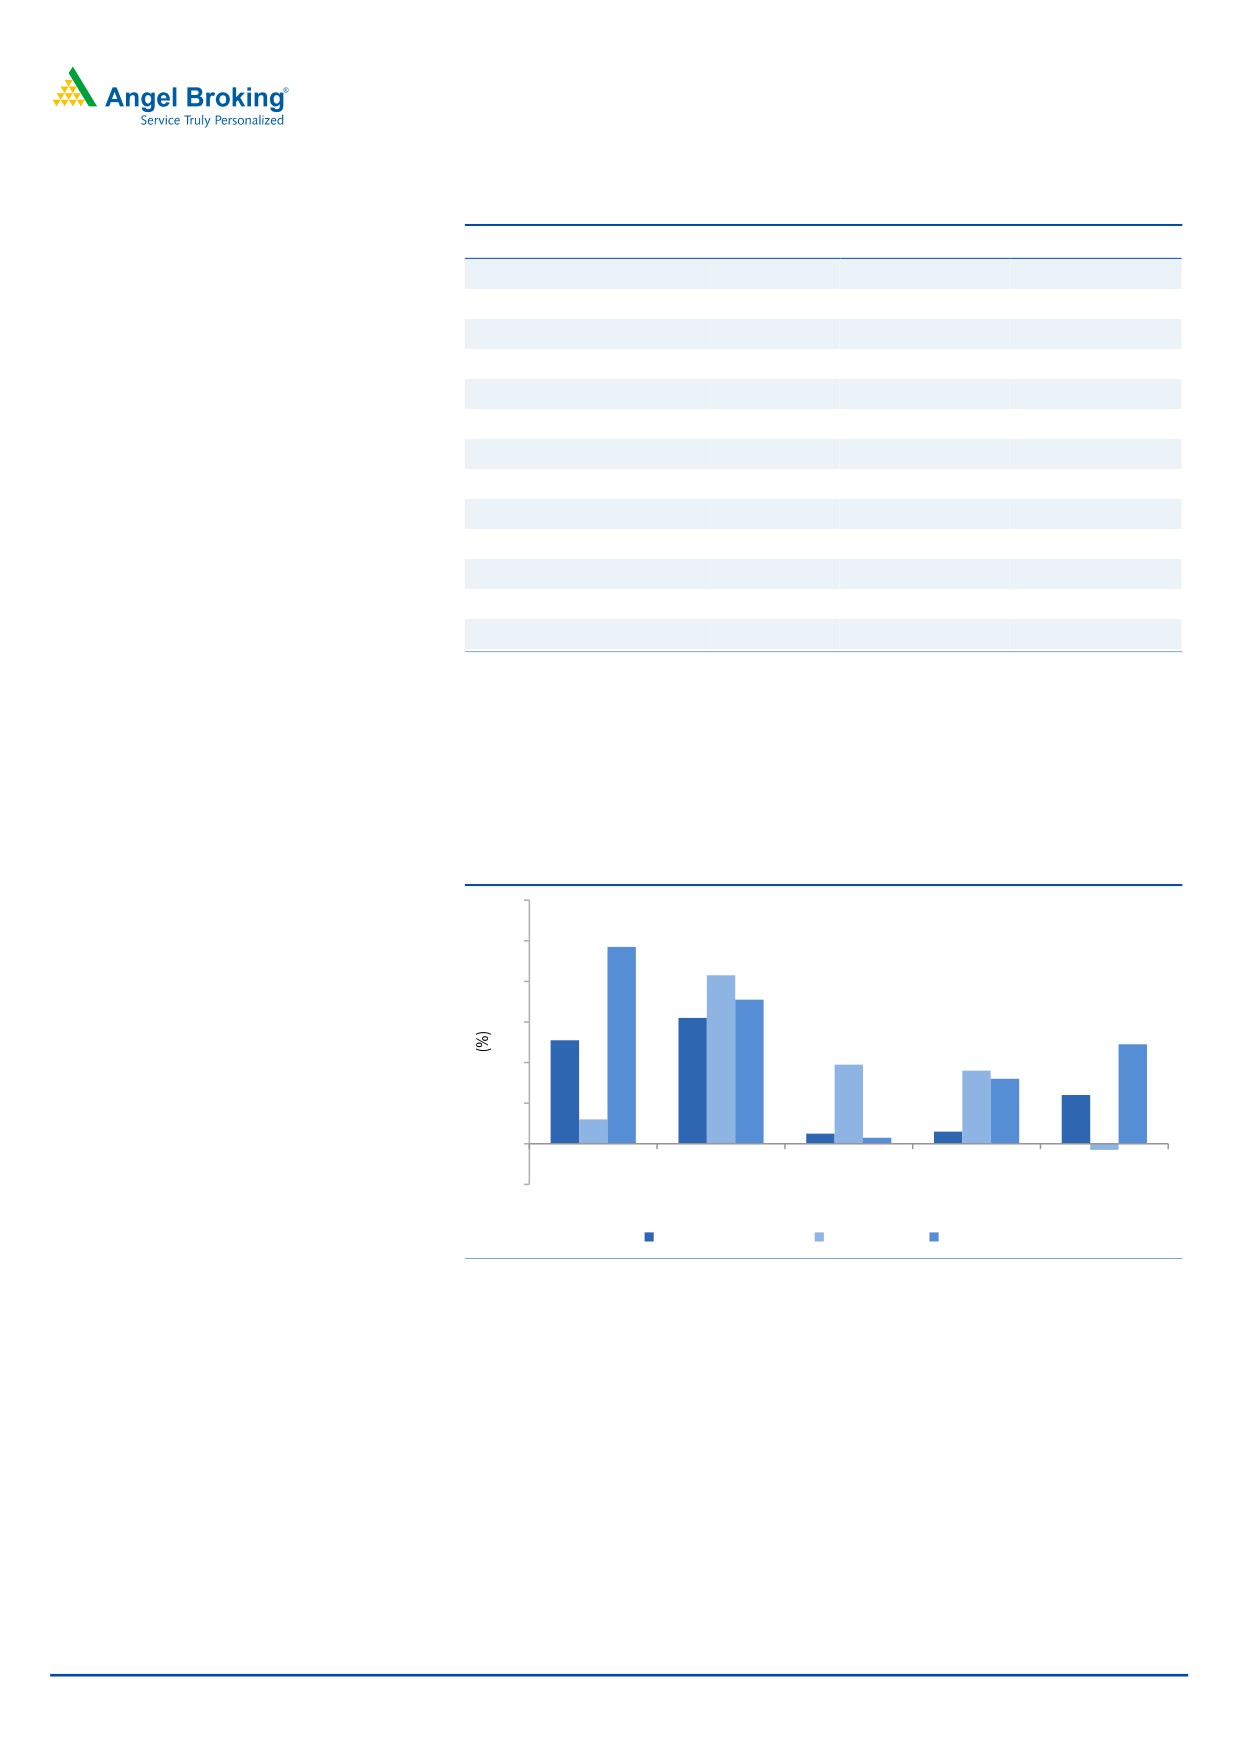
Exhibit 5: Growth trend in industry segments (Reported basis)
Particulars
% to revenue
% growth QoQ
% growth YoY
FSI
32.8
2.2
9.9
Banking and financial services
27.2
1.5
11.3
Insurance
5.6
6.0
3.5
Manufacturing
22.8
2.7
5.3
RCL
24.2
1.0
11.3
Retail and CPG
15.5
5.7
14.6
Transport and logistics
1.9
7.9
40.4
Life Sciences
4.7
(15.7)
(7.0)
Healthcare
2.1
7.4
16.4
ECS
20.2
4.8
19.1
Energy and utilities
4.7
(7.6)
24.1
Communication and services
9.4
11.8
24.1
Others
6.1
0.6
9.1
Source: Company, Angel Research
In terms of geographies, revenue from North America grew by 2.4% qoq in CC
terms, while other geographies such as Europe de-grew by 0.3% qoq and RoW
grew by 4.9% QoQ (both in CC terms). India posted an 8.2% qoq de-growth in
CC terms.
Exhibit 6: USD growth trend in geographies QoQ (CC basis)
12
10
9.7
8.3
8
7.1
6.2
6
5.1
4.9
3.9
4
3.6
3.2
2.4
2
1.2
0.5
0.6
0.3
0
(0.3)
(2)
1QFY16
2QFY16
3QFY16
4QFY16
1QFY17
North America
Europe
Rest of the world
Source: Company, Angel Research
July 20, 2016
4
Infosys | 1QFY2017 Result Update
Hiring and utilization
Infosys added 13,268 gross employees in 1QFY2017, of which 5,260 were lateral
additions. The net addition number for the quarter stood at 3,006. Attrition (for
standalone entity) heated up in 1QFY2017; it increased to 21.0% (LTM) V/s 17.3%
in 1QFY2017. The Management has attributed the same to seasonality of the
business.
Exhibit 7: Employee metrics
1QFY16 2QFY16 3QFY16 4QFY16 1QFY17
Gross addition
11,889
17,595
14,027
9,034
13,268
Net addition
3,336
8,453
8,620
661
3,006
Gross lateral emp. addition
5,886
7,452
6,115
5,266
5,260
Attrition - LTM basis (%)*
19.2
19.9
18.1
17.3
21.0
Source: Company, Angel Research, Note-* excluding subsidiaries
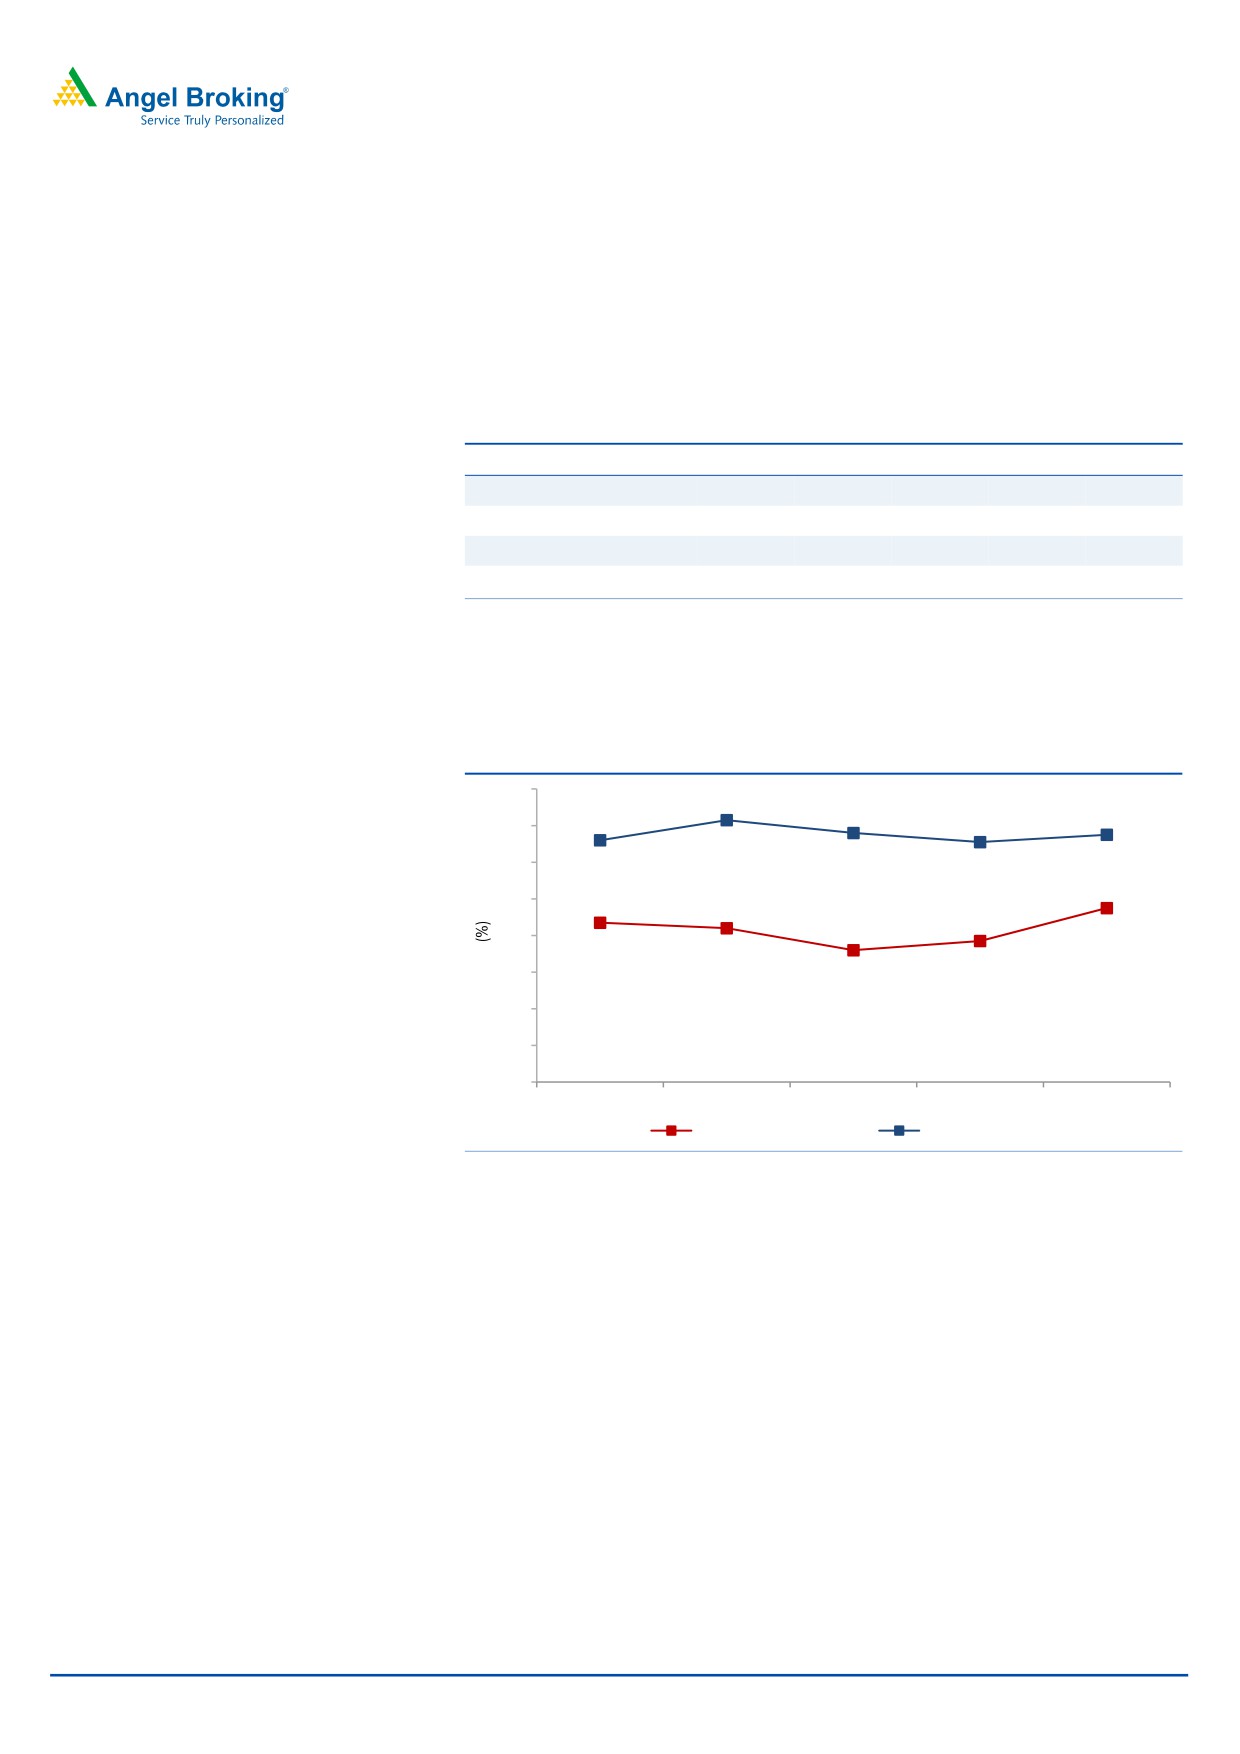
The utilization rate including trainees grew by 180bp qoq to 76.5% (higher than
74.7% as in 4QFY2016); while excluding trainees, it grew by 40bp qoq to 80.5%.
Exhibit 8: Trend in utilization (Services and Consulting + Projects)
83
81.3
80.6
80.5
80.2
80.1
81
79
77
76.5
75
75.7
75.4
74.7
73
74.2
71
69
67
1QFY16
2QFY16
3QFY16
4QFY16
1QFY17
Including trainees
Excluding trainees
Source: Company, Angel Research
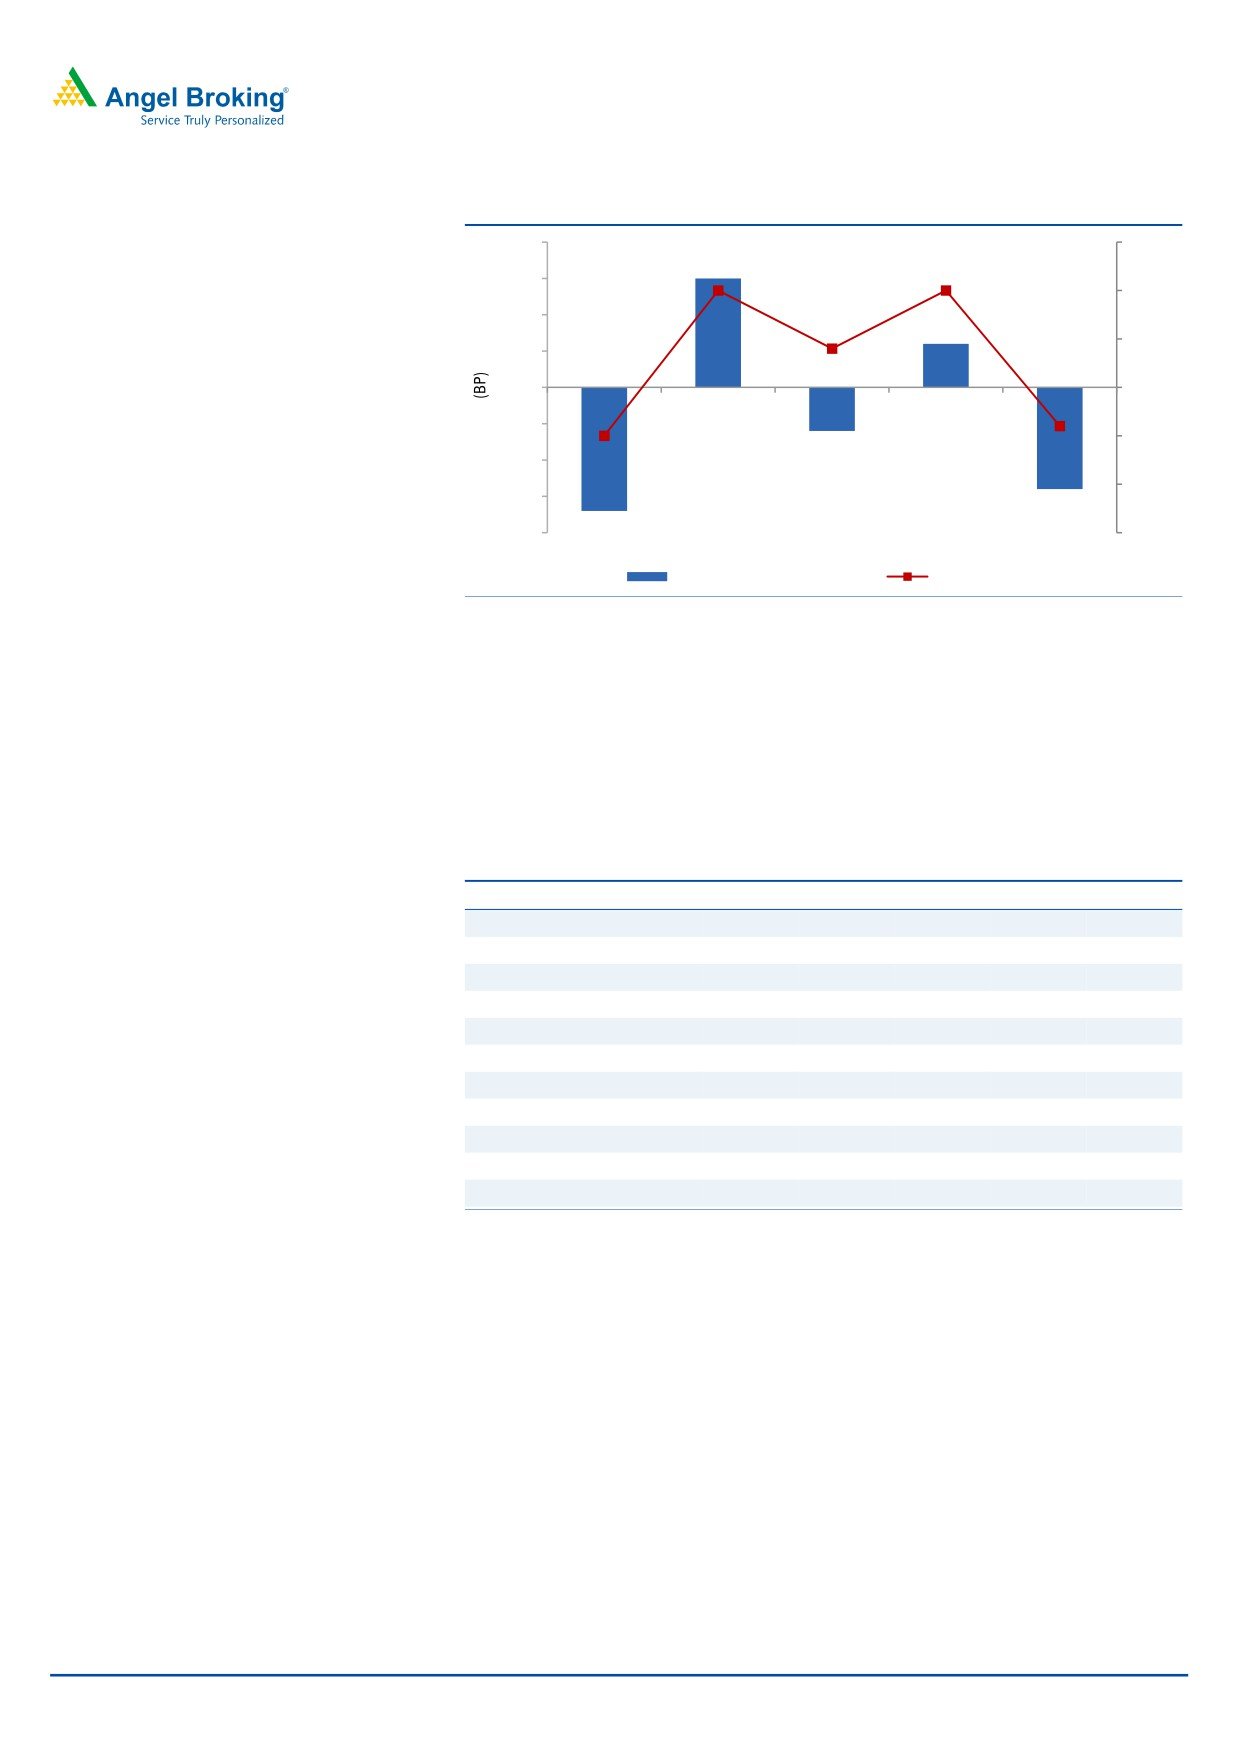
Margins dip
On the operating front, EBDITA and EBIT margins dipped by ~121bp qoq and
~140bp qoq to 26.5% (V/s an expected 26.7%) and 24.1% respectively. In
1QFY2017, wage hike and visa expenses impacted margins by 140bp and 80bp
qoq respectively. However, the company was able to offset the impact to 80bp
through cost optimization and variable pay reduction.
July 20, 2016
5
Infosys | 1QFY2017 Result Update
Exhibit 9: Trend in EBIT margin
200.0
26.0
25.5
150.0
25.5
25.5
100.0
150
24.9
25.0
50.0
60
0.0
24.5
(60)
(50.0)
24.0
24.1
24.0
(100.0)
(140)
23.5
(150.0)
(170)
(200.0)
23.0
1QFY16
2QFY16
3QFY16
4QFY16
1QFY17
Margin movement (qoq)
EBIT margin (%)
Source: Company, Angel Research
Client pyramid
Infosys added 95 new clients (gross additions) during the quarter, taking its
total active client base to 1126. The client addition was across the board. The
company bagged new deals with TCV of US$757mn, during the quarter. TCV of
deal wins for FY2016 is US$2.9bn, which is 49% higher.
Exhibit 10: Client metrics
Particulars
1QFY16 2QFY16 3QFY16 4QFY16 1QFY17
Top client (% of revenue)
3.7
3.7
3.5
3.6
3.6
Gross Client addition
79
82
75
89
95
Active client
987
1011
1045
1092
1126
US$1mn-5mn
287
284
294
290
306
US$5mn-10mn
87
89
90
91
88
US$10mn-20mn
78
84
82
89
93
US$20mn-50mn
34
35
23
32
35
US$50mn-100mn
21
19
15
17
21
US$100mn-200mn
14
17
7
8
11
US$200mn-300mn
8
8
5
5
6
US$300mn plus
1
1
1
1
1
Source: Company, Angel Research
Concall Highlights
Infosys won deals worth TCV of US$757mn during the quarter.
Owing to a weak beginning for FY2017, Infosys has reduced its guidance for
the year to 10.5-12% growth in CC terms. The revised guidance implies an
even higher ask rate than earlier of 3-4% in the remainder of the year.
July 20, 2016
6
Infosys | 1QFY2017 Result Update
Investment arguments
Revenue guidance revised for FY2017: The Management has lowered its revenue
growth guidance for FY2017. The company has issued a 10.5-12.0% qoq CC
growth guidance from 11.5-13.5% (in CC terms) earlier. In INR terms the
guidance has been revised downwards to 11.7-13.2% from 12.7-14.7% earlier on
the basis of exchange rate as on March 31, 2016. For FY2016, the company
posted a 13.3% growth in CC terms V/s a guidance of 12.8-13.2% growth (in CC
terms). We expect the company to post ~12.5% USD revenue growth in FY2017.
The company expects to lead industry growth and reach a milestone of achieving
sales of US$20bn by FY2020. Currently, we have factored in moderate growth for
FY2017 (INR and USD growth of 12.5%).
Aims to be US$20bn company by FY2020: The Management believes the
traditional IT services model is dying and a structural change is taking place in the
industry. Pricing pressure is being witnessed in commoditized services, thus
necessitating the company to pursue newer growth avenues including acquisitions
in areas like automation. The outsourcing services provider is therefore looking to
ramp up its productivity through automation and is looking for acquisitions to
boost growth. Infosys' cash and cash equivalents were at US$5.2bn as at the end
of March 2015.
The company expects its revenue to rise to US$20bn by FY2020, from US$8.7bn
now, as it focuses on acquisitions and on winning more new technology services,
implying a 14% CAGR over the period. In the near term, we expect Infosys to post
a 12.5% USD revenue growth in FY2017. Over FY2016-18E, we expect USD and
INR revenue to grow at a CAGR of 12.5% and 12.5%, respectively.
Operating margin likely to be range bound in near term: Going ahead, given a
stable rupee, higher S&M spends, and wage hikes in FY2017, we expect the EBIT
margin to remain at 25.1% in FY2017 and FY2018 (V/s 25.0% in FY2016). Over
FY2016-18E, we expect an EBIT CAGR of 13.2%. However, as part of its `Vision
2020’ (target to have US$20bn revenues at
30% operating margins and
US$80,000 per employee revenue productivity by CY2020), the Management
expects acceleration in revenue growth and margin improvement to reflect ahead
of the increase in revenue productivity.
Outlook and valuation
The company has downgraded its USD revenue growth guidance for FY2017 to
10.5-12.0% on CC basis. We expect the company to post ~12.5% USD revenue
growth in FY2017. It aims to reach a milestone of achieving sales of US$20bn by
FY2020. Also, the company plans to utilize cash properly through increased
dividends and acquisitions, so that it can increase its capital efficiency. The stock
currently trades at a valuation of 15.0x its FY2018E earnings. We recommend an
Buy on the stock with a price target of `1,370.
July 20, 2016
7
Infosys | 1QFY2017 Result Update
Exhibit 11: Key assumptions
Parameters
FY2017E
FY2018E
Revenue growth - USD terms (%)
12.0
13.0
USD-INR rate
65.7
65.7
Revenue growth - INR terms (%)
12.0
13.0
EBITDA margin (%)
27.5
27.5
Tax rate (%)
28.0
28.0
EPS growth (%)
10.3
11.0
Source: Company, Angel Research
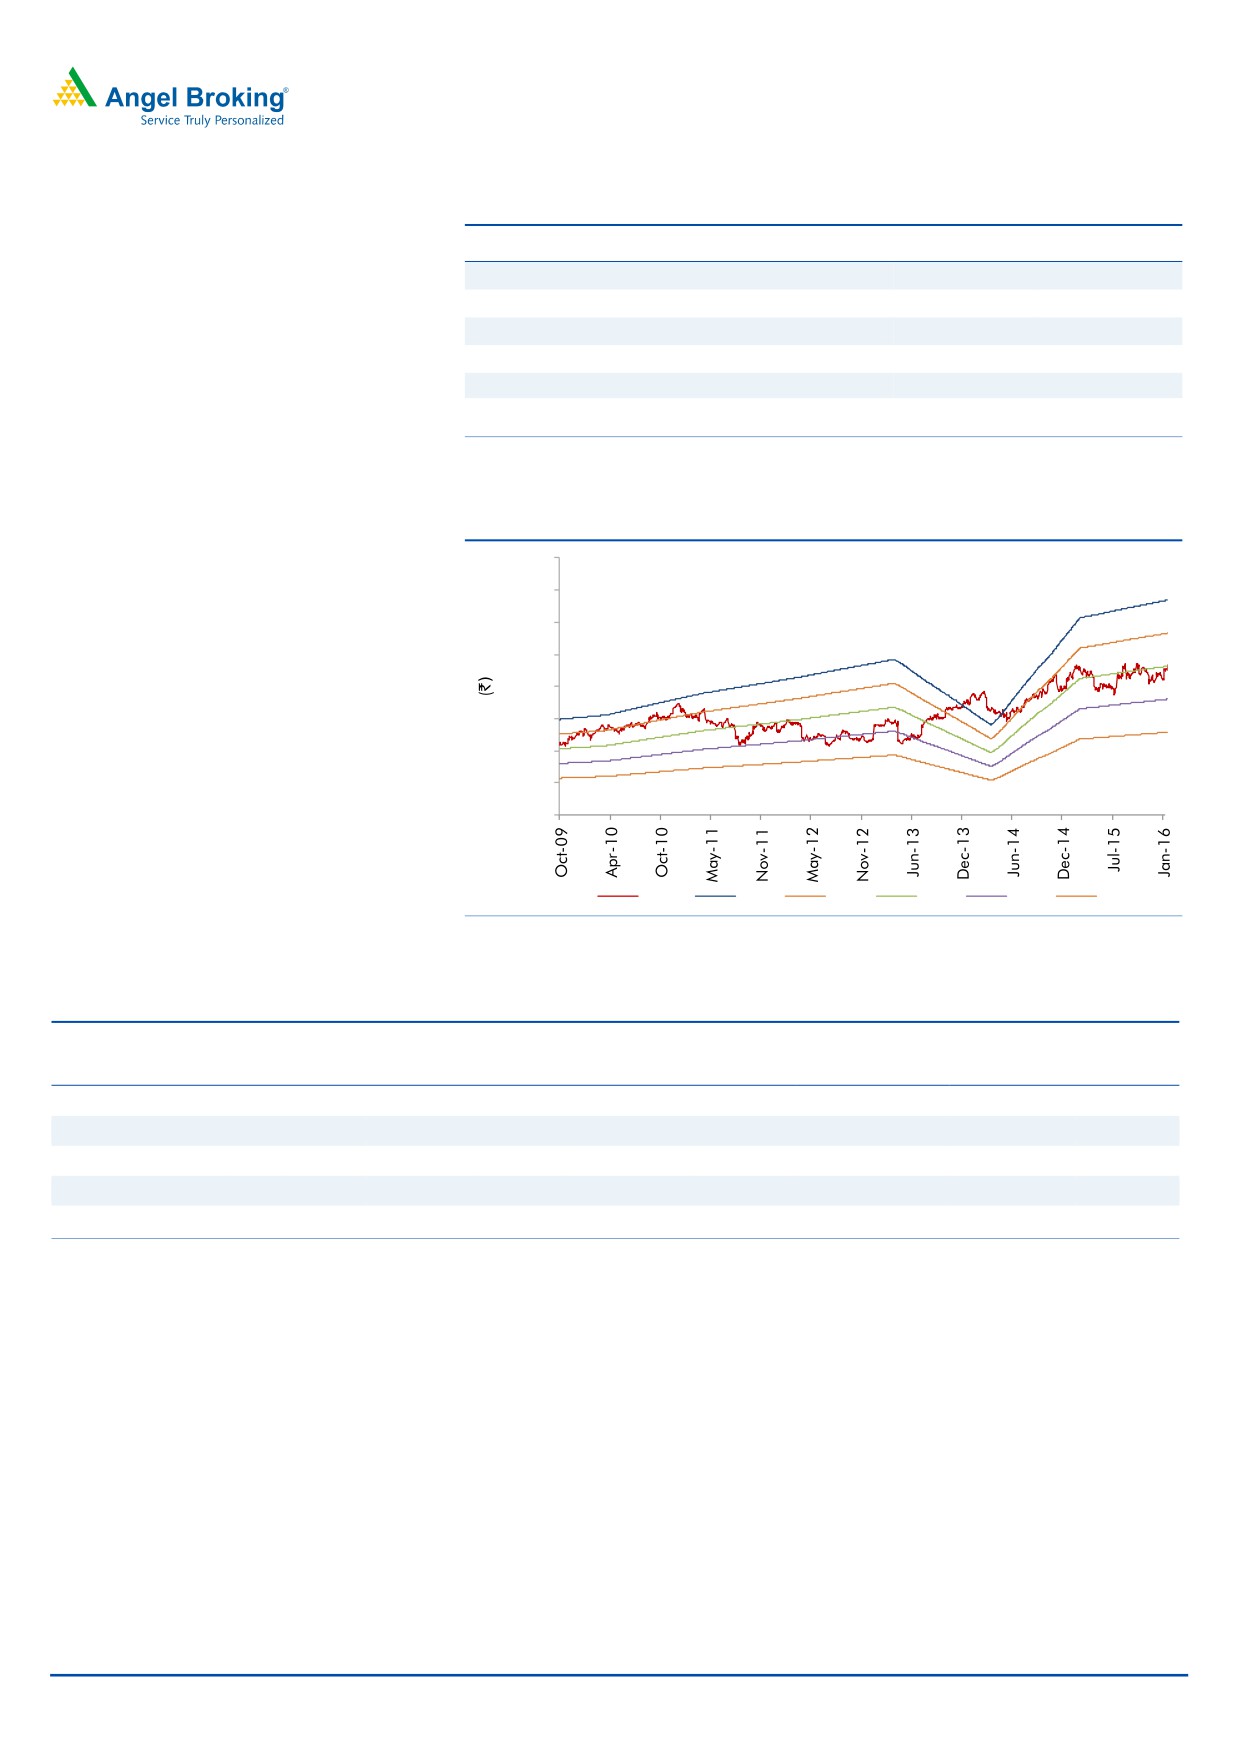
Exhibit 12: One-year forward PE (x)
2,000
1,750
1,500
1,250
1,000
750
500
250
0
Price
26x
22x
18x
14x
10x
Source: Company, Angel Research
Exhibit 13: Recommendation summary
Company
Reco
CMP Tgt. price
Upside
FY2018E FY2018E
FY2016-18E
FY2018E
FY2018E
(`)
(`)
(%)
EBITDA (%)
P/E (x)
EPS CAGR (%)
EV/Sales (x)
RoE (%)
HCL Tech
Buy
723
1,000
38.4
20.5
11.3
26.5
1.8
17.9
Infosys
Buy
1,082
1,370
26.6
27.5
15.0
10.4
2.6
22.3
TCS
Buy
2,448
3,004
22.7
28.3
15.4
13.0
3.0
35.5
Tech Mahindra
Buy
506
700
38.4
17.0
12.3
13.2
1.2
20.7
Wipro
Buy
552
680
23.1
23.8
12.1
9.9
1.6
19.6
Source: Company, Angel Research
Company Background
Infosys is the second largest IT company in India, employing over
1,857,776
professionals (as of FY2016). The company services more than 1000 clients across
various verticals, such as financial services, manufacturing, telecom, retail and
healthcare. Infosys has the widest portfolio of service offerings amongst Indian IT
companies, spanning across the entire IT service value chain - from traditional
Application Development and Maintenance to Consulting and Package
Implementation to Products and Platforms.
July 20, 2016
8
Infosys | 1QFY2017 Result Update
Profit and loss statement (IFRS, consolidated)
Y/E March (` cr)
FY2013
FY2014
FY2015
FY2016
FY2017E FY2018E
Net sales
40,352
50,133
53,319
62,441
69,934
79,025
Cost of revenue
24,158
30,767
31,817
37,595
36,016
40,698
Gross profit
16,194
19,366
21,502
24,846
27,624
31,215
% of net sales
40.1
38.6
40.3
39.8
39.5
39.5
Selling and mktg exp.
2,034
2,625
2,941
3,431
3,846
4,346
% of net sales
5.0
5.2
5.5
5.5
5.5
5.5
General and admin exp.
2,609
3,107
3,663
4,292
4,546
5,137
% of net sales
6.5
6.2
6.9
6.9
6.5
6.5
EBITDA
11,551
13,634
14,898
17,123
19,232
21,732
% of net sales
28.6
27.2
27.9
27.4
27.5
27.5
Dep and amortization
1,122
1,374
1,066
1,503
1,678
1,897
% of net sales
2.8
2.7
2.0
2.4
2.4
2.4
EBIT
10,429
12,260
13,832
15,620
17,553
19,835
% of net sales
25.8
24.5
25.9
25.0
25.1
25.1
Other income
2,359
2,669
3,427
3,122
3,122
3,122
Profit before tax
12,788
14,929
17,259
18,742
20,675
22,957
Provision for tax
3,367
4,062
4,929
5,251
5,789
6,428
% of PBT
26.3
27.2
28.6
28.0
28.0
28.0
PAT
9,421
10,648
12,330
13,491
14,886
16,529
Exceptional item
-
219
-
-
-
-
Adj. PAT
9,421
10,867
12,330
13,491
14,886
16,529
EPS (`)
41.0
47.3
53.7
59.0
64.8
72.0
July 20, 2016
9
Infosys | 1QFY2017 Result Update
Balance sheet (IFRS, consolidated)
Y/E March (` cr)
FY2013
FY2014
FY2015
FY2016
FY2017E FY2018E
Current assets
Cash and cash equivalents
21,832
25,950
30,367
32,697
38,348
42,689
Available for sale financial assets
1,739
2,197
874
75
75
75
Investment in certificates of deposit
-
859
93
103
103
103
Trade receivables
7,083
8,351
9,713
11,330
11,749
13,276
Unbilled revenue
2,435
2,811
2,845
3,029
3,029
3,029
Derivative financial instruments
101
215
101
116
116
116
Prepayments and other current assets
2,123
2,636
3,296
4,448
4,056
4,583
Total current assets
35,313
43,019
47,289
51,798
57,476
63,872
Non-current assets
Property, plant and equipment
6,468
7,887
9,125
10,530
10,730
10,930
Goodwill
1,976
2,157
3,091
3,764
2,157
2,157
Intangible assets
368
342
638
985
342
342
Available for sale financial assets
394
1,252
1,345
1,811
1,252
1,252
Deferred income tax assets
503
656
537
536
656
656
Income tax assets
1,092
1,522
4,089
5,230
5,230
5,230
Other non-current assets
237
220
238
735
1,632
1,632
Total non-current assets
11,038
14,036
19,063
23,591
21,999
22,199
Total assets
46,351
57,055
66,352
75,389
79,475
86,071
Current liabilities
Trade payables
189
173
140
386
173
173
Derivative financial instruments
-
-
3
5
-
-
Current income tax liabilities
1,329
2,187
2,818
3,410
3,787
3,787
Client deposits
36
40
27
28
40
40
Unearned revenue
823
660
1,052
1,332
660
660
Employee benefit obligations
614
954
1,069
1,341
954
954
Provisions
213
379
478
512
379
379
Other liabilties
3,082
4,745
5,796
6,225
5,545
5,545
Total current liabilities
6,286
9,138
11,383
13,239
11,538
11,538
Non-current liabilities
Deferred income tax liabilties
119
64
160
256
64
64
Employee benefit obligations
149
323
46
115
323
323
Other liabilities
-
-
-
-
-
-
Total non-current liabilities
268
387
206
371
387
387
Total liabilities
6,554
9,525
11,589
13,610
11,925
11,925
Equity
Share capital
286
286
572
1,144
1,144
1,144
Share premium
3,090
3,090
3,090
2,241
2,241
2,241
Retained earnings
36,114
43,584
50,531
57,655
63,595
70,190
Other components of equity
307
570
570
739
570
571
Total equity
39,797
47,530
54,763
61,779
67,550
74,146
Total liabilties and equity
46,351
57,055
66,352
75,389
79,475
86,071
July 20, 2016
10
Infosys | 1QFY2017 Result Update
Cash flow statement (IFRS, consolidated)
Y/E March (` cr)
FY2013
FY2014
FY2015
FY2016 FY2017E FY2018E
Pre tax profit from operations
10,429
12,260
13,832
15,620
17,553
19,835
Depreciation
1,122
1,374
1,066
1,503
1,678
1,897
Pre tax cash from operations
11,551
13,634
14,898
17,123
19,232
21,732
Other income/prior period ad
2,359
2,669
3,427
3,122
3,122
3,122
Net cash from operations
13,910
16,303
18,325
20,245
22,354
24,854
Tax
3,367
4,062
4,929
5,251
5,789
6,428
Cash profits
10,543
12,241
13,396
14,994
16,565
18,426
(Inc)/dec in current assets
(2,464)
(2,271)
(1,942)
(2,968)
(27)
(2,055)
Inc/(dec) in current liabilties
1,520
2,852
2,245
1,856
(1,701)
-
(Inc)/dec in net trade WC
(944)
581
303
(1,112)
(1,728)
(2,055)
Cashflow from operating actv.
9,599
12,822
13,699
13,882
14,837
16,371
(Inc)/dec in fixed assets
(2,181)
(2,793)
(2,304)
(2,908)
(1,878)
(2,097)
(Inc)/dec in investments
(1,362)
(1,317)
2,089
789
-
-
(inc)/dec in sale of financial assets
(382)
(858)
(93)
(466)
559
-
(Inc)/dec in deferred tax assets
(242)
(583)
(2,448)
(1,140)
(120)
-
Inc/(dec) in other non current liab.
147
119
(181)
165
16
-
(Inc)/dec in other non current ass.
(1,253)
(138)
(1,248)
(1,517)
1,353
-
Cashflow from investing actv.
(5,273)
(5,570)
(4,185)
(5,077)
(70)
(2,097)
Inc/(dec) in debt
-
-
-
-
-
-
Inc/(dec) in equity/premium
(280)
1,099
450
889
(1,421)
(1,410)
Dividends
2,805
4,233
5,547
7,364
7,695
8,523
Cashflow from financing actv.
(3,085)
(3,134)
(5,097)
(6,475)
(9,116)
(9,933)
Cash generated/(utilised)
1,241
4,118
4,417
2,330
5,651
4,342
Cash at start of the year
20,591
21,832
25,950
30,367
32,697
38,348
Cash at end of the year
21,832
25,950
30,367
32,697
38,348
42,689
July 20, 2016
11
Infosys | 1QFY2017 Result Update
Key ratios
Y/E March
FY2013
FY2014
FY2015
FY2016
FY2017E FY2018E
Valuation ratio (x)
P/E
26.4
22.9
20.1
18.3
16.7
15.0
P/CEPS
23.6
20.3
18.5
16.6
15.0
13.5
P/BVPS
6.2
5.2
4.5
4.0
3.7
3.3
Dividend yield (%)
1.0
1.5
1.7
2.3
3.0
3.3
EV/Sales
5.6
4.4
4.1
3.4
3.0
2.6
EV/EBITDA
19.4
16.0
14.5
12.5
10.9
9.4
EV/Total assets
4.8
3.8
3.3
2.8
2.6
2.4
Per share data (`)
EPS
41
47
54
59
65
72
Cash EPS
46
53
58
65
72
80
Dividend
11
16
19
25
32
36
Book value
173
207
239
269
294
323
Dupont analysis
Tax retention ratio (PAT/PBT)
0.7
0.7
0.7
0.7
0.7
0.7
Cost of debt (PBT/EBIT)
1.2
1.2
1.2
1.2
1.2
1.2
EBIT margin (EBIT/Sales)
0.3
0.2
0.3
0.3
0.3
0.3
Asset turnover ratio (Sales/Assets)
0.9
0.9
0.8
0.8
0.9
0.9
Leverage ratio (Assets/equity)
1.2
1.2
1.2
1.2
1.2
1.2
Operating ROE
23.7
22.4
22.5
21.8
22.0
22.3
Return ratios (%)
RoCE (pre-tax)
22.5
21.5
20.8
20.7
22.1
23.0
Angel RoIC
45.8
43.7
39.5
36.7
42.9
45.9
RoE
23.7
22.9
22.5
21.8
22.0
22.3
Turnover ratios(x)
Asset turnover (fixed assets)
3.7
3.6
2.8
2.6
3.2
3.6
Receivables days
86
81
86
84
77
75
July 20, 2016
12
Infosys | 1QFY2017 Result Update
Research Team Tel: 022 - 39357800
DISCLAIMER
Angel Broking Private Limited (hereinafter referred to as “Angel”) is a registered Member of National Stock Exchange of India Limited,
Bombay Stock Exchange Limited and Metropolitan Stock Exchange Limited. It is also registered as a Depository Participant with CDSL
and Portfolio Manager with SEBI. It also has registration with AMFI as a Mutual Fund Distributor. Angel Broking Private Limited is a
registered entity with SEBI for Research Analyst in terms of SEBI (Research Analyst) Regulations, 2014 vide registration number
INH000000164. Angel or its associates has not been debarred/ suspended by SEBI or any other regulatory authority for accessing
/dealing in securities Market. Angel or its associates/analyst has not received any compensation / managed or co-managed public
offering of securities of the company covered by Analyst during the past twelve months.
This document is solely for the personal information of the recipient, and must not be singularly used as the basis of any investment
decision. Nothing in this document should be construed as investment or financial advice. Each recipient of this document should
make such investigations as they deem necessary to arrive at an independent evaluation of an investment in the securities of the
companies referred to in this document (including the merits and risks involved), and should consult their own advisors to determine
the merits and risks of such an investment.
Reports based on technical and derivative analysis center on studying charts of a stock's price movement, outstanding positions and
trading volume, as opposed to focusing on a company's fundamentals and, as such, may not match with a report on a company's
fundamentals. Investors are advised to refer the Fundamental and Technical Research Reports available on our website to evaluate the
contrary view, if any
The information in this document has been printed on the basis of publicly available information, internal data and other reliable
sources believed to be true, but we do not represent that it is accurate or complete and it should not be relied on as such, as this
document is for general guidance only. Angel Broking Pvt. Limited or any of its affiliates/ group companies shall not be in any way
responsible for any loss or damage that may arise to any person from any inadvertent error in the information contained in this report.
Angel Broking Pvt. Limited has not independently verified all the information contained within this document. Accordingly, we cannot
testify, nor make any representation or warranty, express or implied, to the accuracy, contents or data contained within this document.
While Angel Broking Pvt. Limited endeavors to update on a reasonable basis the information discussed in this material, there may be
regulatory, compliance, or other reasons that prevent us from doing so.
This document is being supplied to you solely for your information, and its contents, information or data may not be reproduced,
redistributed or passed on, directly or indirectly.
Neither Angel Broking Pvt. Limited, nor its directors, employees or affiliates shall be liable for any loss or damage that may arise from
or in connection with the use of this information.
Disclosure of Interest Statement
Infosys
1. Financial interest of research analyst or Angel or his Associate or his relative
No
2. Ownership of 1% or more of the stock by research analyst or Angel or associates or relatives
No
3. Served as an officer, director or employee of the company covered under Research
No
4. Broking relationship with company covered under Research
No
Ratings (Based on expected returns
Buy (> 15%)
Accumulate (5% to 15%)
Neutral (-5 to 5%)
over 12 months investment period):
Reduce (-5% to -15%)
Sell (< -15)
July 20, 2016
13