2QFY2016 Result Update | Oil&Gas
November 5, 2015
Indian Oil Corporation
ACCUMULATE
CMP
`410
Performance Highlights
Target Price
`455
Standalone (` cr)
2QFY16
2QFY15
yoy (%)
1QFY16
qoq%
Investment Period
12 months
Total Revenue
85,385
1,11,664
(23.5)
1,01,307
(15.7)
EBITDA
695
(356)
(295.1)
10,101
(93.1)
Stock Info
Margin (%)
0.8
(0.3)
113bp
10.0
(916)bp
Sector
Oil&Gas
Reported PAT
(329)
(898)
(63.4)
6,436
0.0
Market Cap (` cr)
99,607
Source: Company, Angel Research
Net Debt (` cr)
48,349
Indian Oil Corporation (IOCL)’s 2QFY2016 revenue came in 2.4% ahead of our
Beta
0.7
estimate at `85,385cr, led by a 5.8% yoy increase in product sales volumes to
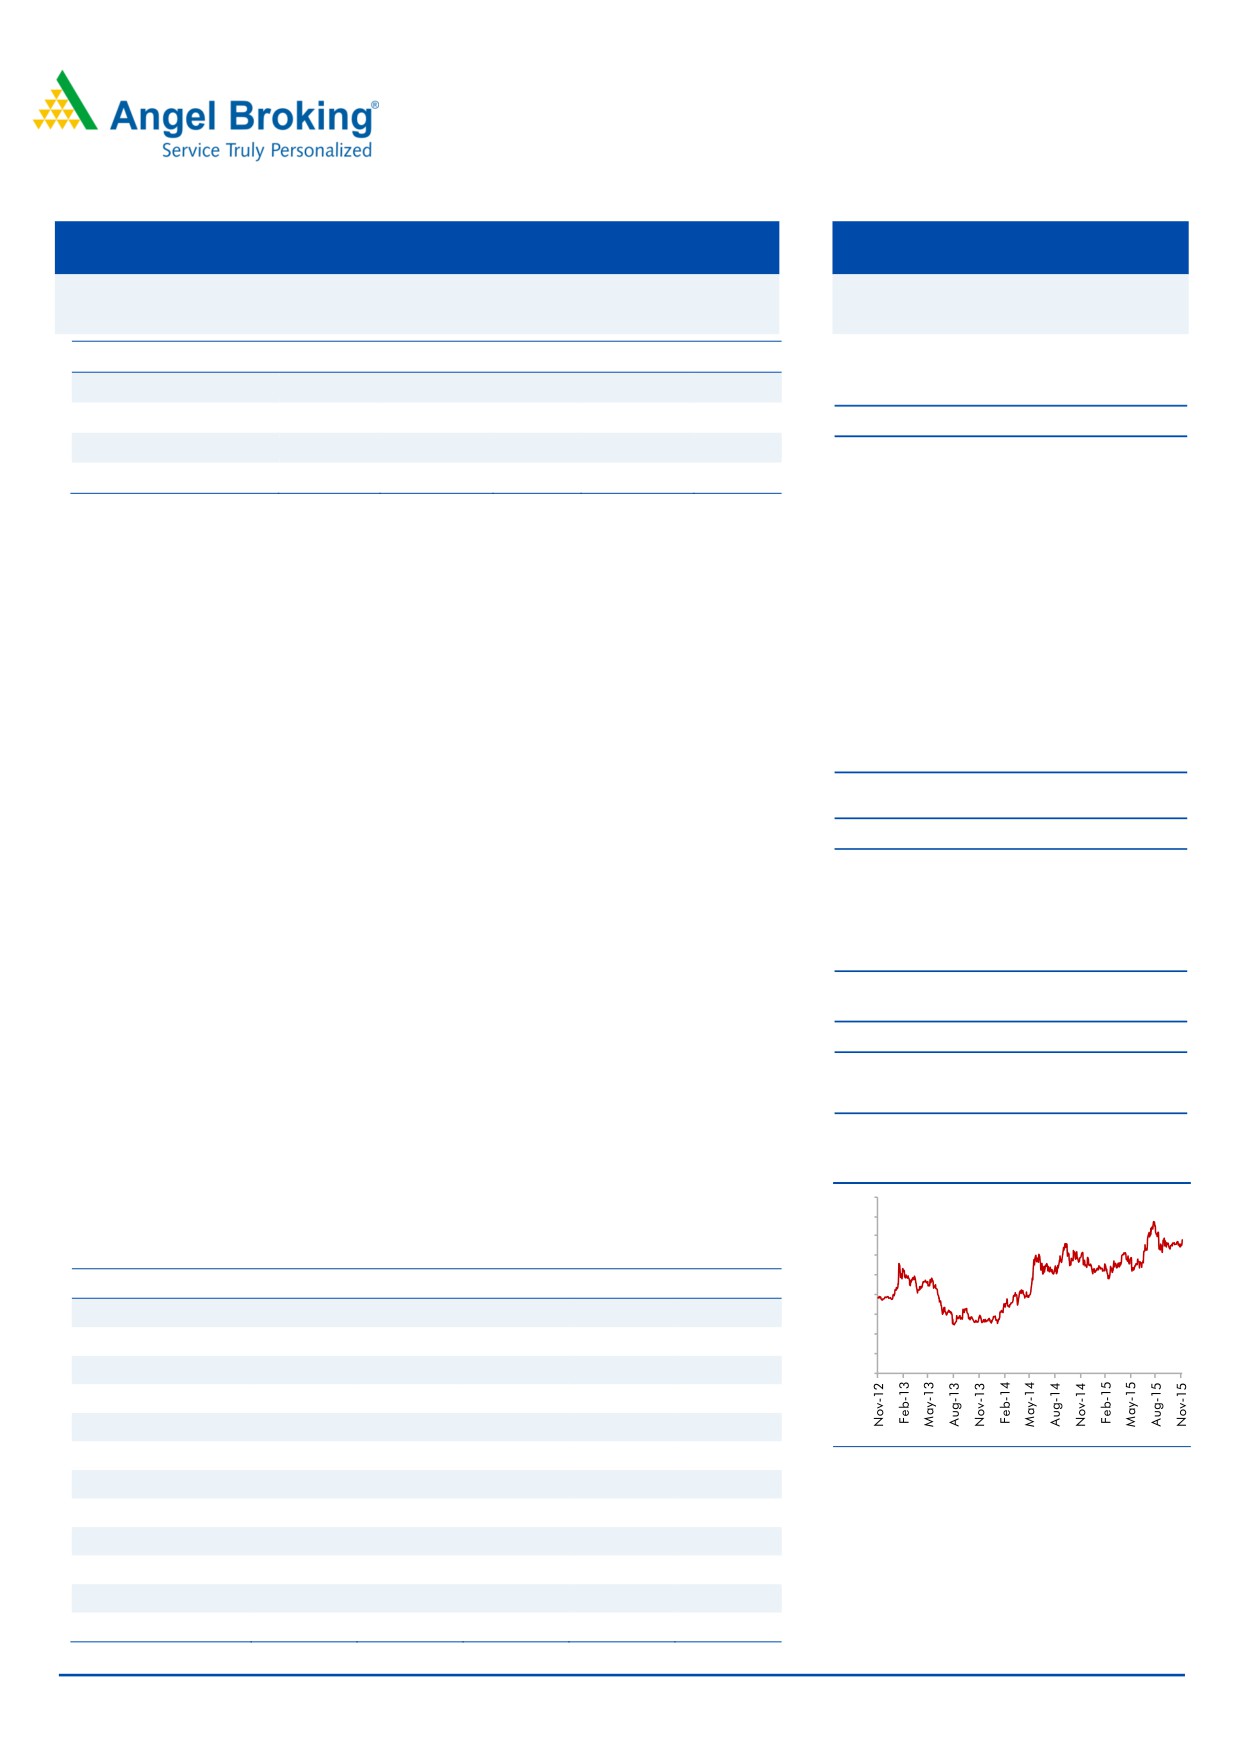
52 Week High / Low
465 / 307
19.07MMT as against 18.03MMT in 2QFY2015. Refining throughput increased
Avg. Daily Volume
8,69,14,736
2.1% to 13.68MMT as against 13.41MMT in 2QFY2015, while total throughput
Face Value (`)
10
increased 5% yoy to 19.98MMT as against 19.04MMT in 2QFY2015. Revenue
BSE Sensex
26,553
however declined 24% yoy on account of lower price realisations. The EBITDA at
Nifty
8,040
`695cr was much lower than our expectation of `3,714cr, owing to lower than
Reuters Code
IOC.BO
expected refining margins and high inventory losses. Refining margin at $0.9/bbl
Bloomberg Code
IOCL IN
was much lower than our expectation and compared to $10.8/bbl as in
1QFY2016. This was largely on account of reduced spreads and adventitious loss
of `1,197cr. We expect the impact from inventory losses to reduce going forward
Shareholding Pattern (%)
and profit to stabilise as crude prices stabilise at current levels.
Promoters
58.6
MF / Banks / Indian Fls
13.6
The commissioning of its state-of-the-art 15MMTPA coastal refinery at Paradip is
FII / NRIs / OCBs
3.3
expected to be fully operational in an integrated manner by Dec 2015. With its
Indian Public / Others
24.6
commissioning, IOCL’s refining capacity is set to increase by
~23% to
80.7MMTPA from the current capacity of 65.7MMTPA.
Outlook and valuation
Abs. (%)
3m 1yr
3yr
IOC is currently trading at an EV/EBITDA multiple of 5.4x its FY2017E EBITDA
Sensex
(5.4)
(4.7)
41.6
and 8.4x FY2017E EPS of `48.7. Lower oil prices resulting in significant reduction
IOCL
(3.5)
12.4
56.7
in under recoveries, expected improvements in refining margins and IOCL’s reach
make it a structural play on the refining sector. We apply a 6x multiple on its
3-year price chart
FY2017E EBITDA to arrive at our price target of `455 and retain our Accumulate
520
rating on the stock.
470
420
Key financials (Consolidated)
370
320
Y/E March (` cr)
FY2013
FY2014
FY2015
FY2016E
FY2017E
270
Net sales
4,66,837
4,94,528
4,49,509
3,59,607
4,02,760
220
170
% chg
12.9
5.9
(9.1)
(20.0)
12.0
120
Adj. net profit
4,427
5,976
3,753
10,308
11,831
70
% chg
(58.5)
35.0
(37.2)
174.6
14.8
Adj. EPS (`)
18.2
24.6
15.5
42.5
48.7
OPM (%)
3.0
3.5
2.3
5.9
6.1
Source: Company, Angel Research
P/E (x)
22.4
14.0
20.3
9.7
8.4
P/BV (x)
1.6
1.5
1.4
1.3
1.1
RoE (%)
5.9
10.6
7.1
14.1
14.3
RoCE (%)
5.5
6.8
3.6
11.6
12.7
Rahul Dholam
EV/Sales (x)
0.4
0.4
0.3
0.4
0.3
Tel: 022- 3935 7800 Ext: 6847
EV/EBIDTA
12.4
10.3
13.4
6.6
5.4
Source: Company, Angel Research
Please refer to important disclosures at the end of this report
1
Indian Oil Corporation | 2QFY2016 Result Update
Exhibit 1: 2QFY2016 performance (Standalone)
(` cr)
2QFY16
2QFY15
yoy%
1QFY16
qoq%
FY2015
FY2014
yoy%
Net Sales
85,115
1,11,305
(23.5)
1,01,009
(15.7)
4,32,330
4,54,985
(5.0)
Other Operating Income
270
359
(24.8)
298
(9.4)
17,178
39,543
(56.6)
Total Revenue
85,385
1,11,664
(23.5)
1,01,307
(15.7)
4,49,509
4,94,528
(9.1)
Material Expenses
74,233
1,02,676
(27.7)
81,889
(9.3)
3,99,121
4,32,808
(7.8)
% of net sales
86.9
92.0
80.8
88.8
87.5
Employee Cost
1,628
1,576
3.3
2,362
(31.1)
7,662
7,137
7.4
% of net sales
1.9
1.4
2.3
1.7
1.4
Other Expenses
8,829
7,768
13.7
6,956
26.9
32,189
37,490
(14.1)
% of net sales
10.3
7.0
6.9
7.2
7.6
Total expenditure
84,690
1,12,020
(24.4)
91,206
(7.1)
4,38,973
4,77,435
(8.1)
% of net sales
99.2
100.3
90.0
97.7
96.5
EBITDA
695
(356)
10,101
(93.1)
10,536
17,094
(38.4)
Margin (%)
0.8
-0.3
10.0
(916bp)
2.3
3.5
(264bp)
Interest
729
1,039
(29.8)
592
23.2
4,175
5,948
(29.8)
Depreciation
1,129
730
54.6
1,143
(1.3)
5,219
6,360
(17.9)
Other income
1,003
847
18.3
835
20.1
5,872
5,192
13.1
Exceptional items
0
0
0
0
0
Profit before tax
(160)
(1,278)
9,200
7,014
9,978
(29.7)
% of net sales
(0.2)
(1.1)
9.1
1.6
2.0
Tax
169
(380)
2,764
2,143
3,011
(28.8)
% of PBT
NM
29.7
30.0
30.5
30.2
Net Profit
(329)
(898)
6,436
4,872
6,967
(30.1)
Adj Net Profit
(326)
(1,289)
6,105
3,753
5,976
(37.2)
Source: Company, Angel Research
Exhibit 2: Standalone - 2QFY2016 Actual vs. estimates
(` cr)
Actual
Estimates
Variation (%)
Revenue
85,385
83,364
2.4
EBITDA
695
3,714
(81.3)
EBITDA margin (%)
0.8
4.5
(364bp)
Net Profit
(329)
1,614
NM
Source: Company, Angel Research
Result highlights
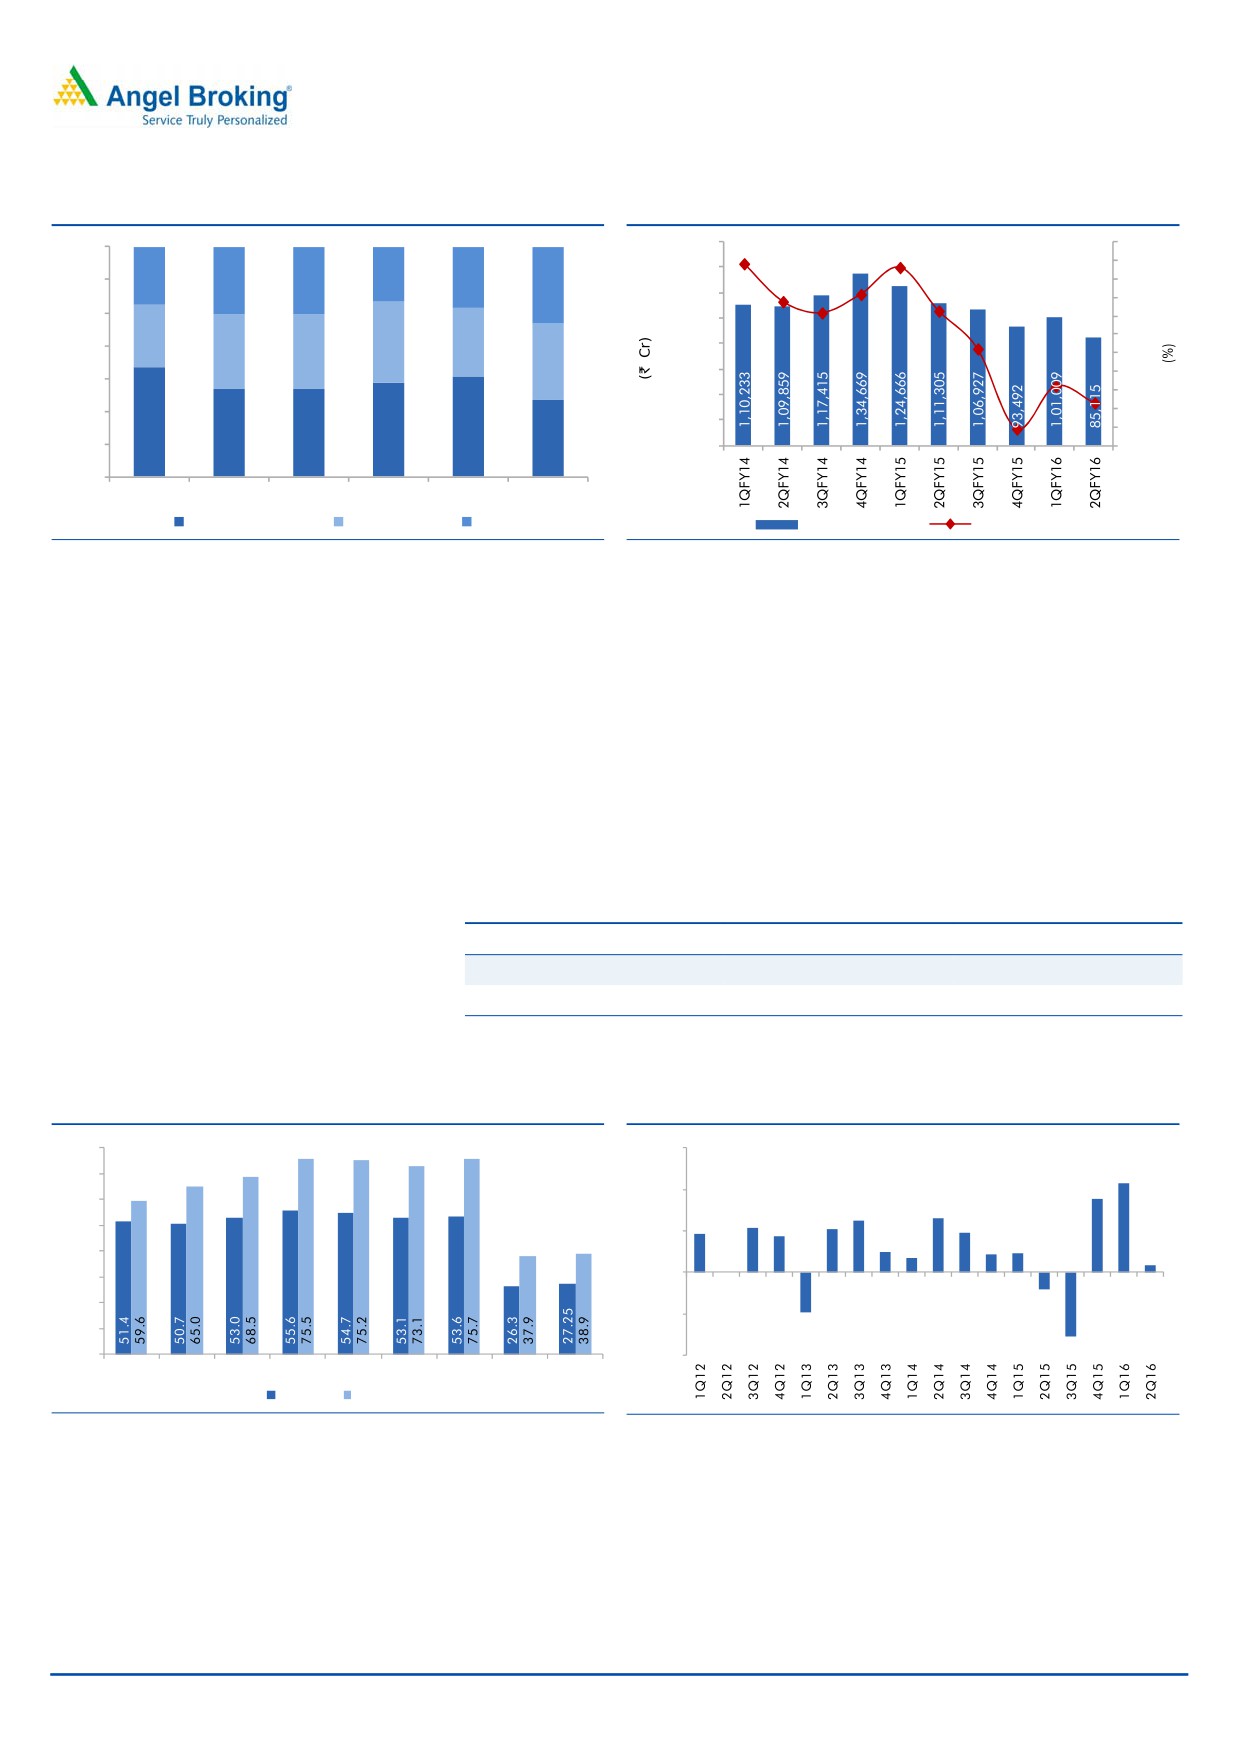
Revenue growth in line with expectation
IOCL’s 2QFY2016 revenue came in 2.4% ahead of estimate at `85,385, led by a
5.8% increase in product sales volumes to 19.07MMT as against 18.03MMT in
2QFY2015. Refining throughput increased
2.1% to
13.68MMT as against
13.41MMT in 2QFY2015, while total throughput increased 5% to 19.98MMT as
against 19.04MMT in 2QFY2015. Revenue however declined 24% yoy on account
of lower price realisations.
November 5, 2015
2
Indian Oil Corporation | 2QFY2016 Result Update
Exhibit 3: Revenue mix
Exhibit 4: :Lower realisations impact revenue
20
1,60,000
100%
15
1,40,000
3.5%
3.4%
3.7%
98%
4.1%
4.0%
4.7%
10
1,20,000
5
96%
1,00,000
0
3.9%
-5
94%
4.9%
4.2%
80,000
4.6%
4.6%
-10
4.6%
60,000
-15
92%
40,000
-20
90%
-25
93%
20,000
92%
-30
91%
91%
92%
88%
91%
-
-35
86%
1QFY15
2QFY15
3QFY15
4QFY15
1QFY16
2QFY16
Petroleum Revenue
Petrochemicals
Other Revenue
Net Sales (` Cr)
yoy change (%)
Source: Company, Angel Research
Source: Company, Angel Research
EBITDA decline led by inventory losses
IOCL reported an EBITDA of `695cr, much lower than our expectation of
`3,714cr, owing to lower than expected refining margins and high inventory
losses. Refining margin at $0.9/bbl was much lower than our expectation and
compared to $10.8/bbl as in 1QFY2016. This was largely on account of reduced
spreads and adventitious loss of `1,197cr. We expect the impact from inventory
losses to reduce going forward and profit to stabilise as crude prices stabilise at
current levels.
Exhibit 5: Refining Margins
1Q15
2Q15
3Q15
4Q15
1Q16
2Q16
IOC Refining Margin
2.3
(2)
(7.7)
8.8
10.8
0.9
Singapore GRM ($ / bbl)
5.8
4.8
6.3
8.6
8.0
6.3
Source: Company, Angel Research
Exhibit 6: Throughput volumes remain stable
Exhibit 7: Weak refining margins this quarter
15.0
80.0
10.8
70.0
8.8
10.0
60.0
6.6
6.2
5.3
5.2
4.7
4.3
4.8
50.0
5.0
2.4
1.7
2.2
2.3
40.0
0.9
0.0
0.0
30.0
20.0
(2.0)
(5.0)
10.0
(4.8)
-
(10.0)
(7.7)
FY09
FY10
FY11
FY12
FY13
FY14
FY15
1H15
1H16
Refineries Pipelines
Source: Company, Angel Research
Source: Company, Angel Research
November 5, 2015
3
Indian Oil Corporation | 2QFY2016 Result Update
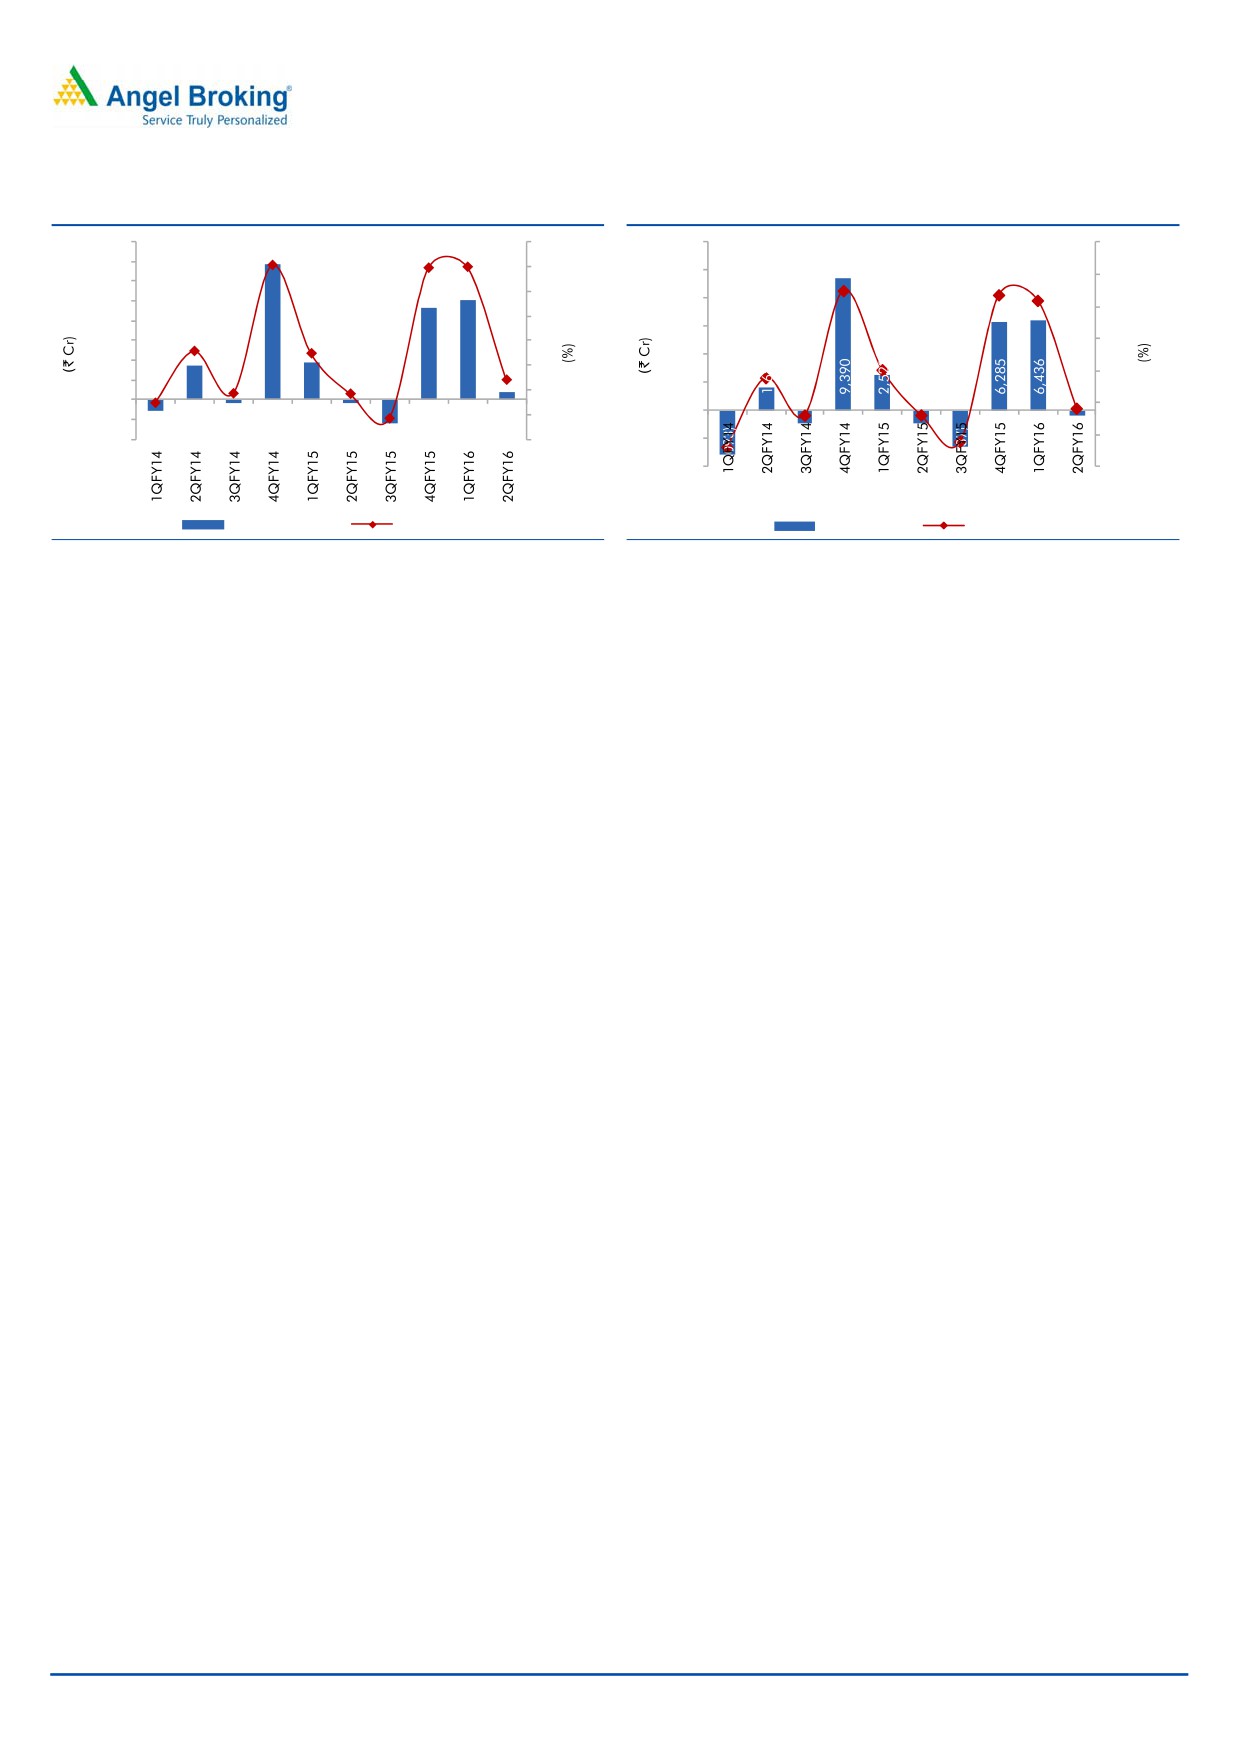
Exhibit 8: EBITDA margin declines to 0.8%
Exhibit 9: Net loss led by inventory losses
16,000
12
12,000
10
14,000
10
10,000
8
12,000
8
10,000
8,000
6
8,000
6
6,000
6,000
4
4
4,000
4,000
2
2
2,000
2,000
0
-
0
-2
-
(2,000)
(4,000)
-4
(2,000)
-2
(4,000)
-4
EBITDA (` Cr)
Margin (%)
PAT (` Cr)
Margin (%)
Source: Company, Angel Research
Source: Company, Angel Research
November 5, 2015
4
Indian Oil Corporation | 2QFY2016 Result Update
Investment arguments
Lower oil prices and government reforms transform OMCs into
structural plays
Lower oil prices coupled with oil & gas reforms are resulting in reduced net under
recoveries, higher margins and lower working capital requirements for oil
marketing companies (OMCs). Brent crude oil prices have declined significantly
over the last one year and this has resulted in significant reduction in gross under
recoveries. Gross under recoveries stood at a mere `4,793cr in the first half of this
fiscal as against `27,543cr in 1HFY2015. We expect oil prices to remain near
current levels, with pressure from US shale suppliers changing the dynamics of the
global oil industry. This will help the OMCs to keep their net under recoveries to a
minimum, enabling stable profitability.
Exhibit 10: Under recoveries almost eliminated
FY10
FY11
FY12
FY13
FY14
FY15
1H15
1H16
Gross Under Recovery
25,879
43,112
75,127
85,793
72,938
39,758
27,543
4,793
Sharing:
Upstream discount
7,548
16,704
29,619
31,967
34,674
23,597
17,205
1,340
Budgetary Support
15,172
22,605
45,486
53,278
37,182
14,960
9,161
3,448
Net Under Recovery
3,159
3,803
22
548
1,083
1,201
1,177
4
% of Gross Under Recovery
12.2%
8.8%
0.0%
0.6%
1.5%
3.0%
4.3%
0.1%
Source: Company, Angel Research
IOCL’s net under recoveries have also reduced, led by oil sector reforms such as
auto fuel deregulation and direct benefit transfer for LPG subsidies. Net under
recoveries for IOCL have reduced from ~12% in FY2010 to 3% in FY2015 and
0.1% in 1HFY2016. With oil prices under pressure, political interference to
regulate prices of auto fuels will remain low. We also expect stable oil prices to
minimize inventory losses going forward.
Paradip refinery to drive refining segment revenues
IOCL began the commissioning of its state-of-the-art 15 MMTPA coastal refinery at
Paradip in March 2015. The refinery is expected to be fully operational in an
integrated manner by Dec 2015. With its commissioning, IOCL’s refining capacity
is set to increase by
~23% to 80.7MMTPA from the current capacity of
65.7MMTPA. We expect throughput and refining revenues to increase in line with
increase in capacity.
The refinery, built at a cost of more than US$5bn, is one of the most modern
refineries in the world and categorized among the best refineries worldwide across
major performance parameters such as distillate yield, complexity factor and
energy consumption. With a nelson complexity of 12.2, it is designed to process a
broad range of crude, including heavy and high sulfur heavy crudes, along with
the capability to produce futuristic Euro-V standard fuels. Led by the increase in
marketing and refining margins, we expect IOCL to report a 380bp improvement
in EBITDA margin over FY2015-FY2017E.
November 5, 2015
5
Indian Oil Corporation | 2QFY2016 Result Update
Outlook and valuation
IOC is currently trading at an EV/EBITDA multiple of 5.4x its FY2017E EBITDA and
8.4x FY2017E EPS of `48.7. Lower oil prices resulting in significant reduction in
under recoveries, expected improvements in refining margins and IOCL’s reach
make it a structural play on the refining sector. We apply a 6x multiple on its
FY2017E EBITDA to arrive at our price target of `455 and retain our Accumulate
rating on the stock.
Exhibit 11: Valuation
` Cr
FY2017E Consolidated EBITDA
24,707
Multiple (x)
6
Total EV
1,48,243
Net Debt
50,084
Investments (0.8x BV)
12,855
Minority Interest
993
Equity Value
1,10,021
Target Price
455
Source: Company, Angel Research
Company background
Incorporated in 1959, Indian Oil Corporation Ltd (IOCL) is India’s leading oil
refiner with a capacity of 65.7MMTPA (31% market share). It is also the country’s
largest oil marketing company with a 42% market share and a pipeline network of
over 11,000km. IOCL is a ‘Maharatna’ company and is ranked 96th in the Fortune
Global 500 Company rankings.
November 5, 2015
6
Indian Oil Corporation | 2QFY2016 Result Update
Profit & loss statement (Consolidated)
Y/E March (` cr)
FY2013
FY2014
FY2015
FY2016E
FY2017E
Net Sales
4,66,837
4,94,528
4,49,509
3,59,607
4,02,760
% chg
12.9
5.9
(9.1)
(20.0)
12.0
Total Expenditure
4,52,945
4,77,435
4,38,973
3,38,266
3,78,053
Net Raw Materials
4,14,541
4,32,808
3,99,121
3,06,385
3,42,346
Other Mfg costs
30,620
37,490
32,189
25,751
28,841
Personnel
7,784
7,137
7,662
6,130
6,866
Other
-
-
-
-
-
EBITDA
13,892
17,094
10,536
21,341
24,707
% chg
17.8
23.0
(38.4)
102.6
15.8
(% of Net Sales)
3.0
3.5
2.3
5.9
6.1
Depreciation& Amort.
5,692
6,360
5,219
6,050
7,050
EBIT
8,201
10,734
5,317
15,291
17,657
% chg
26.4
30.9
(50.5)
187.6
15.5
(% of Net Sales)
1.8
2.2
1.2
4.3
4.4
Interest & other Charges
7,165
5,948
4,175
3,489
3,618
Other Income
3,468
5,192
5,872
3,523
3,558
Share in profit of Asso.
-
-
-
-
-
Profit before tax
4,504
9,978
7,014
15,325
17,598
% chg
12.7
121.5
(29.7)
118.5
14.8
Tax
877
3,011
2,143
5,057
5,807
(% of PBT)
19.5
30.2
30.5
33.0
33.0
PAT (reported)
3,627
6,967
4,872
10,268
11,791
Minority Interest
(822)
(119)
(40)
(40)
(40)
Net Profit
4,449
7,086
4,912
10,308
11,831
Adjusted Profit
4,427
5,976
3,753
10,308
11,831
% chg
(58.5)
35.0
(37.2)
174.6
14.8
(% of Net Sales)
0.9
1.2
0.8
2.9
2.9
November 5, 2015
7
Indian Oil Corporation | 2QFY2016 Result Update
Balance sheet (Consolidated)
Y/E March (` cr)
FY2013
FY2014
FY2015
FY2016E FY2017E
SOURCES OF FUNDS
Equity Share Capital
2,428
2,428
2,428
2,428
2,428
Reserves & Surplus
60,609
65,485
66,404
74,789
84,697
Shareholders Funds
63,037
67,913
68,832
77,217
87,125
Minority Interest
1,262
1,171
1,073
1,033
993
Total Loans
89,671
94,916
58,154
58,154
53,154
Deferred Tax Liability
6,332
6,423
6,836
6,836
6,836
Other Long term liabilities
11,874
14,135
15,930
16,408
16,900
Total Liabilities
1,72,176
1,84,557
1,50,826
1,59,648
1,65,008
APPLICATION OF FUNDS
Gross Block
1,15,182
1,26,982
1,38,745
1,63,745
1,88,745
Less: Acc. Depreciation
48,408
54,427
59,646
65,696
72,746
Net Block
66,774
72,554
79,098
98,048
1,15,998
Capital Work-in-Progress
27,240
38,061
38,061
22,837
7,993
Goodwill
0
0
0
0
0
Investments
17,351
15,895
16,069
16,069
16,069
Current Assets
1,23,880
1,34,003
93,778
87,682
96,248
Cash
1,220
3,705
1,221
1,502
3,070
Inventory
66,758
72,505
49,917
49,686
54,038
Debtors
12,502
12,552
7,645
7,725
7,724
Other
43,400
45,241
34,995
28,769
31,415
Current liabilities
69,702
82,254
82,870
71,810
78,259
Net Current Assets
54,177
51,749
10,909
15,871
17,989
Other Assets
6,633.8
6,297.5
6,689.4
6,823.2
6,959.6
Total Assets
1,72,176
1,84,557
1,50,826
1,59,648
1,65,008
November 5, 2015
8
Indian Oil Corporation | 2QFY2016 Result Update
Cash flow statement (Consolidated)
Y/E March (` cr)
FY2013
FY2014
FY2015
FY2016E FY2017E
Profit before tax
4,504
9,978
7,014
15,325
17,598
Depreciation
5,710
6,369
5,219
6,050
7,050
Change in Working Capital
(4,453)
5,451
28,111
(10,908)
2,097
Others
4,747
4,302
14,324
10,060
1,327
Direct taxes paid
(1,169)
(1,896)
(1,730)
(5,057)
(5,807)
Cash Flow from Operations
9,339
24,204
52,939
15,469
22,265
(Inc.)/ Dec. in Fixed Assets
(12,289)
(21,424)
(11,763)
(9,776)
(10,156)
(Inc.)/ Dec. in Investments
899
931
(174)
0
0
Share of profit/ (loss) from asso.
2,096
1,899
0
0
0
Cash Flow from Investing
(9,294)
(18,594)
(11,936)
(9,776)
(10,156)
Issue of Equity
-
-
-
-
-
Inc./(Dec.) in loans
9,668.1
5,597.5
(36,761.8)
-
(5,000.0)
Dividend Paid (Incl. Tax)
(1,492.2)
(1,850.1)
(2,549.7)
(1,923.0)
(1,923.0)
Others
(7,824.0)
(6,872.2)
(4,174.6)
(3,489.2)
(3,617.5)
Cash Flow from Financing
352
(3,125)
(43,486)
(5,412)
(10,541)
Inc./(Dec.) in Cash
398
2,485
(2,483)
281
1,568
Opening Cash balances
822
1,220
3,705
1,221
1,502
Closing Cash balances
1,220
3,705
1,221
1,502
3,070
November 5, 2015
9
Indian Oil Corporation | 2QFY2016 Result Update
Key Ratios (Consolidated)
Y/E March
FY2013
FY2014
FY2015
FY2016E
FY2017E
Per Share Data (`)
Reported EPS
18.3
29.2
20.2
42.5
48.7
Adjusted EPS
18.2
24.6
15.5
42.5
48.7
Cash EPS
41.8
55.4
41.7
67.4
77.8
DPS
6.2
8.7
6.6
6.6
6.6
Book Value
259.6
279.7
283.5
318.0
358.8
Valuation Ratio (x)
P/E (on FDEPS)
22.4
14.0
20.3
9.7
8.4
P/CEPS
9.8
7.4
9.8
6.1
5.3
P/BV
1.6
1.5
1.4
1.3
1.1
Dividend yield (%)
1.5
2.1
1.6
1.6
1.6
EV/Sales
0.4
0.4
0.3
0.4
0.3
EV/EBITDA
12.4
10.3
13.4
6.6
5.4
EV/Total Assets
1.0
1.0
0.9
0.9
0.8
Returns (%)
ROCE
5.5
6.8
3.6
11.6
12.7
ROE
5.9
10.6
7.1
14.1
14.3
Turnover ratios (x)
Asset Turnover (Gross Block)
4.2
4.1
3.4
2.4
2.3
Inventory (days)
51.1
51.4
49.7
50.5
47.0
Receivables (days)
9.4
9.2
8.2
7.8
7.0
Payables (days)
51.2
56.1
67.0
78.5
68.0
WC cycle (ex-cash) (days)
40.0
37.3
23.4
12.2
13.3
Solvency ratios (x)
Net debt to equity
1.4
1.3
0.8
0.7
0.6
Net debt to EBITDA
1.0
1.0
1.0
1.0
0.9
Interest Coverage (EBIT / Int.)
1.1
1.8
1.3
4.4
4.9
November 5, 2015
10
Indian Oil Corporation | 2QFY2016 Result Update
Research Team Tel: 022 - 39357800
DISCLAIMER
Angel Broking Private Limited (hereinafter referred to as “Angel”) is a registered Member of National Stock Exchange of India Limited,
Bombay Stock Exchange Limited and Metropolitan Stock Exchange of India Limited. It is also registered as a Depository Participant with
CDSL and Portfolio Manager with SEBI. It also has registration with AMFI as a Mutual Fund Distributor. Angel Broking Private Limited is
a registered entity with SEBI for Research Analyst in terms of SEBI (Research Analyst) Regulations, 2014 vide registration number
INH000000164. Angel or its associates has not been debarred/ suspended by SEBI or any other regulatory authority for accessing
/dealing in securities Market. Angel or its associates including its relatives/analyst do not hold any financial interest/beneficial
ownership of more than 1% in the company covered by Analyst. Angel or its associates/analyst has not received any compensation /
managed or co-managed public offering of securities of the company covered by Analyst during the past twelve months. Angel/analyst
has not served as an officer, director or employee of company covered by Analyst and has not been engaged in market making activity
of the company covered by Analyst.
This document is solely for the personal information of the recipient, and must not be singularly used as the basis of any investment
decision. Nothing in this document should be construed as investment or financial advice. Each recipient of this document should
make such investigations as they deem necessary to arrive at an independent evaluation of an investment in the securities of the
companies referred to in this document (including the merits and risks involved), and should consult their own advisors to determine
the merits and risks of such an investment.
Reports based on technical and derivative analysis center on studying charts of a stock's price movement, outstanding positions and
trading volume, as opposed to focusing on a company's fundamentals and, as such, may not match with a report on a company's
fundamentals.
The information in this document has been printed on the basis of publicly available information, internal data and other reliable
sources believed to be true, but we do not represent that it is accurate or complete and it should not be relied on as such, as this
document is for general guidance only. Angel Broking Pvt. Limited or any of its affiliates/ group companies shall not be in any way
responsible for any loss or damage that may arise to any person from any inadvertent error in the information contained in this report.
Angel Broking Pvt. Limited has not independently verified all the information contained within this document. Accordingly, we cannot
testify, nor make any representation or warranty, express or implied, to the accuracy, contents or data contained within this document.
While Angel Broking Pvt. Limited endeavors to update on a reasonable basis the information discussed in this material, there may be
regulatory, compliance, or other reasons that prevent us from doing so.
This document is being supplied to you solely for your information, and its contents, information or data may not be reproduced,
redistributed or passed on, directly or indirectly.
Neither Angel Broking Pvt. Limited, nor its directors, employees or affiliates shall be liable for any loss or damage that may arise from
or in connection with the use of this information.
Note: Please refer to the important ‘Stock Holding Disclosure' report on the Angel website (Research Section). Also, please refer to the
latest update on respective stocks for the disclosure status in respect of those stocks. Angel Broking Pvt. Limited and its affiliates may
have investment positions in the stocks recommended in this report.
Disclosure of Interest Statement
Indian Oil Corporation
1. Analyst ownership of the stock
No
2. Angel and its Group companies ownership of the stock
No
3. Angel and its Group companies' Directors ownership of the stock
No
4. Broking relationship with company covered
No
Note: We have not considered any Exposure below ` 1 lakh for Angel, its Group companies and Directors
Ratings (Based on expected returns
Buy (> 15%)
Accumulate (5% to 15%)
Neutral (-5 to 5%)
over 12 months investment period):
Reduce (-5% to -15%)
Sell (< -15)
November 5, 2015
11