1QFY2017 Result Update | Infrastructure
September 15, 2016
IL&FS Transportation Networks (ITNL)
NEUTRAL
CMP
`91
Performance Highlights
Target Price
-
Quarterly highlights - Consolidated
Investment Period
-
Y/E March (` cr)
1QFY17
1QFY16
% chg (yoy)
Net sales
937
905
3.6
Stock Info
EBITDA
30
56
(47.0)
Reported PAT
18
(19)
nmf
Sector
Infrastructure
Source: Company, Angel Research; nmf- Not Meaningful
Market Cap (` cr)
3,008
IL&FS Transportation Networks (ITNL) in 1QFY2017 has not reported consol.
Net debt (` cr)
26,768
numbers as it is in process of migrating to Ind-AS. Despite strong execution,
Beta
0.8
sharp decline in yoy Fee and O&M income led ITNL report 3.6% increase in
52 Week High / Low
102/64
standalone revenues. High contribution of low margin construction business was
Avg. Daily Volume
973,974
seen during in 1QFY2017 (construction/ material expenses reported 19.5/11%
yoy increase). As a result, yoy EBITDA margins contracted 302bps to 3.2%.
Face Value (`)
10
Despite 47% yoy EBITDA decline, reported PAT turned-around on yoy basis to
BSE Sensex
28,372
`18cr profit in 1QFY2017, owing to strong other income (up 75.9% yoy to
Nifty
8,727
`344cr). Other income benefitted from `102cr of profit booked from 15% stake
Reuters Code
ILFT.BO
sale in Gujarat Road & Infrastructure Company Ltd. (GRICL).
Bloomberg Code
ILFT@IN
ITNL reported order backlog of `13,758cr at 1QFY2017-end, which gives
construction segment revenue visibility for 36+ months. Consolidated debt in our
Shareholding Pattern (%)
view stood at `28,650cr, reflecting D/E of 4.4x. ITNL’s equity requirement
towards BOT projects for FY2017-18E stands at ~`673cr. 3 BOT projects are to
Promoters
73.2
report Date of Completion (CoD) in next few months, in-turn contributing
MF / Banks / Indian Fls
0.7
FY2017-18E Toll/ Annuity Income.
FII / NRIs / OCBs
7.2
Outlook and Valuation: In recent time we have seen management offloading
Indian Public / Others
18.9
stake in 2 operational BOT projects. ITNL management announced that they
intend to offload 3-4 BOT projects, worth `5,000cr in to an Infrastructure
Abs. (%)
3m
1yr
3yr
Investment Trust (InvIT). As per a recent board meeting outcome, ITNL would
Sensex
7.0
9.3
43.7
issue `5,000cr of Non-Convertible Debentures (NCDs), where current 12% debt
cost would be re-financed sub-10% levels, thereby saving ~300bps on interest
ITNL
20.0
(4.1)
(12.8)
expenses level. All these initiatives would de-leverage Balance sheet and improve
the profitability. We earlier upgraded ITNL to BUY with price target of `93, in
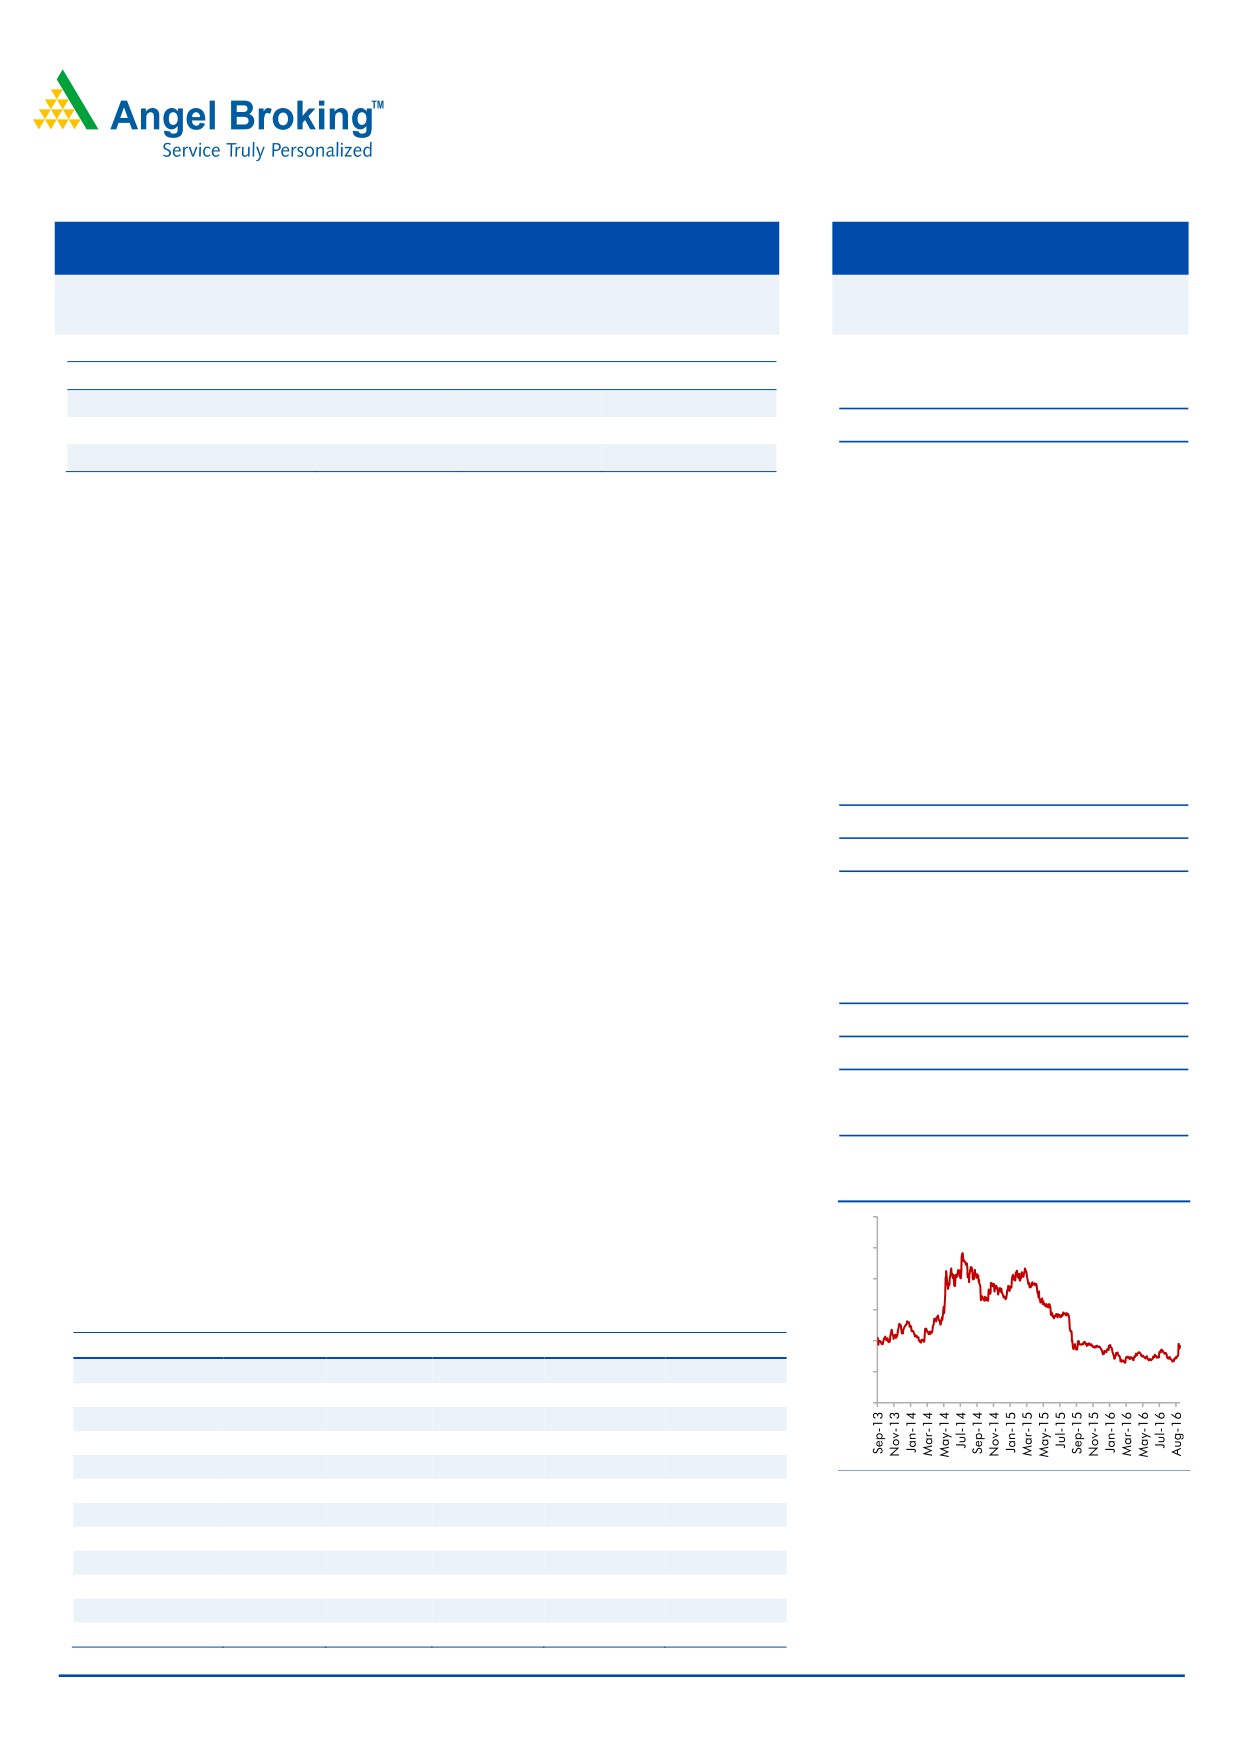
3-Year Daily Price Chart
anticipation of lowering of consol. BS stress and likely improvement in interest
300
coverage ratio. Since our BUY recommendation, ITNL stock has run-up and our
250
price target is attained. In absence of ITNL’s consolidated financials, we
200
downgrade to NEUTRAL view on the stock.
150
Key financials (Consolidated)
100
Y/E March (` cr)
FY14
FY15
FY16
FY17E
FY18E
Net Sales
6,587
6,304
7,947
8,946
10,017
50
% chg
(0.9)
(4.3)
26.1
12.6
12.0
0
Net Profit
463
444
232
266
299
% chg
(11.0)
(4.2)
(47.7)
14.5
12.6
EBITDA (%)
28.7
30.8
30.8
31.0
31.6
EPS (Rs)
19
14
7
8
9
Source: Company, Angel Research
P/E (x)
4.9
6.4
13.0
11.3
10.1
P/BV (x)
0.5
0.4
0.4
0.4
0.4
RoE (%)
10.6
7.5
4.3
4.2
5.0
RoCE (%)
8.3
6.7
6.8
6.8
7.2
Yellapu Santosh
EV/Sales (x)
3.1
3.9
3.7
3.7
3.4
022 - 3935 7800 Ext: 6828
EV/EBITDA (x)
10.8
12.8
12.2
11.8
10.7
Source: Company, Angel Research; CMP as of 14 Sep, 2016
Please refer to important disclosures at the end of this report
1
ITNL | 1QFY2017 Result Update
Exhibit 1: Quarterly Performance (Standalone)
Particulars (` cr)
1QFY17
1QFY16
% chg (yoy)
Net Sales
937
905
3.6
Total Expenditure
908
849
6.9
Cost of materials consumed
15
13
11.0
Construction Contract Cost
780
653
19.5
Employee benefits Expense
15
12
23.8
Other Expenses
99
172
(42.4)
EBITDA
30
56
(47.0)
EBIDTA %
3.2
6.2
Depreciation
2
2
(6.6)
EBIT
27
54
(48.9)
Interest and Financial Charges
331
281
17.9
Other Income
344
196
75.9
PBT before Exceptional Items
40
(32)
nmf
Exceptional Items
0
0
PBT after Exceptional Items
40
(32)
nmf
Tax Expenses/ (credit) (note)
22
(13)
nmf
% of PBT
55.5
41.6
PAT
18
(19)
nmf
PAT %
1.9
(2.1)
Comprehensive Income
0
1
nmf
Total Comprehensive Income
18
(18)
nmf
Dil. EPS
0.54
(0.76)
nmf
Source: Company, Angel Research; Note: nmf- Not meaningful;*Reported as per Ind AS, FY2016
numbers & other remaining quarters continue to be reported as per Indian GAAP; It needs to be
noted that yoy growth for FY2017E is not comparable as FY2016 continues to be reported under
Indian GAAP
Update on Consolidated business
ITNL in 1QFY2017 has not reported consolidated numbers as it is in the process of
migrating to Ind-AS (Accounting Standards). Management indicated that it would
report consolidated numbers from 4QFY2017E onwards.
Update on Standalone business
Despite strong execution, low Fee income restricts yoy sales growth
ITNL reported standalone numbers which are in compliance with the new Ind-AS.
Weak Fee income led ITNL report just 3.6% yoy increase in revenues to `937cr.
Reported 1QFY2017 revenues are below our estimate. Construction income grew
22.1% yoy to `884cr, with revenues booked from CNTL, KSEL, RMGSL and BAEL
projects.
ITNL reported sharp yoy decline in fee income to `18cr (vs `156cr in 1QFY2016).
Higher O&M income was seen in 1QFY2016 on a/c of overlaying activities. In
absence of such works in 1QFY2017, ITNL witnessed sharp fall in O&M income.
September 15, 2016
2
ITNL | 1QFY2017 Result Update
EBITDA margins decline to 3.2%
Shift in revenue mix, where high contribution of low margin Construction business
was seen during the quarter, led to 302bp yoy EBITDA margin contraction to 3.2%.
EBITDA margin contraction on yoy basis was owing to 19.5% rise in construction
contract expenses (to `780cr), and 11% increase in material expenses (to `15cr).
Increase in yoy construction expenses is owing to ongoing works at BAEL, CNTL
and RMGSL, amongst other project.
High other income led to yoy PAT turn-around
Despite 47.0% yoy EBITDA decline, PAT turned-around on yoy basis from `19cr
loss in 1QFY2016 to `18cr profit in 1QFY2017, owing to strong other income (up
75.9% yoy to `344cr). ITNL reported PAT margins of 1.9% in 1QFY2017 (vs. 2.1%
loss margins in 1QFY2016). Other income in 1QFY2017 benefitted from `102cr
of profit booked from 15% stake sale in Gujarat Road & Infrastructure Company
Ltd. (GRICL), an operational BOT road project. Increase in yoy Loans & Advances
(at ~`3,200cr) also contributed to higher other income numbers in 1QFY2017.
Notably, interest expenses of ITNL increased 17.9% yoy to `331cr, reflecting
increase in standalone debt. Standalone debt increased 15.5% yoy from `8,052cr
in 1QFY2016 to `9,296cr in 1QFY2017.
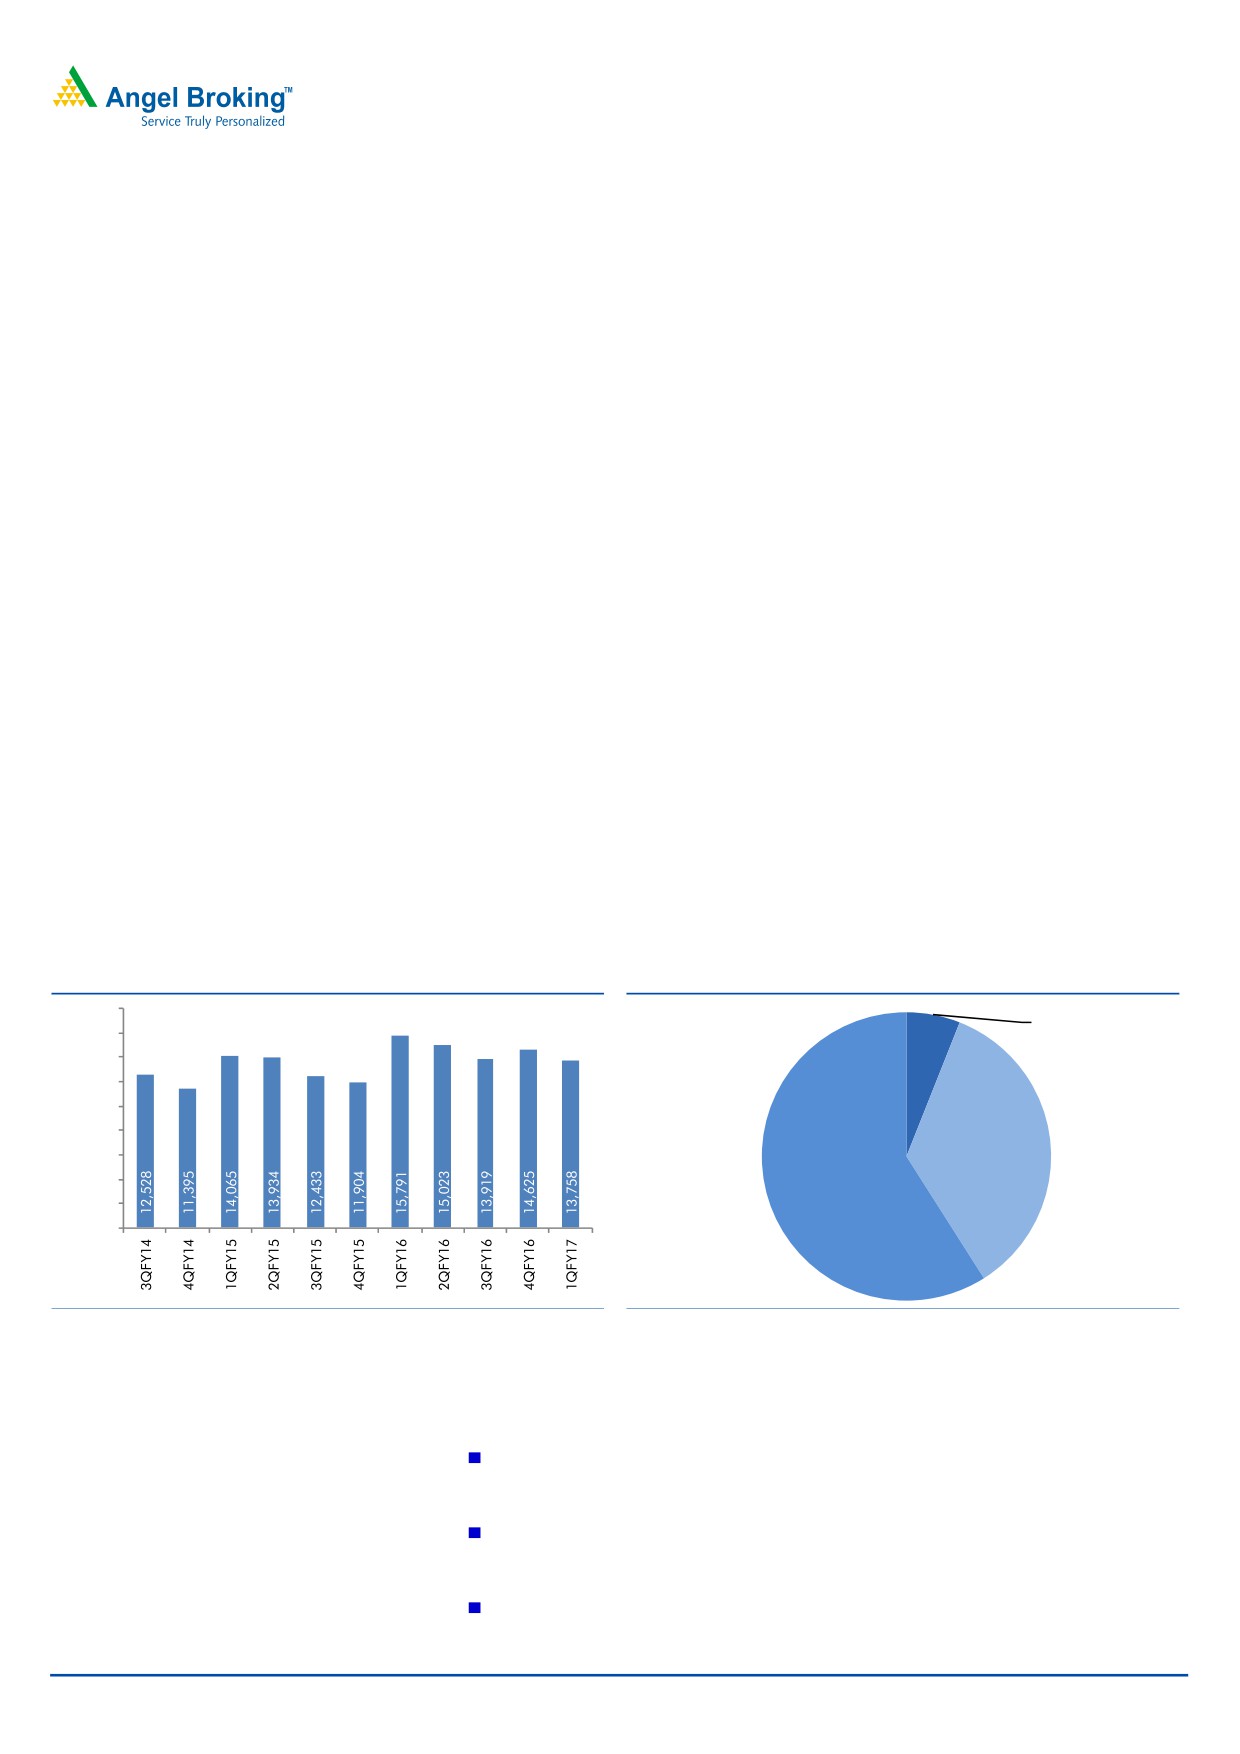
Strong Order backlog of `13,758cr gives better revenue visibility
ITNL at 1QFY2017-end reported order backlog of
`13,758cr, which gives
Construction segment revenue visibility for over 36+ months.
Exhibit 2: Order Book stands at `13,758cr
Exhibit 3: Order Book Split at 1QFY2017-end...
18,000
(` in cr)
Non-Road
16,000
Projects, 7%
14,000
12,000
10,000
8,000
Non-NHAI
6,000
Road , 35%
4,000
NHAI, 59%
2,000
0
Source: Company, Angel Research
Source: Company, Angel Research
ITNL to-date has reported 6 Infrastructure project wins since FY2016 beginning.
Details of these projects are as follows:
4-laning of 141km stretch between Fagne-Gujarat/ Maharashtra Border
(Package-III, NH-6) on BOT (Toll) basis.
4-laning of 194km stretch between Amravati-Chikhli (Package-I, NH-6) on
BOT (Toll) basis.
6-laning of 23.5km stretch between Ranchi Ring Road, section VII from
Kathitanr to Karma on BOT basis.
September 15, 2016
3
ITNL | 1QFY2017 Result Update
Upgrade 2 road projects, (i) Bandri-Jaruwakheda, Nirtala-Mandi-Bamora and
Damoh-Hindoriya-Patera section covering 76.2km, (ii) Pachawali-Rannod,
Rannod-Pichhore, Bhasula-Chainpur, Vijaypur-Dhanrawad and Ashok Nagar-
Thubon section on performance based contract.
Development of Commercial Area and Automated Car Park of approx. 1200
car spaces on DBFOT Basis including right to collect revenue from the project
for a period of 30 years in the Middle East.
Ethiopian Roads Authority has awarded ITNL and Elsamex (a wholly owned
subsidiary of ITNL) joint venture Design, Improvement Works and
Management and Maintenance Services of (i) Nekempte-AngerGutin-Andhode
Road Section (86.1km), (ii) Agamsa-Bure Road Section (84.6km) on an Output
and Performance Based Road Contract (OPRC) for approx. contract value of
`1,524.7cr. This project is for a period of 8 years.
ITNL indicated healthy bid-pipeline of ~`45,990cr, with a major ~`30,768cr of it
being at RFP stage. Notably, ~29% of bid pipeline highlighted is from NHAI.
Exhibit 4: 1QFY2017 Bid Pipeline details
Particular (` cr)
RFP Stage
RFQ Stage
NHAI Projects
5,990
7,523
State Highway Projects
14,212
6,264
MoRTH Projects
9,090
0
NHAI EPC Projects
0
0
Metro Transportation Corp. Project
1,476
1,435
Total Bid Pipeline
30,768
15,222
Source: Company, Angel Research
Update on per day income of the BOT Projects
Cumulative Toll income (on per day basis) of the road projects portfolio, reported
16.6% yoy increase in per day Toll income to `5.4cr. Notably 4 of them reported
impressive yoy growth, inclusive of, (1) 41.6% increase in per day toll income at
RIDCOR-Mega Highway project (to avg. per day toll of `0.98cr),
(2)
14.1%
increase in Baleshwar Kharagpur BOT project (to avg. per day toll of `0.17cr), (3)
38.9% yoy increase in Pune Solapur BOT project (to avg. per day toll of `0.30cr)
and (4) 22.7% yoy increase in Barwa Adda BOT project (to avg. per day toll of
`0.20cr). These 4 BOT-Toll projects together contributed 30% of total 1QFY2017
toll income.
1QFY2017 Annuity income per day benefitted from contribution of JSEL BOT
project on yoy basis.
September 15, 2016
4
ITNL | 1QFY2017 Result Update
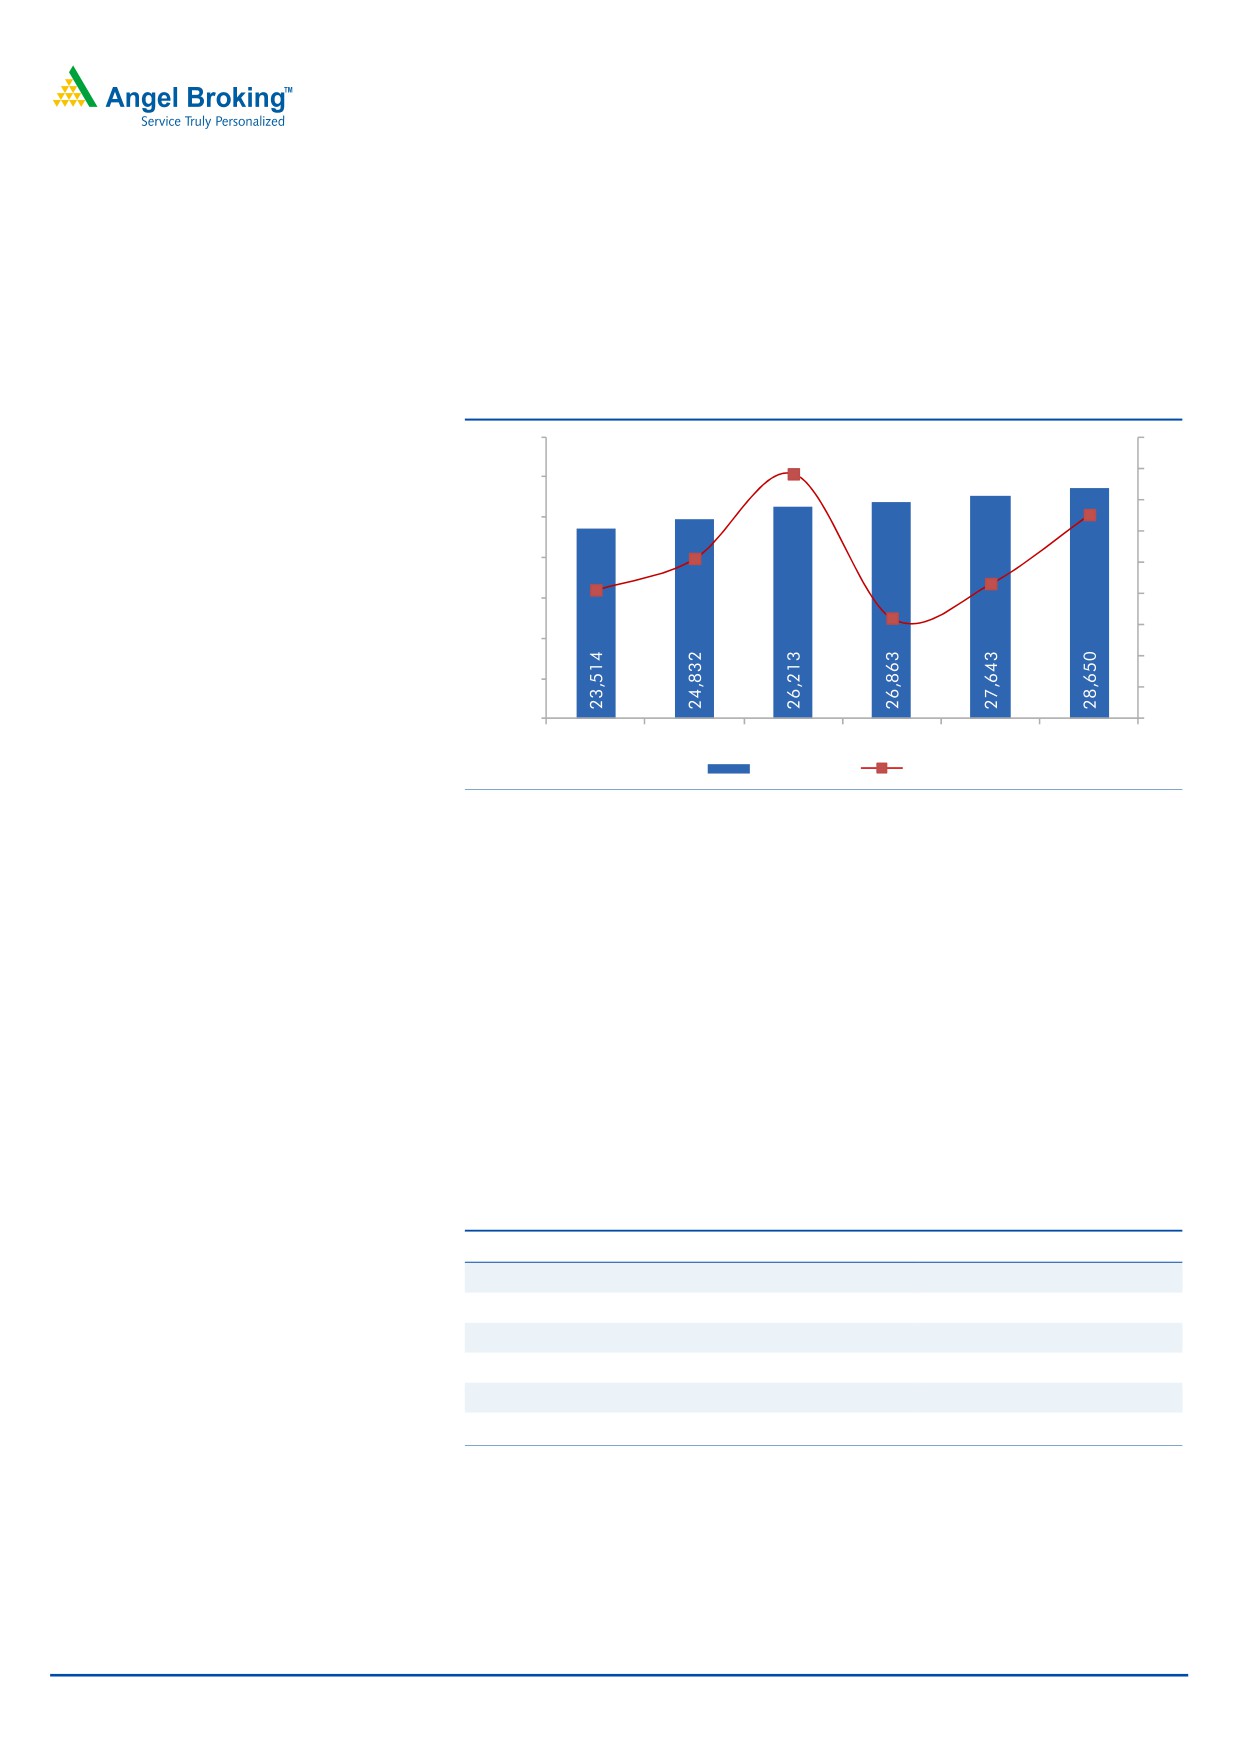
Financial Health of the company
Management highlighted that ITNL has ended the quarter with similar debt levels
as it was in the previous quarter. Considering the 3.4% qoq increase in 1QFY2017
standalone debt (to `9,296cr), we expect consol. debt to be at `28,650cr,
reflecting consol. D/E ratio of 4.4x.
Exhibit 5: Consolidated Debt & D/E Ratio
35,000
4.6
4.5
4.5
30,000
4.4
4.4
25,000
4.2
4.3
20,000
4.1
4.2
4.1
15,000
4.0
4.1
4.0
10,000
3.9
5,000
3.8
0
3.7
4QFY15
1QFY16
2QFY16
3QFY16
4QFY16
1QFY17
Debt (` cr)
D/E (x)
Source: Company, Angel Research
As of 1QFY2017-end, ITNL management in concall highlighted that they require
`1,007cr as equity investment towards BOT projects (to-date equity invested in
BOT project stands at ~`5,300cr). Of the required `1,007cr equity, `454cr is to
be deployed in remaining 3 quarters of FY2017E and `219cr in FY2018E, and the
balance `334cr thereafter in FY2019-21E.
Projects Schedule
ITNL’s Management highlighted that additional equity requirement of existing BOT
projects are to the tune of ~`1,007cr (majorly to be invested in next few years).
3 of the ongoing BOT projects are expected to get Date of Completion (CoD) in
next few months, thereby adding to Toll/ Annuity income in FY2017E.
Exhibit 6: BOT Projects Scheduled CoD
BOT Projects
Scheduled CoD
BAEL
Oct-2016
KSEL
Oct-2016
CNTL
Oct-2016
KNC
Feb-2018
Jharkhand Road stretches
Aug-2018
SSTL
Apr-2020
Source: Company, Angel Research
Owing to the recent emergence of land acquisition issues (land owners are now
demanding higher compensation for already sold land) at KNC, management has
revised the scheduled CoD to Feb-2018.
September 15, 2016
5
ITNL | 1QFY2017 Result Update
Downgrade to Neutral as price target is achieved…
Despite ITNL’s robust order backlog and strong execution capabilities, we were
concerned about its higher consol. D/E ratio, which was eating into its profits. The
fund raising initiatives (rights issue), stake sale in 2 of the BOT projects, re-
financing of high cost debt with low cost (by issuing `1,300cr of Non-Convertible
Debentures), all these initiatives are in the right direction, to de-leverage the BS
and improve the profitability. ITNL management announced that they are in the
process of offloading 3-4 BOT projects worth `5,000cr in to an Infrastructure
Investment Trust (InvIT). Also, as per their board meeting outcome, ITNL would
issue `5,000cr of NCDs, where they intend to re-finance the high cost debt (of
12%) with low cost (at sub-10% levels), thereby saving ~200bps on interest
expenses.
We earlier upgraded the ITNL stock to BUY with price target of `93, in anticipation
of lowering of consol. BS stress and likely improvement in their interest coverage
ratio. Since our BUY recommendation, ITNL stock has run-up and our price target
is attained.
In absence of ITNL’s consolidated financials, we downgrade to NEUTRAL view
on the stock.
September 15, 2016
6
ITNL | 1QFY2017 Result Update
Exhibit 7: Derivation of SOTP-based target price for ITNL (FY2017E)
FY17E Std.
Target
Target
Value/
% of
Particulars
Segment
Basis
EBITDA (` cr)
Multiple
Value (` cr)
share (`)
SoTP
ITNL's construction business
Construction
942
5.0
4,708
143
77.8
EV/EBITDA of 5x
Total
4,708
143
77.8
Discounted
Project
Adj. FCFE
Value/
% of
Particulars
Proj. Type
Basis
FCFE (` cr)
Stake
Value (` cr)
share (`)
SoTP
Road BOT projects
Noida Toll Bridge
Toll
728
26%
192
6
3.2
NPV at CoE of 14%
Gujarat Toll Roads
Toll
603
42%
253
8
4.2
NPV at CoE of 14%
West Gujarat Expressway
Toll
133
100%
133
4
2.2
NPV at CoE of 14%
RIDCOR Phase-I & II
Toll
1,249
50%
624
19
10.3
NPV at CoE of 14%
Beawar-Gomti
Toll
120
100%
120
4
2.0
NPV at CoE of 14%
Pune Sholapur
Toll
56
91%
51
2
0.8
NPV at CoE of 14%
Moradabad Bareilly
Toll
201
100%
201
6
3.3
NPV at CoE of 14%
Chandrapur Warora
Toll
118
35%
41
1
0.7
NPV at CoE of 14%
Narkatpally Addanki
Toll
613
50%
306
9
5.0
NPV at CoE of 14%
Kiratpur Ner-Chowk
Toll
1,185
100%
1,185
36
19.5
NPV at CoE of 14%
Sikar Bikaner
Toll
154
100%
154
5
2.5
NPV at CoE of 14%
Baleshwar Kharagpur
Toll
143
100%
143
4
2.4
NPV at CoE of 14%
North Karnataka Expressway
Annuity
311
100%
311
9
5.1
NPV at CoE of 14%
Thiruvananthapuram Phase - I & II
Annuity
375
100%
375
11
6.2
NPV at CoE of 14%
Hyderabad Ring Road
Annuity
123
26%
32
1
1.0
NPV at CoE of 14%
East Hyderabad Expressway
Annuity
22
74%
16
0
2.0
NPV at CoE of 14%
Hazaribagh Ranchi Expressway
Annuity
44
74%
32
1
2.5
NPV at CoE of 14%
Jharkhand roads Ph-I & II
Annuity
40
93%
37
1
21.2
NPV at CoE of 14%
Chenani Nashri
Annuity
625
100%
625
19
24.8
NPV at CoE of 14%
Jorabat Shillong
Annuity
172
50%
86
3
3.7
NPV at CoE of 14%
Total
7,243
5,110
155
83.7
Elsamax
272
1.5
408
12
6.7
Valued at 1.5x its BV
YuHe Expressway
Toll
191
1.5
286
9
4.7
Valued at 1.5x its BV
Vansh Nimay Infraprojects
15
1.0
15
0
0.2
Valued at 1.0x its BV
Metro Rail Gurgaon
FCFE
385
34%
130
4
2.1
Valued at 1.0x its BV
MP Entry Point project
110
51%
56
2
0.9
Valued at 1.0x its BV
Other Investments
98
1.0
98
3
1.6
Valued at 1.0x its BV
Net Debt- FY2016E
(7,713)
(234)
Standalone Net Debt
Grand Total
95
100.0
No. of shares
33
Upside
4%
CMP
91
Source: Company, Angel Research
September 15, 2016
7
ITNL | 1QFY2017 Result Update
Investment arguments
Market leader in the growing BOT space: ITNL is a surface transport player, with
an established track record of successfully bidding, developing and operating road
BOT projects on a commercial basis. ITNL was one of the first movers in the road
development segment. The company bagged Noida Toll bridge project in 1998.
Since then, it has come a long way and has built sizeable portfolio currently. The
company has one of the largest BOT portfolios in India, encompassing 31 road
projects covering 14,699 lane kms spread across 16 states. Their 1QFY2017
order book at `13,758cr, gives construction segment revenue visibility for 36+ months.
Pan-India presence: ITNL has 31 BOT Road projects well spread across 16 states
in India. The company has decent exposure to state highways, which differentiates
it from peers. The one major advantage that state highway projects enjoy over
national highways is that they can be bundled with land, making the projects
viable. Such diversification strategy prevents the company from any fluctuation in
the revenue stream given its limited exposure to any one region or project.
Hedged revenue stream: We believe ITNL has a hedged road BOT asset portfolio
currently, as it is bifurcated into toll and annuity projects in revenue terms, thereby
reducing its dependence on traffic-related revenue inflow. Recent project win from
Kenyan BOT-Annuity project strengthens our view that going forward too, ITNL
would continue to have a balanced revenue mix of Annuity and Toll.
ITNL’s continues with its BS de-leveraging process: ITNL is currently sitting on a
consol. D/E ratio of 4.4x (reflecting debt of `28,650cr). It has sold 2 BOT projects,
re-financing high cost debt with low cost debt, currently is in process of coming-out
with an InvIT, 3 BOT projects would start operations in next few months, comfort us
that ITNL should see the benefits of its Balance Sheet de-leveraging process, going
forward.
Key concerns
Even though expectations are high for allocation towards Roads and Highways
vertical in the upcoming budget, any slowdown in the award activity from NHAI
could affect road-focused players such as ITNL.
ITNL has faced execution delays across few projects. Prolonged delays in project
execution beyond the time schedule could act as risk to our estimates.
BOT projects are inherently highly-levered projects. Hence, delays in the correction
of interest rates than our expectations could be a risk to our assumptions.
Management has highlighted plans to pursue strategic initiatives which should
materialize in the next few quarters. Any delays beyond that could act as a risk to
our estimates.
September 15, 2016
8
ITNL | 1QFY2017 Result Update
Company background
ITNL promoted by IL&FS was incorporated in Nov 2000. Over the years, ITNL
emerged as the largest Surface Transportation Infrastructure Company in Indian.
ITNL is involved in the development, operations and maintenance of surface
transportation infrastructure projects encompassing national and state highways,
roads, tunnels, flyovers and bridges. The company performs a range of project
development activities from project conceptualization to commissioning and
commencement of commercial operations. ITNL has presence in various surface
transportation sub-sectors, such as urban transportation, railways, border check
posts and parking complexes.
September 15, 2016
9
ITNL | 1QFY2017 Result Update
Profit & Loss Statement (Consolidated)
Y/E March (` cr)
FY14
FY15
FY16
FY17E
FY18E
Net Sales
6,587
6,304
7,947
8,946
10,017
% Chg
(0.9)
(4.3)
26.1
12.6
12.0
Total Expenditure
4,697
4,362
5,497
6,177
6,847
Cost of Materials Consumed
227
242
282
300
332
Construction Contract Cost
2,984
2,599
3,501
3,932
4,287
Employee benefits Expense
414
459
510
581
661
Other Expenses
1,072
1,063
1,203
1,364
1,568
EBITDA
1,890
1,941
2,451
2,769
3,169
% Chg
2.8
2.7
26.2
13.0
14.5
EBIDTA %
28.7
30.8
30.8
31.0
31.6
Depreciation
151
152
275
343
413
EBIT
1,739
1,789
2,175
2,426
2,757
% Chg
(0.3)
2.9
21.6
11.5
13.6
Interest and Financial Charges
1,471
1,833
2,531
2,796
2,859
Other Income
215
525
785
824
659
PBT
483
481
429
454
556
Tax
27
80
160
159
195
% of PBT
5.5
16.7
37.3
35.0
35.0
PAT before Extraordinary item
457
400
269
295
362
Extraordinary item
0
0
0
0
0
PAT before Minority Interest
457
400
269
295
362
Min Int. & Share of
6
(44)
37
30
63
Profit/ (Loss) of Associates
PAT after MI, profit share
463
444
232
266
299
from Assoc.
% Chg
(11.0)
(4.2)
(47.7)
14.5
12.6
PAT %
7.0
7.0
2.9
3.0
3.0
Diluted EPS
19
14
7
8
9
% Chg
(36.5)
(23.2)
(50.8)
14.5
12.6
Note: nmf- Not meaningful;*Reported as per Ind AS, FY2016 numbers & other remaining quarters
continue to be reported as per Indian GAAP; It needs to be noted that yoy growth for FY2017E is
not comparable as FY2016 continues to be reported under Indian GAAP
September 15, 2016
10
ITNL | 1QFY2017 Result Update
Balance Sheet (Consolidated)
Y/E March (` cr)
FY14
FY15
FY16
FY17E
FY18E
Sources of Funds
Equity Capital
571
623
705
705
705
Reserves Total
4,433
5,096
5,988
6,528
6,480
Networth
5,004
5,719
6,693
7,234
7,185
Minority Interest
459
291
474
521
588
Total Debt
18,817
23,513
27,643
30,223
31,423
Deferred Tax Liability
199
125
102
102
102
Total Liabilities
24,478
29,648
34,912
38,080
39,298
Application of Funds
Gross Block
14,282
17,393
21,593
24,503
25,793
Accumulated Depreciation
795
827
1,140
1,483
1,896
Net Block
13,487
16,566
20,453
23,020
23,897
Capital WIP
50
19
66
56
56
Investments
469
663
681
786
891
Goodwill
575
582
598
598
598
Current Assets
Inventories
17
14
87
51
47
Sundry Debtors
988
1,046
1,298
1,446
1,564
Cash and Bank Balance
671
939
875
461
370
Loans, Advances & Deposits
2,076
2,579
2,461
2,747
2,796
Other Current Asset
8,782
9,472
11,302
12,173
12,522
Current Liabilities
2,655
2,246
2,933
3,284
3,469
Net Current Assets
9,879
11,803
13,090
13,594
13,830
Deferred Tax Asset
18
16
23
25
25
Total Assets
24,478
29,648
34,912
38,080
39,298
September 15, 2016
11
ITNL | 1QFY2017 Result Update
Cash Flow Statement (Consolidated)
Y/E March (` cr)
FY14
FY15
FY16
FY17E FY18E
Profit before tax
483
481
429
454
556
Depreciation & Amortization Exp.
161
162
293
343
413
Other non-Cash Expenses
(119)
1,358
1,883
2,050
2,350
Change in Working Capital & Oth. Adj.
1,522
(754)
440
(1,651)
(1,553)
Cash Generated from Operations
2,048
1,246
3,045
1,196
1,766
Direct taxes paid
(251)
(178)
(261)
(285)
(225)
Net Cash Flow from Operations
1,797
1,068
2,784
911
1,541
(Inc)/ Dec in Fixed Assets
(3,196)
(2,848)
(3,970)
(2,900)
(1,290)
(Inc)/ Dec in Investments
(60)
(43)
(3)
(105)
(105)
(Inc)/ Dec in Other Investing Cash Flows
(868)
(723)
(725)
(811)
(878)
Cash Flow from Investing
(4,123)
(3,613)
(4,698)
(3,816)
(2,273)
Issue/ (Buy Back) of Equity
746
520
734
0
0
Inc./ (Dec.) in Loans
1,509
4,730
4,481
2,580
1,200
Dividend Paid (Incl. Tax)
(94)
(160)
(220)
(255)
(275)
Other Financing Cash Flows
276
(2,450)
(3,190)
150
(244)
Cash Flow from Financing
2,437
2,639
1,805
2,475
681
Inc./(Dec.) in Cash
111
94
(109)
(430)
(51)
Opening Cash balance & Oth. Adj.
500
596
700
591
161
Closing Cash balances
611
690
591
161
110
September 15, 2016
12
ITNL | 1QFY2017 Result Update
Key Ratios (Consolidated)
Y/E March
FY14
FY15
FY16
FY17E
FY18E
Valuation Ratio (x)
P/E (on FDEPS)
4.9
6.4
13.0
11.3
10.1
P/CEPS
3.7
4.1
5.5
4.7
3.9
Dividend yield (%)
2.7
2.4
2.1
2.5
2.5
EV/Sales
3.1
3.9
3.7
3.7
3.4
EV/EBITDA
10.8
12.8
12.2
11.8
10.7
EV / Total Assets
0.8
0.8
0.9
0.9
0.9
Per Share Data (`)
EPS (fully diluted)
18.7
14.3
7.1
8.1
9.1
Cash EPS
24.6
22.4
16.6
19.4
23.5
DPS
5.1
4.0
3.5
4.0
4.0
Book Value
203
232
203
220
218
Returns (%)
RoCE (Pre-tax)
8.3
6.7
6.8
6.8
7.2
Angel RoIC (Pre-tax)
7.3
6.1
6.3
6.5
7.1
RoE
10.6
7.5
4.3
4.2
5.0
Turnover ratios (x)
Asset Turnover (Gross Block) (x)
0.2
0.1
0.1
0.1
0.1
Inventory / Sales (days)
1
1
2
3
2
Receivables (days)
48
59
54
56
55
Payables (days)
119
91
92
93
91
Leverage Ratios (x)
D/E ratio (x)
3.8
4.1
4.1
4.2
4.4
Interest Coverage Ratio (x)
1.2
1.0
0.9
0.9
1.0
Note- nmf- Not meaningful
September 15, 2016
13
ITNL | 1QFY2017 Result Update
Research Team Tel: 022 - 39357800
DISCLAIMER
Angel Broking Private Limited (hereinafter referred to as “Angel”) is a registered Member of National Stock Exchange of India Limited,
Bombay Stock Exchange Limited and Metropolitan Stock Exchange Limited. It is also registered as a Depository Participant with CDSL
and Portfolio Manager with SEBI. It also has registration with AMFI as a Mutual Fund Distributor. Angel Broking Private Limited is a
registered entity with SEBI for Research Analyst in terms of SEBI (Research Analyst) Regulations, 2014 vide registration number
INH000000164. Angel or its associates has not been debarred/ suspended by SEBI or any other regulatory authority for accessing
/dealing in securities Market. Angel or its associates/analyst has not received any compensation / managed or co-managed public
offering of securities of the company covered by Analyst during the past twelve months.
This document is solely for the personal information of the recipient, and must not be singularly used as the basis of any investment
decision. Nothing in this document should be construed as investment or financial advice. Each recipient of this document should
make such investigations as they deem necessary to arrive at an independent evaluation of an investment in the securities of the
companies referred to in this document (including the merits and risks involved), and should consult their own advisors to determine
the merits and risks of such an investment.
Reports based on technical and derivative analysis center on studying charts of a stock's price movement, outstanding positions and
trading volume, as opposed to focusing on a company's fundamentals and, as such, may not match with a report on a company's
fundamentals. Investors are advised to refer the Fundamental and Technical Research Reports available on our website to evaluate the
contrary view, if any.
The information in this document has been printed on the basis of publicly available information, internal data and other reliable
sources believed to be true, but we do not represent that it is accurate or complete and it should not be relied on as such, as this
document is for general guidance only. Angel Broking Pvt. Limited or any of its affiliates/ group companies shall not be in any way
responsible for any loss or damage that may arise to any person from any inadvertent error in the information contained in this report.
Angel Broking Pvt. Limited has not independently verified all the information contained within this document. Accordingly, we cannot
testify, nor make any representation or warranty, express or implied, to the accuracy, contents or data contained within this document.
While Angel Broking Pvt. Limited endeavors to update on a reasonable basis the information discussed in this material, there may be
regulatory, compliance, or other reasons that prevent us from doing so.
This document is being supplied to you solely for your information, and its contents, information or data may not be reproduced,
redistributed or passed on, directly or indirectly.
Neither Angel Broking Pvt. Limited, nor its directors, employees or affiliates shall be liable for any loss or damage that may arise from
or in connection with the use of this information.
Disclosure of Interest Statement
ITNL
1. Financial interest of research analyst or Angel or his Associate or his relative
No
2. Ownership of 1% or more of the stock by research analyst or Angel or associates or relatives
No
3. Served as an officer, director or employee of the company covered under Research
No
4. Broking relationship with company covered under Research
No
Ratings (Based on expected returns
Buy (> 15%)
Accumulate (5% to 15%)
Neutral (-5 to 5%)
over 12 months investment period):
Reduce (-5% to -15%)
Sell (< -15)
September 15, 2016
14